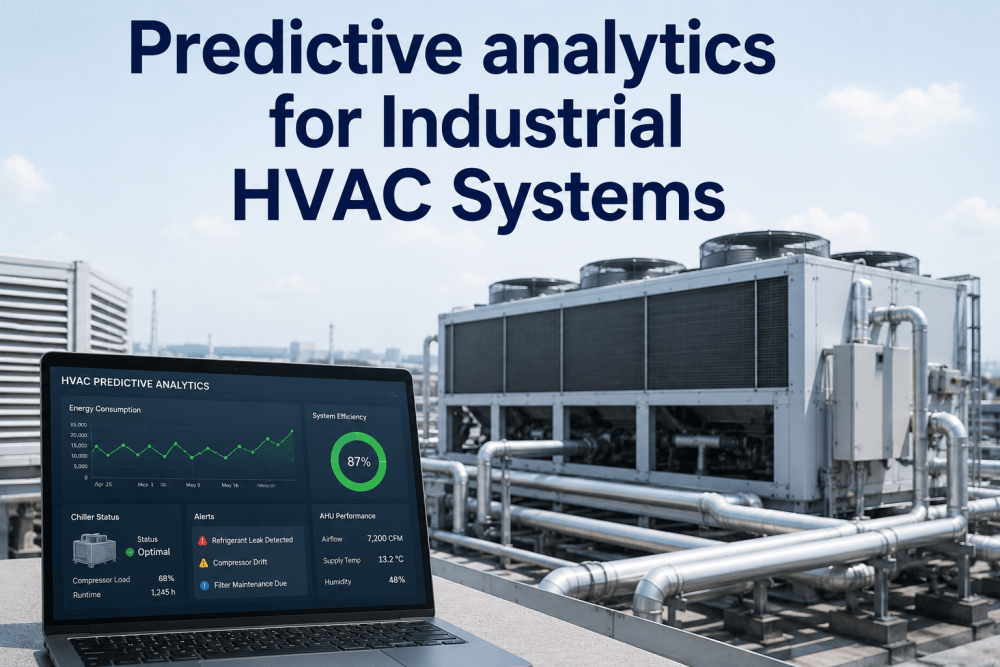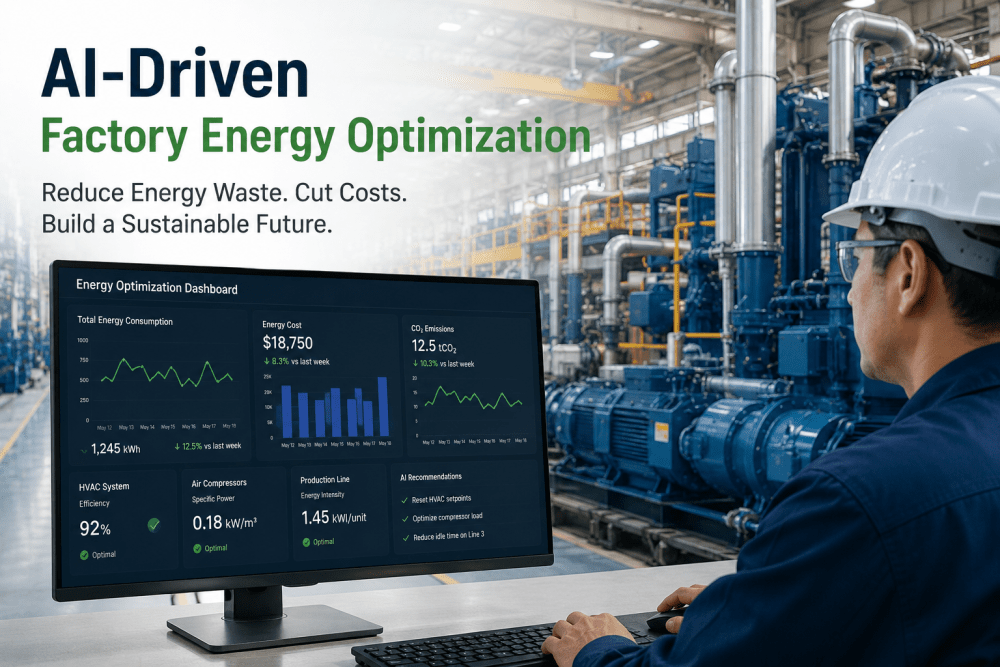
Industrial energy costs are the second-largest controllable expense in U.S. manufacturing operations — and the one where the gap between what facilities are paying and what they should be paying is widest. The average U.S. factory wastes 18 to 30% of its total energy consumption through operational inefficiencies that are invisible to standard utility metering: HVAC systems running at full cooling load in a production bay where occupancy dropped three hours ago, compressed air systems maintaining 120 PSI network pressure for a process that requires 90 PSI, heavy machinery idling at full power between production cycles because no system is monitoring the gap between energy draw and production output, and motor drives running at fixed speed on applications where variable load demand has changed. These are not equipment failures — they are setpoint mismatches, scheduling gaps and control system oversights that generate real energy cost every hour they persist but generate no alarm, no work order, and no visible signal in the utility bill until the monthly invoice arrives. iFactory's AI-driven factory energy optimization platform changes that dynamic: continuous monitoring of HVAC systems, compressed air networks, motor drives, heavy machinery, and process utilities — with AI models that detect operational setpoint deviations, auto-correct controllable parameters within defined operating limits, and alert maintenance and engineering teams to the specific equipment and operational conditions generating the highest energy waste per hour. U.S. manufacturing facilities that have deployed iFactory's energy optimization platform report average utility cost reductions of 12 to 24% within 12 months — without capital equipment replacement — alongside measurable reductions in carbon footprint that support sustainability reporting and regulatory compliance commitments.
Where Factory Energy Is Being Wasted — and Why Standard Metering Never Shows It
A monthly utility bill tells a facility how much energy it consumed. It does not tell them which equipment was consuming energy without producing corresponding output, which setpoints were misconfigured relative to the actual production load, or which operational schedules were generating energy draw during periods of no production activity. That gap between total consumption and operational-waste consumption is where 18 to 30% of the average U.S. factory's energy spend is hiding — and it is invisible to standard metering because standard metering aggregates consumption at the utility meter level, not at the individual equipment and process level where waste originates.
iFactory's energy monitoring platform instruments energy consumption at the equipment level — individual HVAC air handling units, compressor stations, motor drive systems, furnaces, presses, and process utilities — and correlates each equipment's energy draw against its production load, occupancy schedule, and process setpoint in real time. The result is not a meter reading. It is an energy waste attribution map that identifies, by equipment and by shift, exactly where each kilowatt-hour of avoidable consumption is originating. Book a Demo to see iFactory's energy waste attribution dashboard built on your facility's consumption data.
HVAC System Overconsumption
HVAC systems in manufacturing facilities account for 25 to 40% of total facility energy consumption — and are the single largest source of avoidable waste. Fixed scheduling that does not respond to actual occupancy, cooling setpoints that do not adjust to ambient temperature changes, air handling units running full speed during low-production periods, and refrigeration systems maintaining design temperatures in spaces where heat load has dropped are all common waste patterns. iFactory's HVAC monitoring layer tracks each air handling unit's energy draw against the production schedule and ambient conditions — auto-correcting supply air temperature setpoints and fan speed targets within defined limits when the model detects overconsumption relative to actual load.
Compressed Air System Leaks and Overpressure
Compressed air is the most expensive utility in most U.S. manufacturing facilities — at $0.25 to $0.35 per 1,000 cubic feet, a network operating at 10 PSI above actual process requirement is generating 6 to 8% of avoidable compressor energy cost continuously. Undetected air leaks in distribution piping and fittings typically account for 20 to 35% of total compressed air production in aging networks. iFactory detects both overpressure waste and leak-induced demand through flow balance monitoring — comparing compressor output against metered process consumption to identify distribution losses, and tracking pressure differential against the lowest process pressure requirement to identify setpoint reduction opportunities.
Heavy Machinery Idle Energy Draw
Large presses, furnaces, injection molding machines, and rolling mill drives consuming full or near-full power during production gaps — shift change windows, material handling delays, and unscheduled micro-stops — generate energy waste that is proportional to the machine's power rating and invisible in the production output record. A 2,000-ton press consuming 180 kW at idle for 45 minutes per shift wastes 135 kWh daily — $7,000 to $12,000 per year from a single machine. iFactory correlates each machine's energy draw against its production cycle data, flagging idle energy events and recommending automatic standby mode transitions that recover this waste without operator intervention.
Motor Drive Efficiency Degradation
Electric motors represent 70% of industrial electricity consumption in U.S. manufacturing — and motor efficiency degradation through bearing wear, winding degradation, and rotor imbalance silently increases energy consumption by 4 to 12% before the motor generates any alarm condition. iFactory's motor efficiency tracking compares current power factor and input-to-output efficiency against the motor's nameplate and historical baseline, identifying efficiency degradation events that represent both energy waste and impending reliability issues — connecting the energy optimization program to the predictive maintenance program through shared condition monitoring data.
The iFactory WAGES Framework: Complete Industrial Utility Monitoring for U.S. Manufacturing
Industrial energy optimization requires monitoring all utility streams — not just electricity. iFactory's platform is built on the WAGES framework (Water, Air, Gas, Electricity, Steam) — the five utility streams that together constitute 100% of a manufacturing facility's utility cost exposure. Most energy management programs address electricity only, missing the 30 to 45% of total utility cost that is embedded in compressed air, natural gas, steam, and process water consumption. iFactory monitors all five streams with the same equipment-level granularity and AI-driven anomaly detection applied to the electricity monitoring layer.
Process water and cooling water systems in manufacturing facilities generate utility costs through both consumption and treatment. iFactory monitors cooling tower makeup water rates, chiller system water balance, and process water consumption against production volume — identifying consumption spikes that indicate cooling system fouling, tower drift losses, or process water leaks. Auto-correction of cooling tower blowdown frequency and makeup water valve setpoints based on conductivity monitoring reduces water consumption by 8 to 18% and extends cooling system component life by reducing scale and corrosion-driven maintenance frequency. For facilities subject to water discharge permit requirements, iFactory's water monitoring also tracks discharge quality parameters against permit limits — providing compliance visibility alongside cost optimization.
Compressed air monitoring in iFactory covers compressor efficiency (actual output versus rated output at current inlet conditions), system pressure optimization (identifying the lowest network pressure that satisfies all connected process requirements simultaneously), demand-side load profiling (identifying peak demand events that force compressor staging with high energy penalty), and leak detection through flow balance analysis. The platform's compressor sequencing optimization model determines the most energy-efficient combination of compressor stages for each load level — replacing fixed sequencing that may run a large base load compressor at 40% capacity when two smaller units at 80% capacity each would consume significantly less energy for the same output.
Natural gas monitoring focuses on combustion efficiency in furnaces, ovens, boilers, and dryers — the primary natural gas consumers in most manufacturing facilities. iFactory tracks excess air percentage in combustion systems (the single largest driver of natural gas waste in industrial heating), flue gas temperature relative to the theoretical stack temperature for the fuel-air ratio, and burner performance against design efficiency curves. A boiler running at 12% excess air instead of the optimal 2 to 3% is wasting 3 to 4% of its natural gas input continuously. Auto-correction of air-to-fuel ratio setpoints within the combustion control system — where the control interface supports remote setpoint adjustment — generates immediate fuel savings without process impact.
Electricity monitoring in iFactory covers demand charge management (scheduling high-load equipment starts to prevent simultaneous demand peaks that trigger utility demand charges), power factor correction (identifying facilities where reactive power consumption is generating power factor penalties on the utility bill), and motor efficiency degradation tracking. Steam monitoring covers steam trap performance (failed open steam traps are the single largest source of steam waste in most facilities — each failed trap can waste $8,000 to $22,000 per year in steam production cost), distribution system thermal losses, and steam pressure optimization against the lowest process requirement — the same overpressure waste pattern that applies to compressed air but generating higher per-unit energy waste due to steam's higher energy content per unit of pressure.
Energy Optimization Performance Benchmarks: What AI-Driven Monitoring Delivers Across Utility Categories
The performance outcomes of AI-driven energy optimization in U.S. manufacturing facilities have been documented across multiple industries and facility types. The benchmark table below presents the energy reduction ranges achievable by utility category, the typical waste source, and the specific iFactory capability that captures each reduction — giving facility managers and plant engineers the specific numbers required to build a business case for the energy optimization investment. Book a Demo to see a facility-specific energy savings projection built from your utility consumption profile and equipment inventory.
| Utility Category | Typical Waste Source | Energy Reduction Range | Annual Savings at Mid-Size Facility | iFactory Capability |
|---|---|---|---|---|
| HVAC — Electricity | Fixed scheduling, overcooling, AHU overspeeding | 14–28% HVAC electricity reduction | $48K–$180K | Occupancy-responsive setpoint auto-correction, AHU speed optimization |
| Compressed Air — Electricity | Overpressure, leaks, inefficient staging | 18–35% compressed air energy reduction | $62K–$220K | Pressure setpoint optimization, leak detection, compressor sequencing AI |
| Motor Drives — Electricity | Fixed-speed drives on variable loads, efficiency degradation | 8–22% motor energy reduction | $38K–$140K | Motor efficiency trending, VFD setpoint optimization, idle detection |
| Heavy Machinery Idle — Electricity | Full-power idle during shift gaps and micro-stops | 6–14% reduction in machine energy consumption | $22K–$95K | Production-correlated idle detection, auto-standby scheduling |
| Natural Gas — Combustion | Excess air, stack heat loss, burner degradation | 4–12% natural gas consumption reduction | $28K–$110K | Combustion efficiency monitoring, air-to-fuel ratio auto-correction |
| Steam — Distribution | Failed steam traps, overpressure, thermal losses | 10–24% steam system cost reduction | $34K–$145K | Steam trap monitoring, pressure optimization, distribution loss mapping |
| Process Water | Cooling tower losses, process leaks, over-treatment | 8–18% water consumption reduction | $12K–$58K | Flow balance monitoring, blowdown optimization, leak detection |
| Demand Charges — Electricity | Simultaneous high-load starts, unmanaged peak demand | 12–22% demand charge reduction | $24K–$96K | Load scheduling optimization, demand peak prediction and prevention |
How iFactory Connects Energy Optimization to Maintenance and Production Systems
Energy optimization does not operate in isolation from maintenance and production management — the most significant energy waste events in manufacturing are caused by equipment condition degradation, production schedule misalignments, and control system drift that are also maintenance and production concerns. A compressor running at 35% above its design power draw to maintain network pressure has a maintenance problem — fouled intercooler, worn rings, or valve plate degradation — in addition to an energy problem. An HVAC system consuming 20% above its design energy draw has a filter fouling or refrigerant charge problem alongside its energy waste contribution. Separating energy management from maintenance management means solving the same underlying equipment condition problem twice, with two separate teams, using two separate data streams.
Expert Review: What U.S. Plant Engineers and Facility Managers Say About AI Energy Optimization
I have been involved in industrial energy management programs at U.S. manufacturing facilities for sixteen years — everything from simple submetering projects to full ISO 50001 energy management system implementations — and the single most consistent finding across all of them is that the facilities with the largest identified energy savings opportunities are not the ones with the oldest equipment or the least energy-aware management teams. They are the ones with the largest gap between what their utility metering tells them and what is actually happening at the equipment level. A facility with a single utility meter at the service entrance and no submetering below that point knows only its total monthly consumption. Every energy optimization recommendation made from that data is a guess — educated by audit observations, but still a guess. A facility with equipment-level monitoring knows exactly which compressor is running 22% above its design efficiency curve, which HVAC unit is cooling an empty production bay at 3 AM, and which press is drawing 160 kilowatts of idle power for 40 minutes between production cycles. The difference between making energy decisions from total meter data versus equipment-level data is the difference between recommending that someone change their energy behavior and showing them the specific machine, the specific shift, and the specific dollar amount that changes by doing so. That specificity is what converts a well-intentioned energy program into a successful one. iFactory does exactly that — it instruments the equipment, not the utility entrance, and it attributes every dollar of waste to the specific piece of equipment and operational condition generating it. In my experience, that attribution changes the energy conversation at every level of the organization from a cost discussion to an operational efficiency discussion, and that change in framing is what drives the sustained improvement that makes the investment worthwhile.
— Certified Energy Manager (CEM), U.S. Industrial Manufacturing Operations — 16 Years in Energy Management and Facility Engineering — ISO 50001 Lead AuditorConclusion
Factory energy waste is not a capital equipment problem — it is an operational visibility and control problem. The equipment generating 18 to 30% of avoidable energy consumption in the average U.S. manufacturing facility is not broken. It is operating at setpoints that were configured for a production scenario that no longer applies, in schedules that have not been updated since commissioning, and with efficiency degradation that has never been measured against a baseline. The waste is real and quantifiable; it simply requires equipment-level monitoring and AI-driven analysis to make it visible.
iFactory's energy optimization platform delivers that visibility — WAGES monitoring at the equipment level, AI anomaly detection that identifies setpoint mismatches and efficiency deviations in real time, auto-correction of controllable parameters within defined operating limits, maintenance work order generation for energy anomalies with equipment condition root causes, and sustainability reporting that quantifies the carbon impact alongside the cost impact. The 12 to 24% utility cost reductions at comparable facilities are not aspirational benchmarks — they are documented outcomes from making equipment-level energy waste visible for the first time and taking the specific operational actions that the visibility enables. Book a Demo to see iFactory's energy waste attribution analysis built on your facility's utility and equipment data.
Frequently Asked Questions
iFactory's energy platform connects to existing utility submeters, building management systems (BMS/BAS), SCADA and historian platforms, and smart energy meters already installed in most manufacturing facilities via standard BACnet, Modbus, or OPC-UA protocols. For equipment without existing energy metering, iFactory deploys non-invasive current transducers and wireless power meters that install in 15 to 30 minutes per circuit without process interruption. The typical site assessment identifies 60 to 75% of the required monitoring points as already available from existing infrastructure — requiring new hardware only for the gaps.
iFactory's auto-correction capability operates within strictly defined operating envelopes that are configured by the facility's engineering team during deployment — every parameter that can be auto-corrected has a minimum and maximum limit, a rate-of-change limit, and a production-impact override that prevents setpoint changes during active production cycles where the parameter is process-critical. Auto-correction is applied only to utility and auxiliary parameters that have been explicitly authorized by the facility engineering team — typically HVAC supply air temperature, compressed air network pressure, cooling tower fan speed.
ISO 50001 requires facilities to establish energy baselines, identify significant energy uses (SEUs), track energy performance indicators, set energy objectives, and demonstrate continual improvement. iFactory's platform directly supports all five requirements: automated energy baseline calculation from 12 months of historical consumption data, SEU identification from equipment-level consumption analysis, real-time EnPI tracking by production unit and utility stream, target-versus-actual performance dashboards with automated monthly reporting, and energy savings verification audit trail that documents improvement against baseline for certification review.
iFactory calculates Scope 1 emissions (natural gas and other fossil fuel combustion) and Scope 2 emissions (purchased electricity) automatically from the monitored consumption data using EPA emission factors for natural gas and the EPA eGRID location-based or utility market-based emission factors for electricity. The carbon dashboard displays CO₂-equivalent emissions by utility stream, by production unit, and as a carbon intensity metric (CO₂ per unit of production output) — all three formats required by the major ESG reporting frameworks including GHG Protocol, CDP, and GRI.
For a U.S. manufacturing facility with $800K to $2.5M in annual utility spend, iFactory's energy optimization platform deployment runs $52,000 to $135,000 over 4 to 7 weeks — covering BMS and historian integration, equipment-level submetering hardware for monitoring gaps, AI model configuration, auto-correction authorization setup, and sustainability reporting configuration. Against the 12 to 24% utility reduction documented at comparable facilities, a facility spending $1.2M annually on utilities saves $144K to $288K per year from the platform — delivering payback within 2 to 6 months.