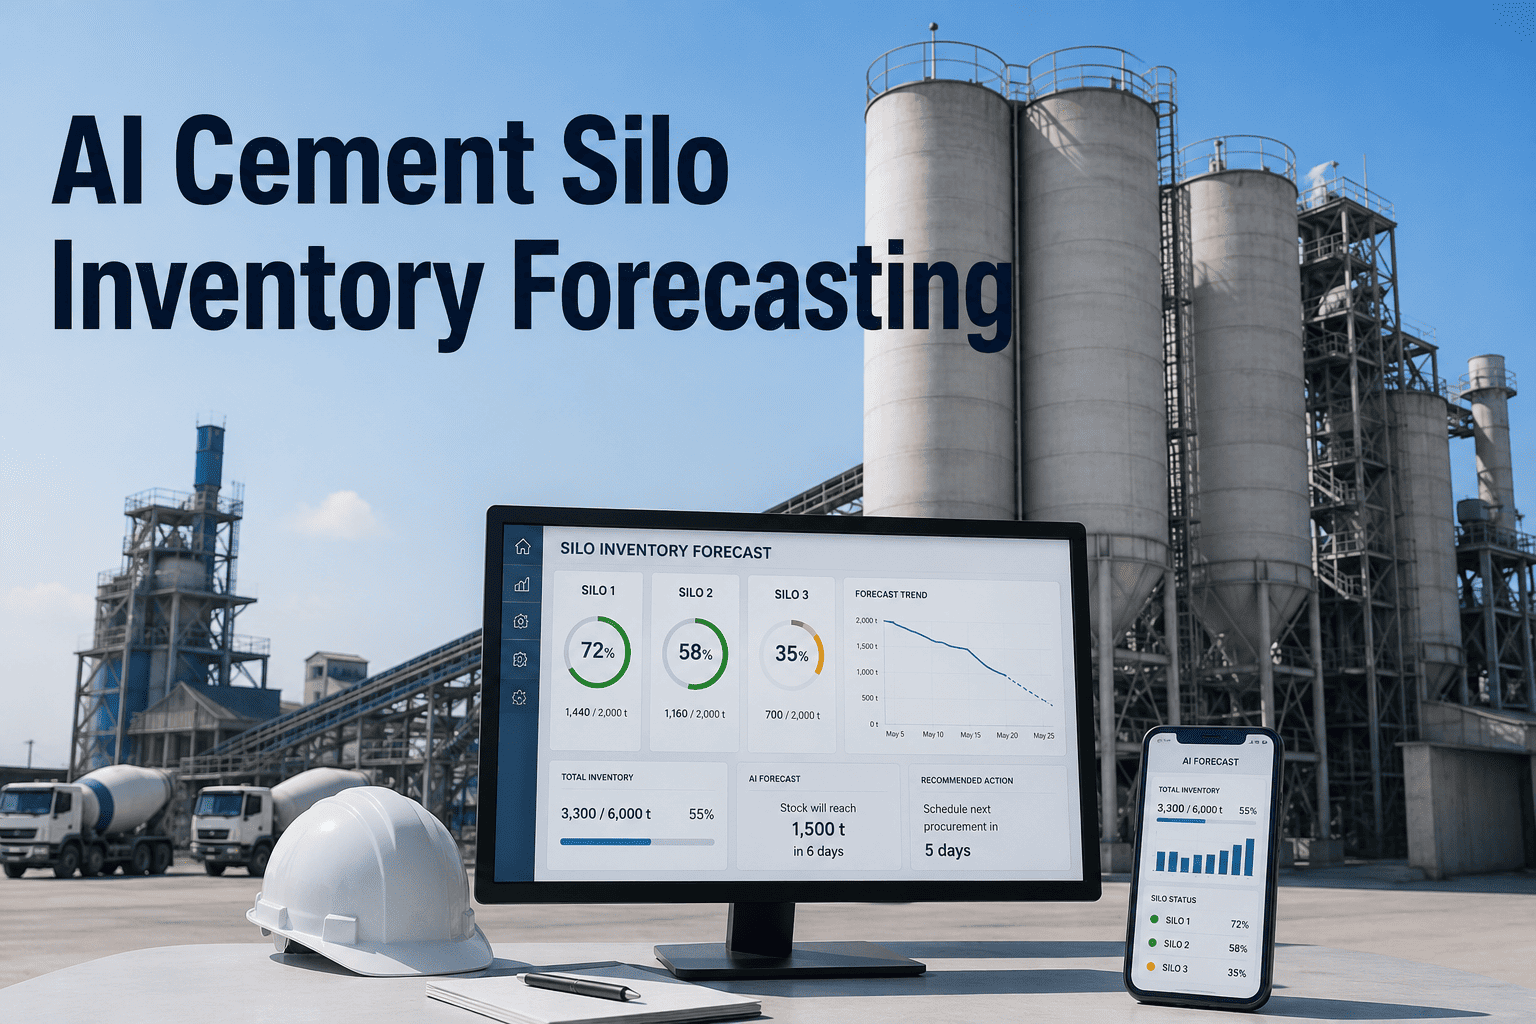
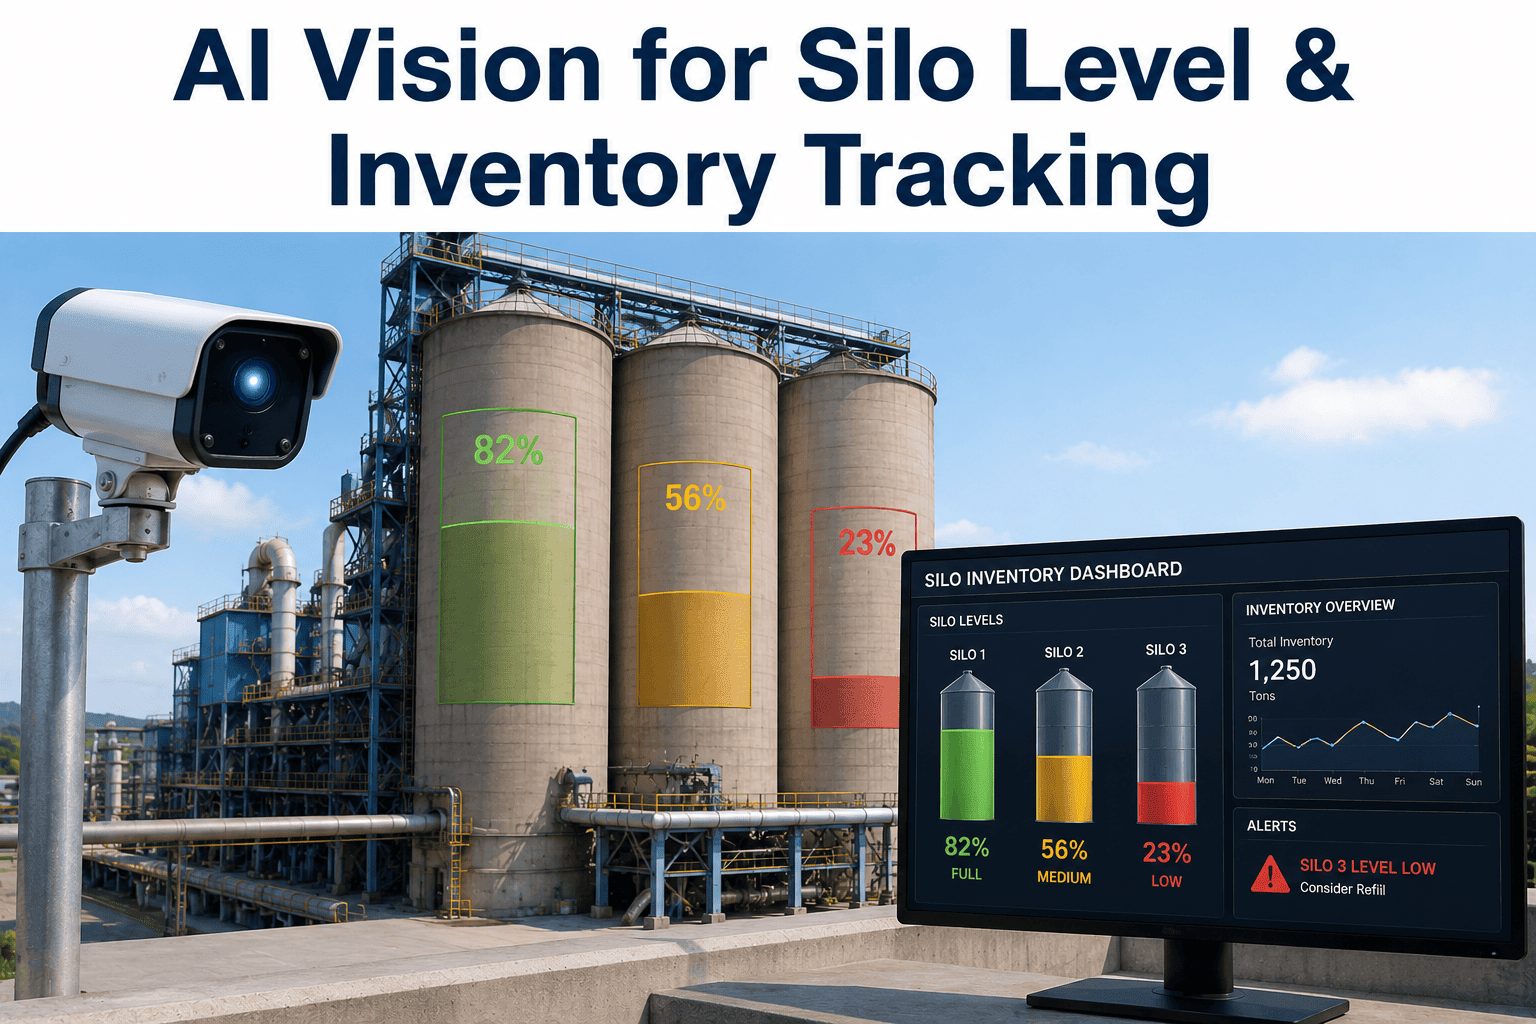
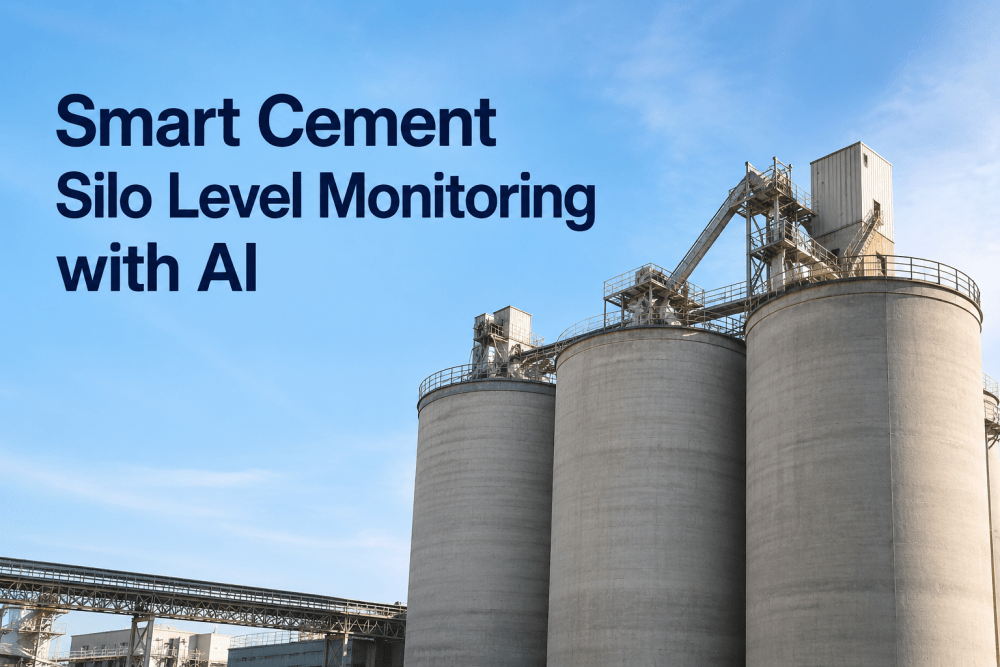
Managing cement silos without real-time level data is a guessing game that costs U.S. cement producers in ways that rarely surface on a single line item. Inventory miscalculations lead to production stoppages when silos run dry unexpectedly, overfilling creates material spillage and structural stress, and material hangups — where cement bridges or ratholes inside the silo — go undetected until a downstream disruption reveals the problem. In a typical U.S. cement plant running 3 to 8 storage silos, these failures collectively account for 6% to 12% of unplanned production downtime annually, yet the data required to prevent them costs a fraction of a single production stoppage. iFactory's Cement Silo Analytics and Level Monitoring solution integrates IoT-based level sensors, structural integrity tracking, automated inspection scheduling, and inventory analytics into the same AI platform managing maintenance, assets, and production — giving operations and plant management continuous visibility into every silo in the facility without manual dip measurements, phone calls to the yard, or spreadsheet-based inventory estimates. Facilities using iFactory's silo monitoring report 68% reduction in unplanned silo-related downtime, 41% improvement in inventory accuracy, and complete elimination of manual level measurement labor across the silo management process.
Cement Silo Analytics and Level Monitoring — Real-Time Inventory Visibility, Structural Safety, and Automated Inspection in One Platform
iFactory's Silo Analytics platform connects level sensors, structural monitoring, and inspection workflows inside the same AI system running your plant's maintenance and assets — delivering continuous silo visibility that eliminates guesswork inventory, prevents hangup events, and flags structural stress before it becomes a failure.
Why Cement Silos Are a Blind Spot in Most U.S. Plant Operations
The operating assumption at many U.S. cement facilities is that silo management is a solved problem — silos fill, silos empty, and the process repeats. The reality is significantly more complex. Cement is a hygroscopic material that absorbs atmospheric moisture, compacts under load, and develops preferential flow channels that create bridging and ratholing conditions invisible from the outside. A silo that reads 60% full on a manual dip gauge may have 40% of its volume locked in a compacted mass that will not flow — which means the inventory number is wrong, the production schedule downstream is built on bad data, and the mechanical failure that eventually dislodges the compacted mass will arrive without warning.
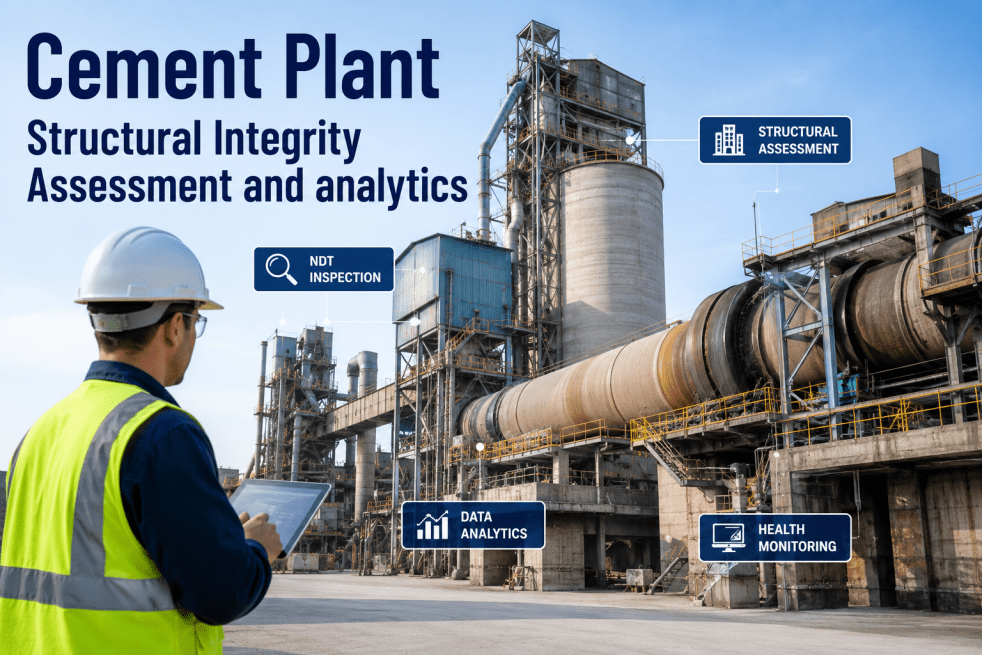
Beyond material behavior, the structural demands on cement silos are severe. Repeated fill-and-draw cycles impose cyclic stress on silo walls, base cones, and discharge mechanisms. Eccentric discharge — where material flows asymmetrically due to bridging or partial blockages — generates lateral loads on silo walls that were not in the original design envelope. These loads accumulate over years of operation, producing cracks, deformation, and fatigue failures that develop slowly enough to be missed by annual visual inspections but fast enough to create serious structural risk between inspection cycles. iFactory's integrated silo platform addresses both the inventory visibility problem and the structural monitoring problem in a single connected system. Book a Demo to see how iFactory's silo analytics platform integrates with your existing plant infrastructure.
Inaccurate Manual Level Readings
Manual dip measurements and visual estimates introduce 10% to 25% inventory error into production planning — errors that cascade into raw material shortages, over-ordering, and dispatch scheduling failures that cost real production time.
Material Hangups and Bridging
Cement bridging and ratholing inside silos creates phantom inventory — the level gauge shows material present, but the material is not flowing. Undetected hangups cause unexpected plant stoppages and require costly manual intervention to clear.
Structural Degradation Undetected
Cyclic loading and eccentric discharge generate wall stresses that accumulate between annual inspection cycles. Without continuous structural monitoring, cracks and deformation develop past safe thresholds before the next scheduled inspection occurs.
Missed Inspection Windows
Silo inspection schedules exist on paper but are rarely tracked with the rigor applied to rotating equipment PM schedules. Inspection tasks slip, documentation is incomplete, and the maintenance history required for structural fitness assessments does not exist in structured form.
No Integration with Production Planning
Silo inventory data that lives in a separate system — or in no system at all — cannot feed production scheduling decisions. The gap between storage visibility and production planning is where dispatch errors, kiln feed disruptions, and shipping mismatches originate.
Overfill and Spillage Risk
Without real-time high-level alerts, silos filling faster than anticipated — due to kiln output surges or dispatch delays — overflow before operators are aware, creating cleanup costs, material waste, environmental compliance exposure, and structural loading that exceeds design limits.
Five Core Capabilities of iFactory's Cement Silo Analytics Platform
iFactory's silo analytics platform is not a standalone level gauge dashboard — it is a fully integrated capability set inside the same operational platform managing preventive maintenance, asset health, work orders, and production data. This integration means that a high-level alert does not just send a notification; it can trigger a work order, update inventory records, and flag a production schedule adjustment simultaneously. The following five capabilities form the foundation of the platform.
Want to see iFactory's silo analytics platform demonstrated on a silo configuration equivalent to your facility's storage layout and sensor infrastructure? Book a Demo with iFactory's plant analytics team.
Silo Monitoring Deployment Outcomes: Year-One Benchmarks Across U.S. Cement Facilities
The table below presents measured first-year outcomes from iFactory silo analytics deployments across U.S. cement, clinker, and bulk materials storage facilities. Figures span operational, financial, and safety dimensions that define the ROI case for plant operations, maintenance, and finance leadership.
| Outcome Category | Pre-Platform Baseline | iFactory Platform — Year 1 | Primary Driver | Annual Value |
|---|---|---|---|---|
| Unplanned Silo Downtime | 6%–12% of production time annually | 68% reduction — avg. 2%–4% annually | Hangup early detection + level alerts prevent stoppages | $180K–$620K downtime cost avoided |
| Inventory Accuracy | 10%–25% error vs. actual stock | 41% improvement — within 3%–5% of actual | Continuous IoT level data replaces manual estimation | Eliminated scheduling errors and over-ordering |
| Manual Measurement Labor | 8–14 hrs/week across 3–8 silo operations | Eliminated — sensor data replaces all manual reads | Automated level reporting to dashboard and ERP | $18K–$42K annual labor cost recovered |
| Structural Anomaly Detection | Annual visual inspection only — 12-month gap | Continuous — deviations flagged in hours | Strain and tilt sensor baseline deviation alerts | Prevented emergency structural repairs ($250K+ avg.) |
| Inspection Compliance Rate | 60%–70% task completion on informal schedules | 96%+ completion with CMMS-managed work orders | Automated scheduling with mandatory documentation | Full audit trail for insurance and regulatory review |
| Overfill and Spillage Events | 2–5 overfill incidents per facility annually | Zero — high-level alerts with 15-min advance warning | Configurable threshold alerts to control room and mobile | $30K–$90K cleanup and environmental cost avoided |
| Dispatch Scheduling Accuracy | Reactive — discovered shortages at loading | Proactive — 12–36 hr advance shortage warning | Days-to-empty projections integrated with dispatch system | Eliminated emergency customer order adjustments |
Silo Analytics Deployment Workflow: From Sensor Audit to Live Production Intelligence
iFactory's silo analytics deployment follows a structured five-phase workflow that converts existing silo infrastructure — regardless of current sensor coverage or monitoring maturity — into a fully operational analytics environment within 6 to 10 weeks. The methodology builds from sensor assessment through integration, configuration, and commissioning to the ongoing operational management that delivers sustained production value.
Silo Infrastructure Audit and Sensor Gap Assessment
iFactory's implementation team conducts a structured audit of existing silo instrumentation — inventorying level sensors, discharge instrumentation, structural sensors, and communication infrastructure across every silo in the facility. The audit identifies sensor gaps, communication protocol compatibility, and installation requirements for silos without existing measurement capability. For facilities with legacy sensors, compatibility with iFactory's integration layer is assessed and protocol adapters are specified where required. The audit output is a facility-specific sensor deployment plan with itemized scope, timeline, and investment breakdown.
Sensor Installation and Calibration
Level sensors, structural monitors, and any required communication gateways are installed during scheduled maintenance windows to minimize production disruption. Sensor installation follows manufacturer specifications and iFactory's certified installation protocols. Each sensor is calibrated against known reference measurements before commissioning — establishing the baseline accuracy that underpins inventory reconciliation. For silos with challenging geometry or material characteristics, calibration includes a 72-hour stability run to validate reading consistency before the sensor is accepted into the live dashboard.
Platform Integration and Dashboard Configuration
Sensor data streams are connected to iFactory's analytics platform through the facility's IoT gateway or direct API integration. Silo profiles are built in the platform with geometry parameters (silo diameter, cone angle, total volume) that convert level readings to tonnage accurately. Dashboard layouts are configured for control room displays, mobile operations access, and management reporting views. Alert thresholds — high level, low level, fill rate anomaly, hangup detection triggers — are set with procurement and operations input based on the facility's specific operational parameters and inventory management requirements.
Inspection Schedule Build and CMMS Integration
The silo inspection program is built inside iFactory's CMMS with task definitions, frequency intervals, responsibility assignments, and documentation requirements for every inspection type applicable to the facility's silo fleet. Integration with the existing CMMS or ERP ensures that silo PM work orders flow through the same approval and completion workflow as other plant maintenance tasks — avoiding the parallel tracking problem that causes inspection tasks to fall through the gaps between systems. Existing inspection history — from paper records or spreadsheets — is digitized and imported into silo asset records to establish the historical baseline for trending.
Operational Handover and Continuous Optimization
Platform handover includes operator training on dashboard interpretation, alert response protocols, and inspection documentation requirements. iFactory's implementation team supports a 30-day commissioning period during which alert thresholds are tuned based on actual operating data and any sensor performance issues are resolved before formal handover. Quarterly optimization reviews assess alert quality, false positive rates, inventory accuracy performance, and any new monitoring requirements that have emerged from operational experience. The platform's AI anomaly detection layer improves over time as silo-specific behavioral patterns accumulate in the dataset.
Want the silo analytics deployment workflow mapped to your facility's silo count, sensor infrastructure, and maintenance calendar? Book a Demo and review your specific deployment plan with iFactory's plant team.
Expert Review: What U.S. Cement Plant Engineers Say About Digital Silo Management
I have managed silo operations at two U.S. cement plants over 22 years, and the consistent failure mode is the same: silos are treated as passive storage vessels when they are actually active mechanical systems with well-understood failure modes that respond predictably to monitoring and maintenance. The plants that treat them that way — with instrumentation, inspection programs, and real-time visibility — spend a fraction of what the plants spend that manage silos reactively.
Conclusion
Cement silo management in U.S. plants has historically operated in the gap between instrumentation and intelligence — level sensors that exist but feed no analytics system, inspection schedules that exist on paper but are tracked informally, and structural monitoring that happens once a year rather than continuously. The cost of that gap is distributed across production downtime, inventory scheduling errors, emergency structural repairs, and compliance exposure — none of which is attributed to silo management in the operating budget, which means the true cost of reactive silo management remains invisible until a serious event makes it undeniable.
iFactory's Cement Silo Analytics and Level Monitoring platform closes that gap by integrating real-time level data, hangup detection, structural health monitoring, and inspection management into the same operational platform managing assets, maintenance, and production across the facility. The 68% reduction in silo-related downtime, 41% improvement in inventory accuracy, and complete elimination of manual measurement labor are the measured outcomes of replacing informal tracking with integrated digital intelligence. Book a Demo to see iFactory's silo analytics platform applied to your facility's storage configuration.
Frequently Asked Questions
Replace Manual Silo Guesswork with Real-Time Analytics and Continuous Structural Safety.
iFactory's Cement Silo Analytics platform delivers continuous level visibility, hangup detection, structural health monitoring, and automated inspection scheduling inside the same AI platform running your maintenance and production operations.