Cement plant structural integrity is the engineering discipline that most plant managers know they should prioritize but rarely have the data to manage systematically. A 3,500-tpd dry-process cement plant typically operates 40 to 60 major structures — preheater towers reaching 120 meters, raw material silos storing 80,000 tons, clinker silos holding 120,000 tons, covered storage buildings spanning 40,000 square meters, conveyor galleries running 800 meters, and baghouse support frames, ductwork supports, foundation blocks, and retaining walls that are not individually tracked but collectively represent the structural backbone of the plant's production capacity. The challenge is that most cement plants in the United States were built between 1955 and 1985, with major expansions in the 1990s and early 2000s. The original design life of reinforced concrete and steel structures in a cement plant environment — exposed to alkali attack, sulfate attack from raw materials, thermal cycling from kiln and cooler operations, and the abrasive environment of cement dust accumulation — is typically 25 to 40 years for primary structures and 15 to 25 years for secondary structures. Many U.S. cement plants are operating structures at 40 to 60 years of service life. The maintenance strategy for these structures is predominantly reactive — a structural issue is identified when a concrete spall is observed during a walkdown, a steel beam is found corroded during a maintenance shutdown, or a foundation settlement is noticed because a conveyor drive train begins to misalign. iFactory's Asset Tracking and Inspection Analytics modules give cement plant maintenance and engineering managers the digital infrastructure to track every structural asset, schedule and record NDT inspections, trend condition data over time, and predict when structural intervention will be required — replacing reactive observation with data-driven structural integrity management. Book a Demo to see iFactory's structural integrity analytics platform configured for your plant's infrastructure.
From Reactive Walkdowns to Data-Driven Structural Health Management — Cement Plant Infrastructure Analytics
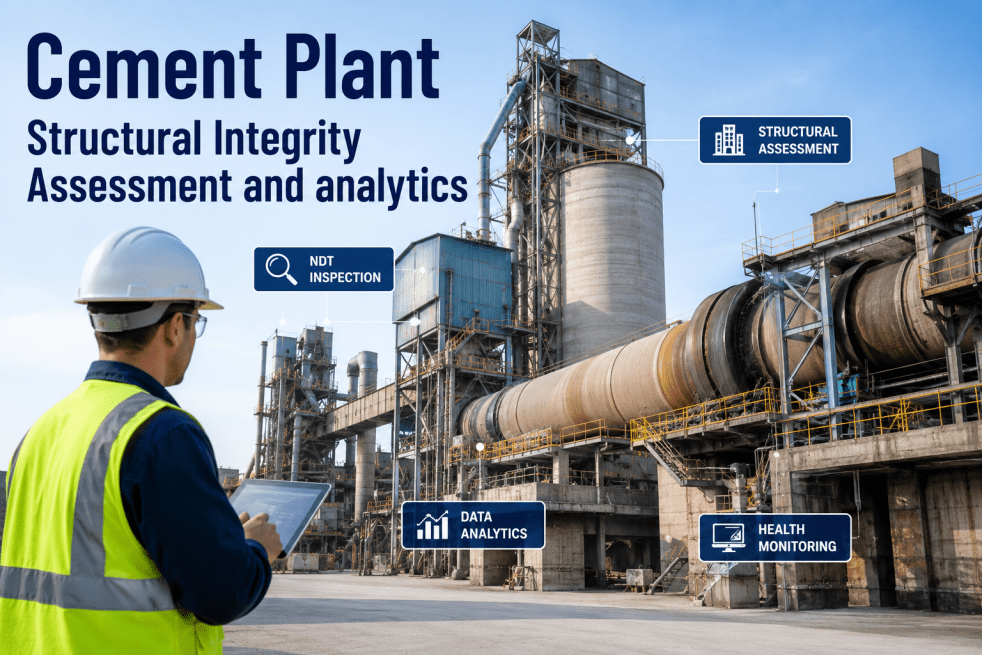
Every preheater tower, silo, conveyor gallery, and support structure in a cement plant generates condition data that can predict structural degradation — if the data is connected, tracked, and trended. iFactory's structural integrity analytics platform manages the inspection schedule, records condition data, and predicts intervention timing for every structural asset in your plant.
Why Cement Plant Structures Deteriorate — and Why Most Plants Do Not See It Coming
The structural integrity challenge at cement plants is not that the structures are poorly designed or that the deterioration mechanisms are unknown. The challenge is that structural degradation in a cement plant environment is slow, distributed across dozens or hundreds of individual assets, and invisible to the operations and maintenance team until it becomes a safety or production risk. The five failure mechanisms below account for the majority of structural integrity issues at U.S. cement plants — and each one is detectable through scheduled NDT inspection and condition trending long before it reaches a critical threshold.
Reinforced concrete carbonation and chloride ingress in preheater towers and silos
Carbonation of reinforced concrete proceeds at 1-3 mm per year in cement plant environments, depending on exposure conditions and concrete quality. In preheater tower columns exposed to kiln exhaust gas containing CO2 and moisture, carbonation rates can reach 5-8 mm per year — reaching the reinforcing steel within 10-15 years in structures designed for a 40-year carbonation depth tolerance. Chloride ingress from raw materials containing chlorides — particularly at plants using alternative fuels containing PVC or other chlorinated compounds — accelerates corrosion initiation once the chloride threshold at the steel surface is exceeded.
Steel corrosion in silo shells, conveyor galleries, and baghouse support structures
Steel structures in cement plants operate in a corrosive environment defined by three factors: cement dust (alkali-rich and hygroscopic), temperature cycling (particularly on preheater tower platforms and ductwork supports near the kiln feed inlet), and condensation exposure (inside silo shells and conveyor galleries where temperature differentials produce surface condensation that activates the alkali in cement dust). Corrosion rates of 0.2-0.5 mm per year are common on uncoated steel surfaces in cement plant environments, and corrosion under insulation is a recurring issue on preheater tower structural steel located behind kiln platform cladding.
Foundation settlement and differential movement in kiln piers and mill foundations
Foundation settlement in cement plants is typically not uniform — it is differential movement caused by variable subsurface conditions, groundwater changes, or load redistribution from equipment modifications. Kiln pier foundations that settle unevenly produce roller path misalignment that increases kiln drive power consumption by 8-15% and accelerates tire and roller wear. Mill foundation settlement produces gear and pinion misalignment that reduces grinding efficiency and increases vibration levels that propagate through the structure.
Thermal fatigue and creep in preheater tower steel and ductwork supports
Preheater tower structural steel and ductwork support frames operate at elevated temperatures — typically 60-120 degrees Celsius at the tower steel, 150-350 degrees Celsius at the ductwork supports near the preheater outlet, and up to 450 degrees Celsius at the kiln feed shelf supports. Thermal cycling during kiln startups, shutdowns, and upset conditions produces cumulative fatigue damage that reduces the remaining service life of structural steel elements. At temperatures above 200 degrees Celsius, carbon steel begins to experience creep — time-dependent deformation that accelerates at higher temperatures and stresses.
Freeze-thaw damage in exterior concrete structures and foundations
Exterior concrete structures at cement plants in freeze-thaw climates — including material storage walls, retaining walls, conveyor trestle foundations, and silo exterior walls — are subject to freeze-thaw cycling that produces surface scaling, internal cracking, and progressive deterioration of the concrete matrix. The presence of deicing salts in areas where plant vehicles operate accelerates the deterioration process through combined freeze-thaw and chloride attack, reducing the service life of exterior concrete elements by 40-60% compared to interior elements.
Six NDT Methods for Cement Plant Structural Integrity Assessment — When and How to Deploy Each
Cement plant structural integrity assessment relies on six primary nondestructive testing methods, each suited to specific structural elements and deterioration mechanisms. Selecting the appropriate NDT method for each structural asset and deterioration mode is the foundation of an effective structural health monitoring program. The method summaries below describe the application, limitations, and data output for each method as deployed at U.S. cement plants.
Visual Inspection (VT) — the baseline method for every structural asset
Visual inspection is the most widely used NDT method in cement plant structural assessment and the starting point for every structural integrity program. A trained inspector examines accessible surfaces of concrete and steel structures for cracking, spalling, corrosion, deformation, and connection condition. Visual inspection at cement plants is most effective when performed by inspectors who understand cement plant deterioration mechanisms and can distinguish between cosmetic surface defects and structurally significant conditions. iFactory's inspection checklists guide the inspector through a standardized assessment for each structural asset type — preheater tower columns, silo walls, conveyor gallery trusses, kiln pier foundations — ensuring consistent data collection and complete coverage of critical structural elements.
Ultrasonic Thickness Measurement (UT) — steel corrosion quantification and wall loss trending
Ultrasonic thickness measurement is the primary NDT method for quantifying corrosion-related wall loss in steel structures — silo shells, conveyor gallery steel, ductwork, baghouse housing, and steel support columns. A UT technician measures the remaining wall thickness at grid points marked on each structural element, and the thickness data is recorded in the asset database for trend comparison against the previous inspection. Corrosion rate calculations based on successive UT measurements allow the engineering team to predict when the wall thickness will reach the minimum allowable value and plan repair or replacement. In cement plant environments, UT is most valuable for silo shells (where internal corrosion from cement dust and condensation is invisible from the exterior) and for ductwork supports in the preheater tower area (where high-temperature corrosion accelerates wall loss).
Rebound Hammer (Schmidt Hammer) — concrete compressive strength estimation on existing structures
The rebound hammer test measures the surface hardness of concrete, which is correlated with compressive strength. In cement plant structural assessment, the rebound hammer is used to evaluate the in-place concrete strength of existing structures where design documentation is unavailable or where concrete degradation is suspected. The test is most valuable for preheater tower columns and silo walls where concrete degradation from carbonation, sulfate attack, or thermal exposure may have reduced the concrete strength below the design value. Rebound hammer results are most reliable when calibrated against concrete cores taken from the same structure and when the concrete surface is prepared by grinding to remove carbonated surface layers that would produce erroneously high readings.
Ground Penetrating Radar (GPR) — reinforcement location and concrete condition assessment
Ground penetrating radar is used in cement plant structural assessment to locate reinforcing steel in concrete structures, identify areas of corrosion-induced concrete delamination, and assess concrete condition in preheater tower columns, silo walls, and foundation elements. GPR surveys produce cross-sectional images of the concrete structure showing the depth and spacing of reinforcement, the presence of voids or delaminations, and areas where corrosion products have accumulated at the steel-concrete interface. GPR is particularly valuable for preheater tower columns where external visual inspection may show no signs of distress while internal corrosion of the reinforcement has already produced significant section loss.
Acoustic Emission (AE) — real-time monitoring of crack propagation and structural distress
Acoustic emission monitoring detects the high-frequency sound waves generated by crack propagation, fiber fracture, or corrosion activity in structural materials. In cement plant applications, AE sensors are mounted on critical structures — preheater tower steel, silo shells, kiln pier foundations — to monitor for active deterioration between scheduled NDT inspections. AE monitoring is particularly valuable for structures where the rate of deterioration is uncertain and where periodic inspection intervals may miss the transition from stable to active deterioration. AE data is transmitted to the iFactory platform for real-time analysis and alert generation when acoustic event rates exceed the baseline established during the initial monitoring period.
Laser Scanning and Photogrammetry — 3D structural mapping and deformation detection
Laser scanning (LiDAR) and photogrammetry produce three-dimensional point cloud models of cement plant structures that can be compared against previous scans to detect deformation, settlement, and structural movement at millimeter-scale resolution. Laser scanning is particularly valuable for preheater tower structures (detecting tower lean or column deformation over time), silo structures (detecting wall deformation from filling and discharge cycles), and conveyor galleries (detecting support settlement or truss deformation). The point cloud data is registered against the plant's coordinate system and compared with the as-built design model to identify deviations that may indicate structural distress.
Structural Integrity Assessment Methods — Inspection Frequency, Cost, and Application by Structure Type
An effective structural integrity management program for a cement plant requires selecting the appropriate assessment method and inspection frequency for each structural asset, based on the asset's condition, criticality, and deterioration rate. The table below presents the recommended inspection approach for the major structural asset categories at a typical U.S. cement plant, based on industry practice and PCA structural integrity guidelines.
| Structure Type | Primary NDT Method | Inspection Frequency | Inspection Cost per Event | Key Condition Indicators Tracked |
|---|---|---|---|---|
| Preheater Tower — concrete columns | Visual + Rebound Hammer + GPR | Annual visual; biannual Rebound + GPR | $8,000-18,000 | Crack width and pattern, reinforcement depth, concrete strength trend, carbonation depth |
| Preheater Tower — steel platforms | Visual + UT thickness | Annual visual; biannual UT | $6,000-14,000 | Corrosion rate, section loss, connection condition, thermal fatigue cracking |
| Raw material and clinker silos | Visual exterior + UT shell + AE monitoring | Annual visual + UT; continuous AE for critical silos | $12,000-28,000 | Wall thickness trend, crack propagation, deformation, acoustic emission rate |
| Conveyor galleries and trestles | Visual + UT + laser scanning | Annual visual + UT; laser scan every 3 years | $5,000-12,000 | Steel corrosion rate, truss deformation, support settlement, connection integrity |
| Kiln piers and mill foundations | Visual + settlement survey + AE | Quarterly settlement survey; annual visual; continuous AE for active settlement areas | $4,000-10,000 | Differential settlement trend, crack propagation, vibration level, kiln/mill alignment |
| Baghouse support structures | Visual + UT thickness | Annual visual + UT | $3,000-8,000 | Corrosion rate (accelerated by dust accumulation), connection condition, vibration-induced fatigue |
| Covered storage buildings | Visual + UT (steel frame) + Rebound (concrete walls) | Biennial visual + UT | $5,000-14,000 | Steel corrosion rate, concrete degradation, roof truss condition, foundation settlement |
| Retaining walls and material storage walls | Visual + settlement survey + inclinometer | Annual visual + settlement; inclinometer every 2 years | $3,000-8,000 | Wall movement trend, drainage condition, crack propagation, tilt angle |
Structural Integrity Management Program — Implementation Checklist for Cement Plant Engineering Teams
Establishing a structural integrity management program for a cement plant requires work across six domains — asset inventory, condition baseline, inspection schedule, data management, intervention planning, and program governance. The checklist below covers the essential elements that iFactory's implementation team reviews during the structural integrity analytics deployment at each cement plant.
Structural asset inventory with criticality ranking
Every structural asset is identified, photographed, located on the plant layout drawing, and assigned a criticality ranking (based on safety consequence and production impact of structural failure). The inventory includes the structure type, construction material, age, design life, and known modification history. Typical cement plants have 120-250 distinct structural assets in the inventory.
Baseline condition assessment for all critical and high-criticality structures
Each structure receives an initial condition assessment using the appropriate NDT methods, establishing the baseline condition score (using a standardized 1-5 scale from "excellent" to "critical") and the baseline thickness, crack pattern, and deformation measurements against which future inspections will be compared.
Risk-based inspection schedule by structure type and condition grade
Each structural asset is assigned an inspection frequency based on its criticality ranking and current condition grade. Higher-criticality structures and structures with lower condition grades are inspected more frequently. The inspection schedule is built into the iFactory platform with automated notifications to the engineering team when inspections are due or overdue.
Inspection checklist templates by structure type
Standardized inspection checklists are configured in the iFactory platform for each structural asset type — covering the visual inspection elements, NDT measurement points, photographic documentation requirements, and condition grading criteria relevant to that structure type. The checklist ensures consistent data collection across inspection cycles and across different inspectors.
Condition data trending and threshold-based alert configuration
iFactory trends every condition data point from every inspection event — concrete crack width, steel thickness, foundation elevation, deformation measurement — and compares the latest value against the trend line and against the alert threshold. When the trend projects that a condition will reach the alert threshold before the next scheduled inspection, the system generates a recommended inspection acceleration notification.
Intervention planning and capital project tracking integration
When an inspection identifies a condition that requires structural intervention — concrete repair, steel reinforcement, foundation stabilization, or structure replacement — the iFactory platform creates a work order or capital project record with the condition data, repair scope, estimated cost, and priority ranking linked to the specific structural asset. The intervention plan is tracked through completion, with the post-repair condition data establishing the new baseline for the structure.
Your Cement Plant's Structures Are Telling You When They Will Need Repair — iFactory Makes Sure You Hear It
Every preheater tower column, every silo wall, every conveyor gallery truss produces condition data that reveals the rate of deterioration — if the data is collected consistently, trended over time, and compared against thresholds that trigger action before the condition becomes critical. iFactory connects the inspection data, surfaces the trends, and alerts your engineering team before the structural issue becomes a safety or production risk. Book a demo and see the system managing structural integrity data for a U.S. cement plant today.
Deploying Structural Integrity Analytics at a Cement Plant — A Phased Approach
iFactory's structural integrity analytics module is deployed in five phases, from asset inventory through full operational capability. Each phase builds on the previous phase and delivers measurable value before the next phase begins.
Phase 1: Asset Inventory and Criticality Ranking
iFactory engineers conduct the structural asset inventory, photograph each structure, record its specifications and history, and assign criticality rankings. The asset database is built in the iFactory platform with photo documentation and location mapping. Duration: 2-3 weeks.
Phase 2: Baseline Condition Assessment
NDT inspection teams perform baseline condition assessments on all critical and high-criticality structures using the appropriate NDT methods. Baseline condition data is recorded in the iFactory platform with photo documentation, measurement data, and condition grade. Duration: 4-6 weeks.
Phase 3: Inspection Schedule and Alert Configuration
Risk-based inspection schedules are configured with automated due-date alerts. Condition data trending is activated for all inspected structures. Threshold-based alerts are configured for each trackable condition parameter. Duration: 1-2 weeks.
Phase 4: Team Training and Program Launch
Engineering and maintenance teams receive hands-on training on the iFactory platform for inspection data entry, condition trend review, and alert management. The structural integrity management program launches with a complete review of all baseline data and inspection schedules. Duration: 1 week.
Phase 5: Continuous Improvement and Annual Program Review
Inspection data accumulates with each inspection cycle, improving the accuracy of condition trend projections. Annual program review updates criticality rankings, adjusts inspection frequencies based on condition trends, and updates intervention plans. Duration: ongoing.
What Cement Plant Engineering Leaders Say About Structural Integrity Data Management
I have been responsible for structural integrity management at three U.S. cement plants over my career — a 2,800-tpd wet-process plant in Pennsylvania that was built in 1959, a 4,200-tpd dry-process plant in Missouri built in 1972 with major expansions in 1998, and a 3,600-tpd dry-process plant in Texas built in 1981. The common thread across all three facilities is that the structural integrity data existed — inspection reports from the annual walkdowns, concrete core test results from the 1990s preheater tower assessments, steel thickness measurements from the silo inspections — but it existed in file cabinets, in individual engineer's hard drives, in the corporate engineering office's document management system, and in the memories of the senior maintenance team members who had been at the plant for 25 years. When I arrived at the Texas plant in 2019, I asked for the structural inspection history for the preheater tower. It took me three weeks to assemble the available records from the plant file room, the corporate engineering office in a different state, and the retired engineering manager who had the most comprehensive set of inspection photos in his personal cloud storage. The records that existed showed that the preheater tower concrete columns had been assessed by a structural engineering consultant in 2004, 2010, and 2015 — three separate inspection events, each using a different condition grading system, each producing a different report format, and none of them directly comparable to establish a trend. The 2004 report said the columns were in "good" condition. The 2010 report said "moderate" deterioration was present. The 2015 report identified "significant" cracking and spalling on the north face of the tower at elevation 45 meters. Three data points, three different qualitative scales, no numerical measurement that could be compared, and no way to determine whether the deterioration rate was accelerating, stable, or slowing. When we deployed the iFactory structural integrity platform at that plant, one of the first things we did was establish a standard condition grading system and a consistent measurement protocol for crack width, spalled area, and concrete strength. The second thing we did was digitize the historical inspection data into the platform so that the 2004, 2010, and 2015 reports became comparable baselines. The third thing was configure the platform to generate condition trend projections that tell us when each structure will reach the threshold that requires intervention. The difference between managing structural integrity through file cabinets and managing it through a connected analytics platform is the difference between having data and having actionable information. Data tells you what condition the structure was in at the time of the last inspection. Actionable information tells you when it will reach the condition that requires repair, and gives you enough lead time to plan the work during a scheduled outage rather than during an emergency shutdown.
— Director of Engineering, U.S. Cement Manufacturing — 25 Years Structural Integrity and Plant Engineering — Licensed Professional Engineer (Structural) — PCA Cement Plant Structural Committee MemberCommon Questions About Cement Plant Structural Integrity Assessment and Analytics
Structural Integrity Assessment Turns an Aging Infrastructure Liability into a Managed Asset — If You Connect the Data
Every preheater tower column, every silo shell, every conveyor gallery truss in a cement plant produces condition data that can reveal the rate of deterioration — crack width trends from successive visual inspections, wall thickness trends from annual UT measurements, deformation trends from periodic laser scans, settlement trends from quarterly foundation surveys. The data exists. The inspection methods are established. The engineering standards are published by PCA, ACI, and AISC. What is missing in most cement plants is the digital infrastructure that connects the inspection data from each structure across successive inspection cycles, compares the actual deterioration rate against the predicted rate, and alerts the engineering team when the condition trend projects that a structure will reach its intervention threshold before the next scheduled inspection.
iFactory's Asset Tracking and Inspection Analytics modules provide cement plant engineering and maintenance teams with the digital infrastructure to track every structural asset from baseline inspection through intervention — recording condition data in a standardized format, trending measurements over time, predicting when each structure will require repair or replacement, and generating the documentation required for regulatory compliance, insurance underwriting, and corporate capital planning. The transition from file-cabinet structural integrity management to data-driven structural health monitoring is not a technology project — it is an engineering management discipline that determines whether a 50-year-old preheater tower operates safely for another 20 years or becomes a structural risk that drives an unplanned multi-million-dollar replacement. Book a Demo to see how iFactory's platform manages structural integrity data, NDT inspection schedules, and condition trending for cement plant infrastructure assets.
Your Plant's Structural Inspection Data Already Contains the Trend of the Next Deterioration — iFactory Surfaces It Before the Crack Becomes a Critical Finding
Every visual inspection, UT measurement, and foundation survey produces data that iFactory connects into a predictive picture of your plant's structural health. Book a demo and see the platform configured for your cement plant's structural assets today.


.png)