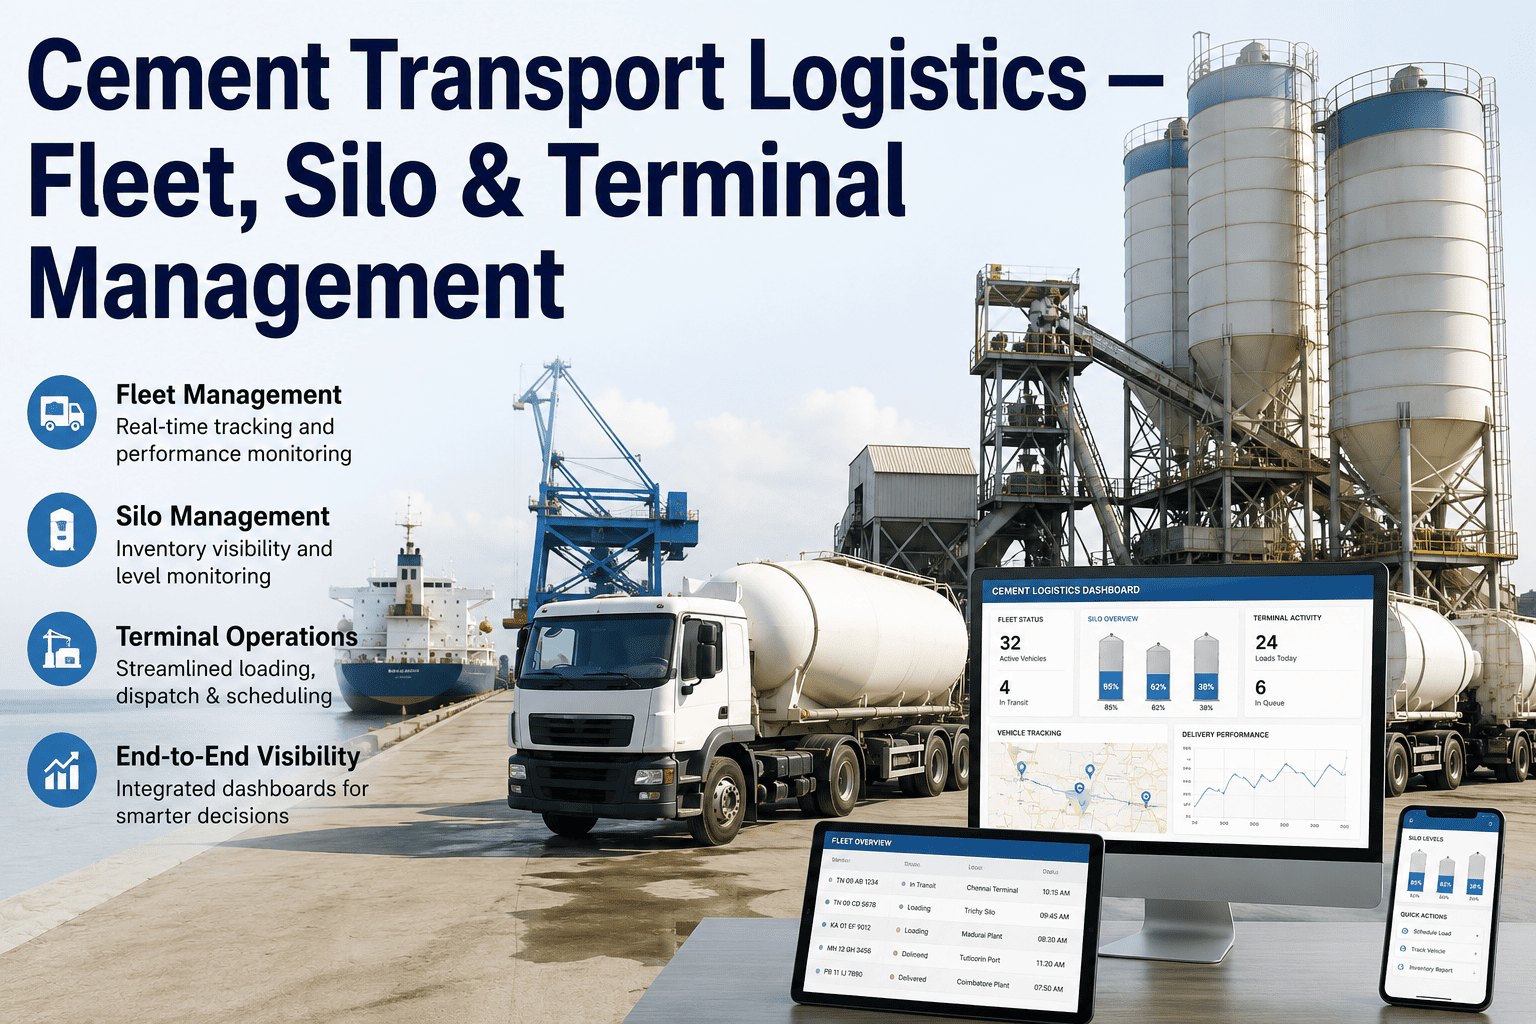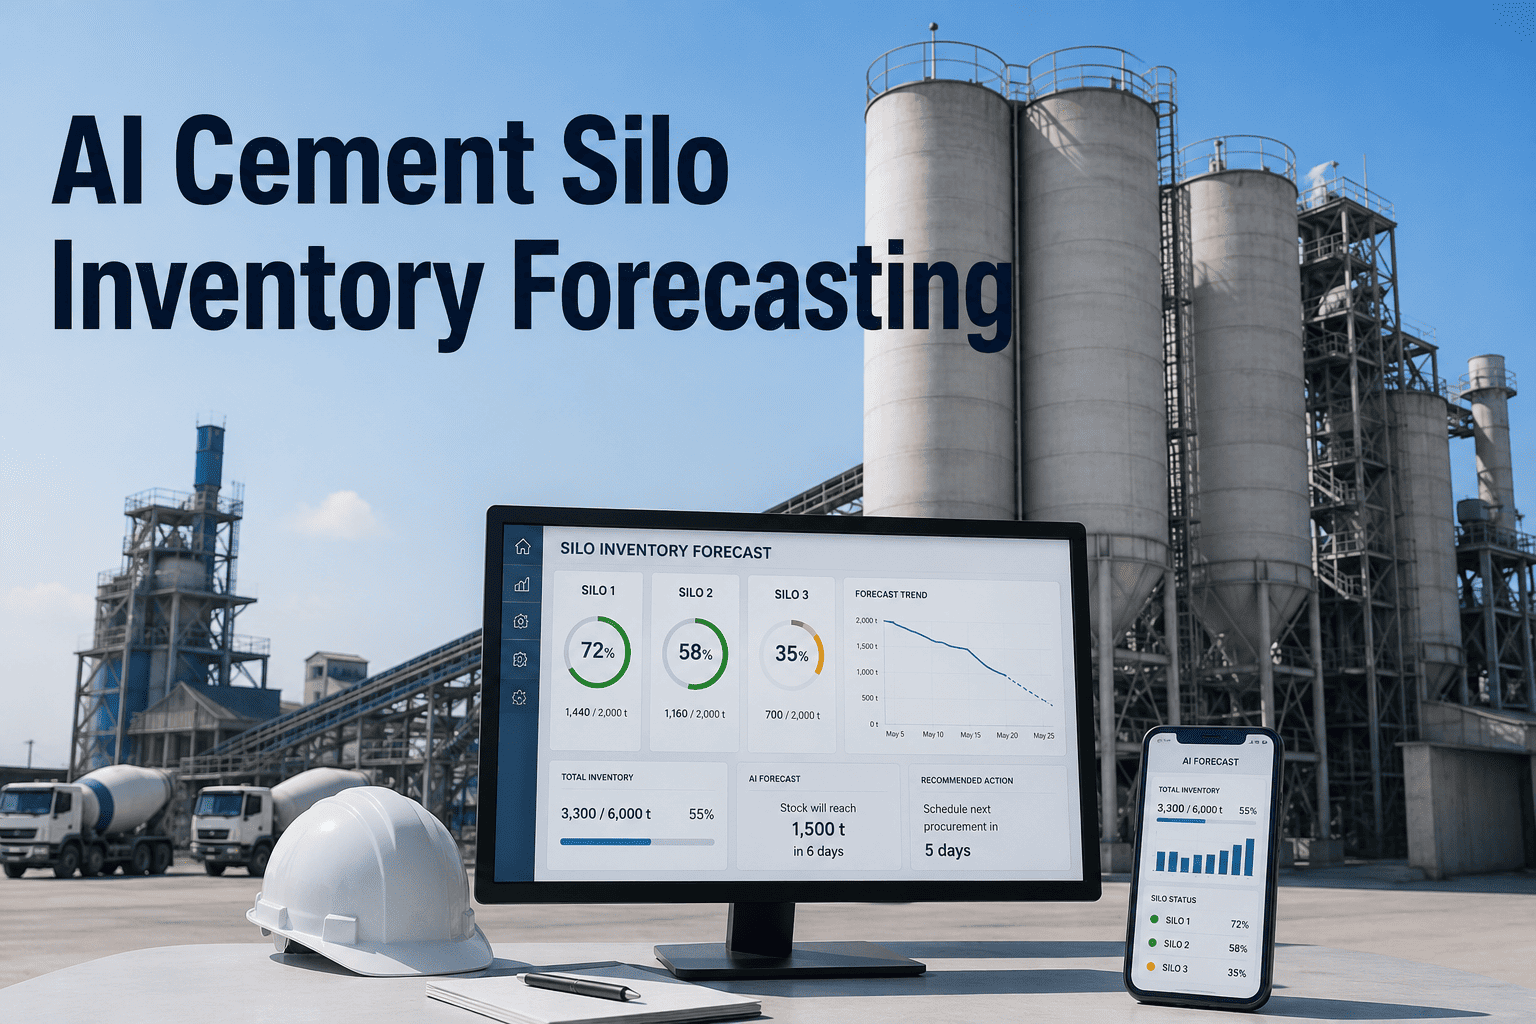
A silo reading "60% full" on a control room screen is often wrong by the time anyone acts on it — clinker bridges, dead zones form near the walls, and level sensors drift out of calibration between inspections. Dispatch teams end up planning truck loadouts and rail cars around a number that was accurate yesterday, not now, and the two outcomes that follow are painfully familiar: a silo runs unexpectedly low and forces a rushed reactive fill, or a silo sits near capacity while product that should have shipped keeps piling up behind it. AI-based silo inventory forecasting replaces the single stale reading with a live model that combines level sensor data, production rate, and historical draw-down patterns to predict what each silo will hold hours or days ahead, not just what it holds right now. Book a forecasting demo to see it running against your own silo network.
Know What Every Silo Will Hold Before It Gets There
AI forecasting turns level sensor noise and production variability into a dependable prediction of silo inventory hours and days ahead, so dispatch planning stops chasing a number that is already out of date.
Silo 1
Silo 2
Silo 3
Silo 4
What a Bad Inventory Number Actually Costs
Inventory forecasting errors rarely stay contained to one silo. A single missed reorder point can cascade into a rushed rail booking, an idled loadout bay, or a customer order that ships late.
typical error margin between manual level readings and true usable inventory once bridging and dead zones are accounted for
lead time dispatch teams need to book rail cars or trucks, which manual reactive planning rarely allows
reported stockout events traced back to a silo reading that had drifted from actual usable product
From Raw Sensor Data to a Dispatch-Ready Forecast
Forecasting accuracy comes from combining several data streams that, on their own, each tell an incomplete story.
Continuous level and weight data
Radar, ultrasonic, or load-cell readings feed in continuously rather than on a fixed inspection schedule, catching draw-down trends as they happen.
Production and grinding rate correlation
Mill output and packing rates are cross-referenced against silo fill trends to separate genuine inventory change from short-term sensor noise.
Historical draw-down pattern modeling
Seasonal demand patterns, day-of-week dispatch cycles, and known bridging behavior for each silo are folded into the prediction model.
Rolling forecast output
The model outputs a rolling 24 to 72 hour projection per silo, refreshed continuously as new sensor and production data arrives.
Automated dispatch alerts
When a forecast crosses a reorder threshold, a dispatch alert fires early enough to book transport before the silo actually runs low.
See Your Silo Network's Forecast Accuracy Gap
iFactory reviews your current level-sensor data against actual dispatch and production records to show where manual readings are drifting from true usable inventory.
Manual Reading vs. AI Forecasting
The difference is not just accuracy — it is how far ahead a dispatch team can see, and how much lead time that buys for booking transport.
What Changes When Forecasting Replaces Manual Readings
Figures reflect typical results in the first two dispatch cycles after AI forecasting goes live across a cement plant's silo network.
Connecting Forecasting to How Dispatch Actually Works
A forecast only creates value once it reaches the people booking transport and the systems tracking orders. Getting that connection right is usually more of the project than the forecasting model itself.
ERP and order system linkage
Forecasted inventory levels are matched against open sales orders so dispatch can see not just how much product is coming, but whether it is enough to cover commitments already on the books.
Grade changeover awareness
Silos that switch between cement grades introduce a transition period where forecasting has to account for a partial mix, and the model flags this window explicitly rather than reporting a single blended number.
Transport booking lead time rules
Alert thresholds are configured against your actual rail and trucking lead times, so an alert fires early enough to book transport rather than simply confirming a shortage that is already too close to act on.
Exception handling for planned maintenance
When a silo is taken offline for inspection or repair, forecasting automatically reallocates expected draw-down to the remaining silos in that product group rather than producing a misleading gap in the projection.
A Logistics Manager's View on Forecasted Dispatch
We used to plan rail bookings around whatever the level gauge said that morning, and half the time it didn't match what actually loaded out. Once the forecast started accounting for bridging and grinding rate together, our planning window went from same-day guesswork to a three-day view we could actually book transport against. The number of emergency truck calls dropped almost immediately.
Where the Savings Actually Show Up
Silo forecasting rarely gets budgeted as a standalone project, and the value usually shows up spread across transport costs, customer service metrics, and production planning rather than one single line item.
Transport cost efficiency
Planned rail and truck bookings made days in advance are consistently cheaper than emergency transport arranged the same day a silo runs unexpectedly low, and the gap widens further during peak shipping seasons when spot capacity is scarce.
Order fulfillment reliability
Customers rarely tolerate a shipment delay caused by an inventory surprise, and repeated late fulfillment is one of the fastest ways a cement producer loses a repeat contractor account to a competitor with better logistics visibility.
Production scheduling alignment
Knowing which silos will approach capacity days ahead lets production scheduling adjust grinding rates or grade changeovers proactively, rather than discovering a full silo only once it starts backing up the mill.
The Bottom Line on Silo Inventory Forecasting
A silo level reading tells a dispatch team where inventory stands right now, and that is rarely the number that matters. What actually drives good decisions is a dependable view of where inventory is heading over the next two to three days, built from sensor data, production rate, and each silo's own historical behavior. That is the difference between booking transport calmly ahead of time and scrambling to cover a stockout that should never have been a surprise.
Frequently Asked Questions
How does the model handle bridging and dead zones inside a silo?
The forecasting model learns each silo's own bridging behavior from historical draw-down patterns rather than assuming a uniform emptying rate across the full volume. Over time it builds a per-silo profile of where product tends to hang up and how much of the reported level is genuinely usable, which is the gap that causes most manual reading errors in the first place. Book a demo to see this modeled against your own silo history.
Does this require replacing our existing level sensors?
No — the forecasting layer works with whatever level sensing is already installed, whether that is radar, ultrasonic, or load-cell based, and simply combines that continuous data stream with production and historical patterns. Sensor replacement is only recommended where existing hardware is unreliable or has significant calibration drift, not as a prerequisite for forecasting.
How far ahead can the forecast actually be trusted?
Accuracy is highest in the 24 to 48 hour window and remains dependable out to 72 hours for most silos, though volatility rises for silos with irregular demand patterns or frequent grade changes. The system flags its own confidence level per silo so a dispatch planner knows which forecasts to treat as firm and which need a wider safety margin.
Can this help balance inventory across multiple silos automatically?
Yes — when several silos hold the same product grade, the system ranks them by forecasted depletion and can recommend which silo to draw from first to keep the network balanced rather than leaving one silo chronically low while another sits near capacity. This is especially useful during grade changeovers or planned maintenance on a specific silo.
How is this connected to our dispatch and order management system?
Forecast thresholds trigger dispatch alerts that can route directly into an existing order management or ERP system as a flagged reorder or transport-booking task, rather than living in a separate standalone dashboard. Talk to a specialist about integrating this with your specific dispatch or ERP platform.
Stop Planning Dispatch Around Yesterday's Silo Reading
Book a 30-minute assessment. iFactory maps your silo network's forecast accuracy against actual dispatch history and shows where a rolling forecast changes the planning window.