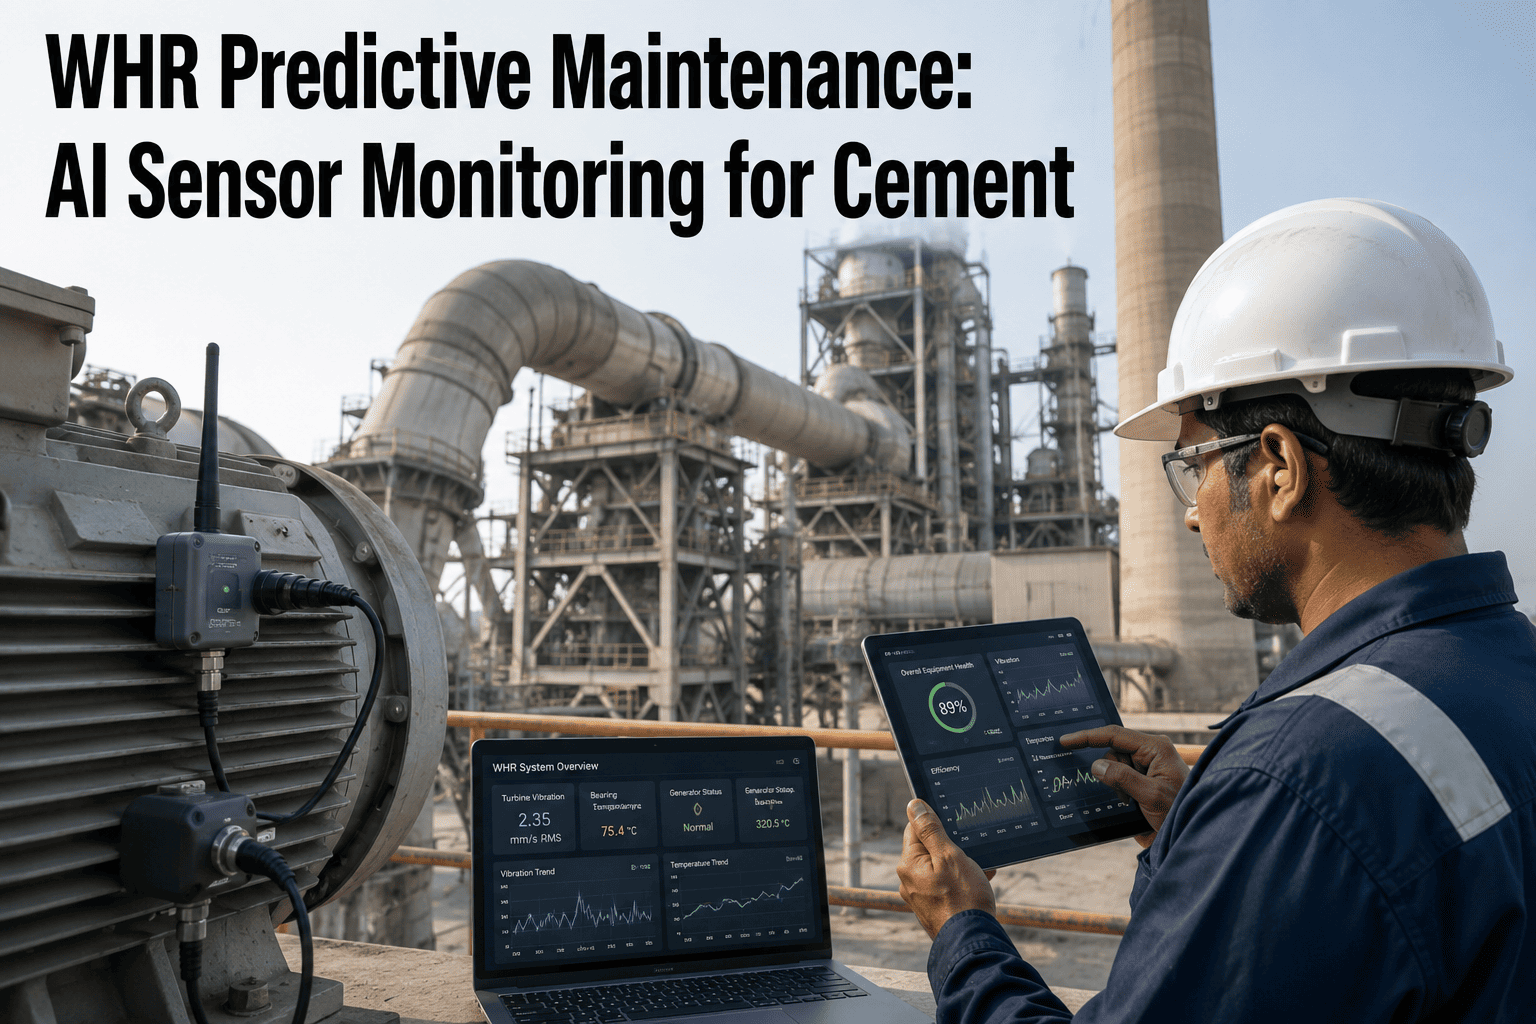
Most WHR equipment failures do not happen without warning — they happen without anyone reading the warning in time. A boiler tube that ruptures on a Tuesday afternoon has usually been thinning for weeks, and a feed pump that seizes overnight has usually been running a slightly elevated bearing temperature for days before anyone noticed. The sensors already on most WHR systems are recording exactly this kind of drift, but a threshold-based alarm is built to fire only once a value crosses a hard limit, which is typically the same moment the failure is already underway. AI predictive maintenance closes that gap by reading the pattern in the data instead of waiting for the limit, which is the difference iFactory's process team demonstrates on live plant data, and you can book a demo to see it run against your own WHR equipment.
Your WHR Sensors Already Saw the Failure Coming — Nobody Was Watching the Pattern
Turbine vibration, boiler tube wall thickness, and pump bearing temperature all leave a trail of small deviations for days or weeks before a failure becomes an alarm. iFactory's AI models that trail continuously against each asset's own operating baseline, turning a threshold breach into an early warning long before it becomes a forced outage.
WHR Equipment Doesn't Fail the Same Way Twice — Or the Same Way Across Asset Classes
A generic maintenance schedule applied uniformly across turbines, boiler tubes, and pumps is one of the most common causes of chronic WHR underperformance, because each asset class degrades through a completely different physical mechanism and leaves a completely different signature in the data. Reading them through the same lens misses most of what actually matters.
Turbine
Vibration drift, blade fatigue, bearing wear, thermal stress cycling
AI signal: vibration spectrum trend against baseline, bearing temperature slope, isentropic efficiency deviation
Boiler Tubes
Wall thinning, corrosion fatigue, overheating, scale and dust fouling
AI signal: tube metal temperature trend, heat flux anomaly, acoustic signature change, wall thickness slope
Feed Pumps
Bearing wear, seal degradation, cavitation, impeller clearance loss
AI signal: vibration signature, bearing temperature trend, differential pressure deviation from design curve
What's Actually Causing the Tube Failure Determines What the Sensors Should Be Watching
Boiler tube failures remain the single largest cause of forced outages in heat recovery equipment, and dust loading from the cement process accelerates several of these mechanisms further. Treating every tube alarm as the same problem wastes inspection time on the wrong root cause.
| Failure Mechanism | Approx. Share of Cases | AI Detection Signature |
|---|---|---|
| Thermal fatigue cracking | 30% – 40% | Cyclic stress accumulation and localized temperature anomalies |
| Oxygen pitting corrosion | 20% – 30% | Dissolved oxygen trend and progressive wall thinning pattern |
| Caustic corrosion / under-deposit attack | 15% – 20% | Feedwater pH excursions and localized heat flux changes |
| Erosion and dust/fly-ash damage | 10% – 15% | Acoustic signature change and localized gouging pattern |
What makes these mechanisms genuinely dangerous is not their severity — most develop slowly, over days to weeks — but the fact that traditional monitoring only sees the final rupture, not the weeks of developing conditions that preceded it. Research on AI-based tube leak detection has found that pattern-based models can flag a developing leak several minutes before a plant's own safety system trips, and can flag the underlying degradation trend weeks earlier still, which is the window where a planned repair replaces an emergency one.
The practical value of separating these four mechanisms rather than treating "tube leak" as one category is that each points a maintenance team toward a different corrective action. Thermal fatigue cracking usually traces back to operating conditions — thermal cycling frequency, load-following demand — while oxygen pitting and caustic corrosion point toward feedwater chemistry control, and erosion damage points toward dust loading and flow velocity at specific tube sections. A single "tube health" score without this breakdown tells an operator that something is wrong without telling them where to look first, which is often the difference between a two-hour inspection and a multi-day search.
From Raw Sensor Data to a Work Order, in Three Steps
Continuous Sensor Ingestion
Existing temperature, pressure, vibration, and flow instrumentation already connected to the DCS or SCADA system streams data continuously instead of being reviewed on a periodic manual round.
Pattern Learning Against Baseline
AI models learn each asset's own normal operating pattern, so a deviation is judged against that asset's actual behavior rather than a generic industry threshold that may not fit its specific operating conditions.
Alert Routed to a Work Order
When a deviation matches a known degradation signature, the system generates an alert with enough lead time to schedule the repair into an upcoming planned stop instead of an emergency shutdown.
Turn Sensor Data Into a Planned Work Order, Not an Emergency Call
iFactory routes AI-detected degradation signatures directly into your maintenance workflow, weeks ahead of the failure the alarm would have caught.
Why Generic, Calendar-Based PM Schedules Fall Short on WHR Equipment
Fixed-interval maintenance replaces or inspects components based on calendar time or running hours, not actual condition. That works reasonably well for equipment that degrades at a predictable, uniform rate. It works poorly for WHR equipment, where load cycling, dust loading, and fuel or feed variability change the degradation rate constantly, meaning the same six-month inspection interval can be far too long for one asset and unnecessarily frequent for another.
The cost of this mismatch rarely shows up as a single dramatic failure. More often it shows up as a pattern: a plant that raises zero predictive or condition-based work orders across an entire WHR system, with every unexplained efficiency dip logged simply as "process variation" in the shift report because nobody has the data trail to argue otherwise. That pattern is invisible in any single week and expensive over a year, which is exactly the kind of drift a continuous condition model is built to surface.
Calendar-Based PM
- Every asset inspected on the same fixed schedule regardless of actual condition
- Deviations attributed to "process variation" in shift reports rather than tracked as a trend
- Failures discovered at the next scheduled inspection, often after damage has progressed
- No combined view linking vibration, temperature, and chemistry data for one asset
AI Condition-Based Monitoring
- Inspection and intervention timing driven by each asset's actual trending condition
- Deviations flagged and logged the moment they diverge from that asset's own baseline
- Degradation caught weeks ahead, while repair can still be scheduled into a planned stop
- Vibration, temperature, and chemistry data fused into one failure probability view per asset
What Plants Report After Deploying AI-Based WHR Monitoring
Questions Reliability Teams Ask About AI-Based WHR Monitoring
Stop Waiting for the Alarm — Start Reading the Pattern
iFactory's AI models turbine, boiler tube, and pump condition continuously so your WHR system stays ahead of the next forced outage.