Cement plants run on the assumption that someone always knows how much material is sitting in every silo, yet most facilities still confirm that number with a tape measure and a guess. Manual dip checks and visual estimates introduce ten to twenty-five percent inventory error into raw material, clinker, and finished cement planning — errors that turn into rush orders, blocked kiln feed, and trucks idling with nowhere to unload. Radar and ultrasonic sensors solve the physical measurement problem, but a reading on a screen still leaves someone doing the depletion math by hand. Pairing that sensor data with AI-powered inventory tracking across every silo in the plant is what turns a level reading into an actual production-planning tool.
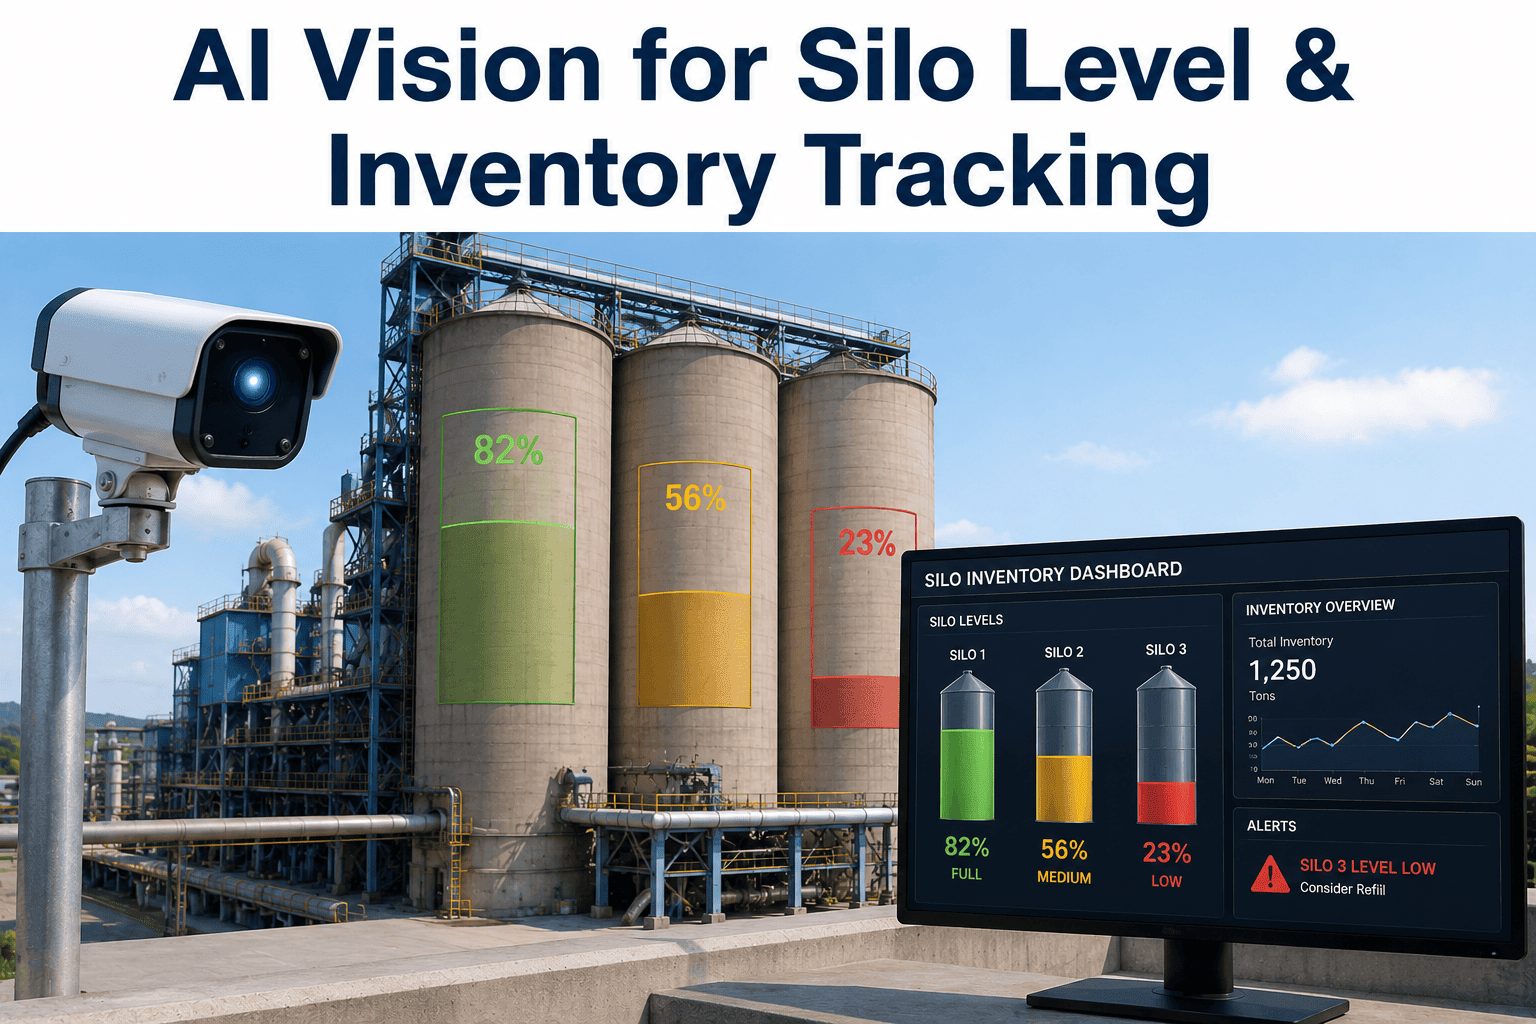
AI Vision for Silo Level & Inventory TrackingReal-time visibility across raw material, clinker, and cement storage
Replace manual dip measurements with continuous fill percentage, tonnage, and depletion forecasting across every silo, updated automatically and visible from the control room or a phone.
Fill percentage, tonnage, and draw rate refreshed every 30 seconds to 5 minutes per silo.
The Real Cost of Manual Level Checks
Climbing a silo or estimating by eye was never meant to carry the weight of production scheduling decisions, yet in most plants it still does.
Typical inventory error introduced by manual dip checks and visual estimates.
Measurement drift that radar and ultrasonic sensors develop over 3-5 years without recalibration.
Inventory error per silo per reading cycle that drift of this size translates into.
Time cement dust can take to settle after filling, long enough to confuse an unprotected sensor.
Choosing the Right Technology for Each Silo
Material type, temperature, and dust load all determine which level technology gives a reliable, inventory-grade reading rather than a false one.
| Technology | Best For | Limitation |
|---|---|---|
| FMCW Radar | Finished cement and raw meal silos, dusty and tall vessels | Higher upfront sensor cost than point-level switches |
| High-Temp Microwave Radar | Clinker domes and high-temperature storage | Requires temperature-rated housing and mounting |
| Ultrasonic | Lower-dust bins and shorter vessels | Signal loss during heavy dust generation at fill |
| Vibrating Fork / Point Switch | Additive silos, high and low level alarms | Point detection only, not continuous inventory |
| Load Cell | New-build silos where weight-based accuracy matters | Retrofitting existing silo legs is costly |
What AI Adds on Top of the Sensor
A sensor tells you the level right now. The analytics layer is what tells you what that level means for the next shift, the next delivery, and the next dispatch decision.
Continuous Level Monitoring
Fill percentage, estimated tonnage, and draw rate displayed for every silo simultaneously in one dashboard instead of one gauge at a time.
Hangup & Bridging Detection
Flags phantom inventory where the gauge shows material present but flow has stopped, before it turns into an unplanned stoppage.
Depletion Forecasting
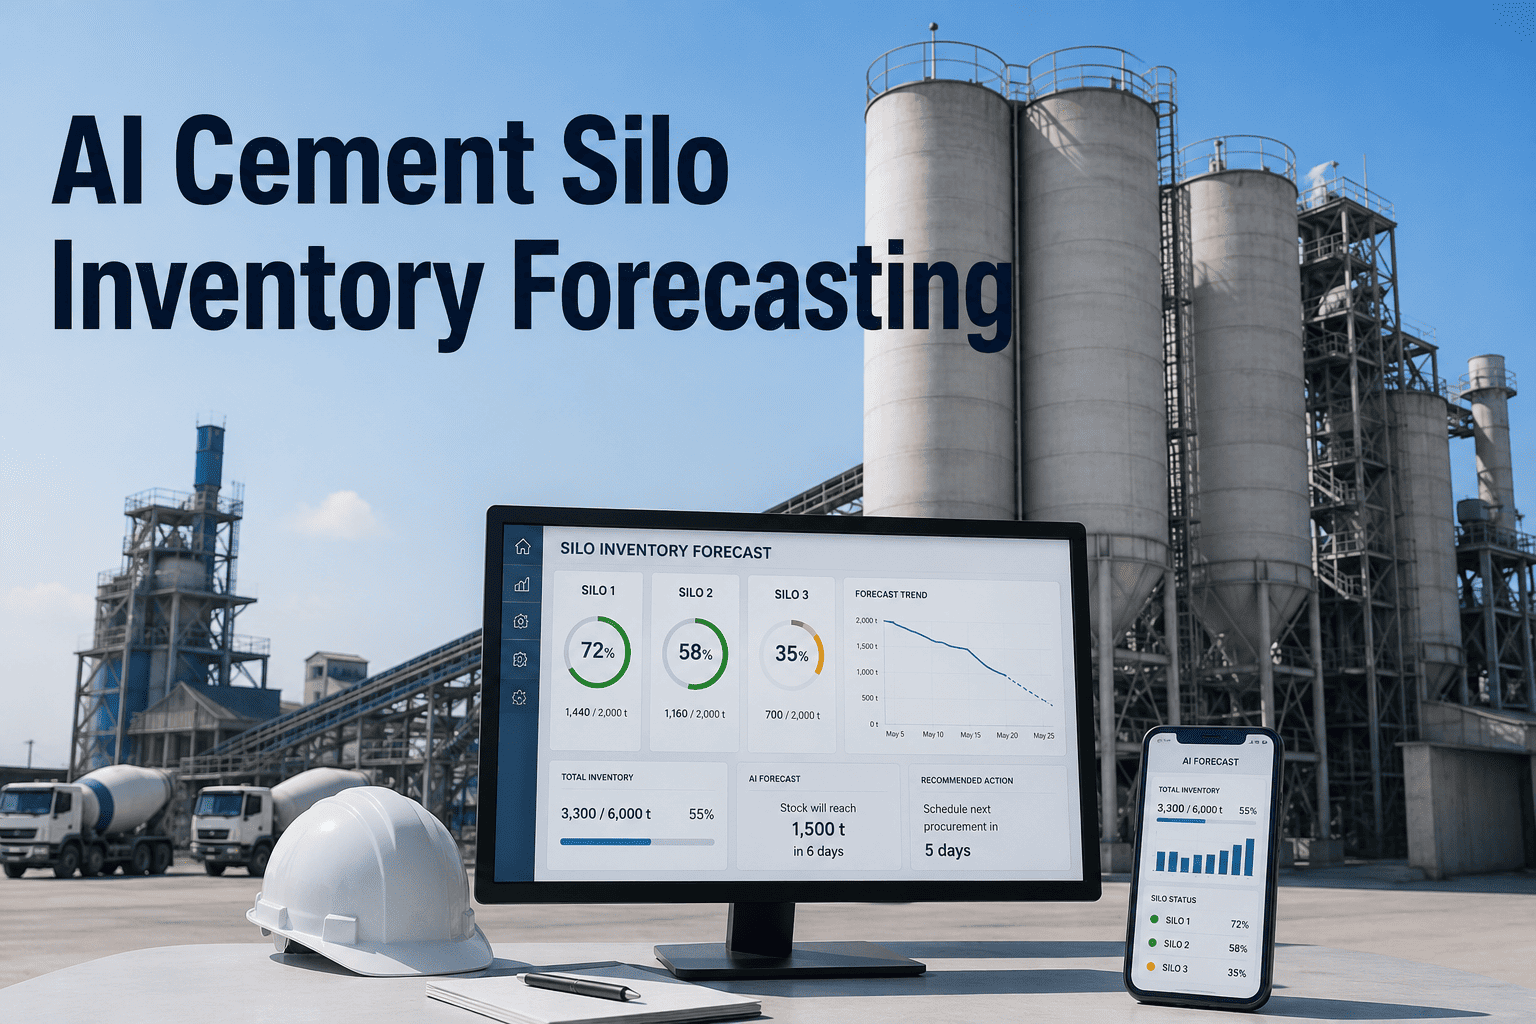
Projects when a silo will run empty based on current draw rate, giving twelve to thirty-six hours of advance warning for reorder decisions.
Structural Health Tracking
Watches for cyclic loading and eccentric discharge stress patterns that accumulate silently between annual inspection cycles.
Stop Discovering Shortages When the Silo Runs Empty
iFactory integrates with your existing radar, ultrasonic, or load cell sensors through standard 4-20mA, HART, Modbus, or OPC-UA protocols — no new instrumentation required — and turns raw level data into a dispatch-ready inventory picture.
Six Steps to Automated Silo Visibility
Most plants already own the sensors. The gap is turning that data into a single, trusted inventory picture everyone can act on.
Inventory Existing Sensors and Protocols
Confirm which silos already have radar, ultrasonic, or load cell instrumentation and what communication protocol each one uses.
Connect Every Silo to One Dashboard
Pull level data into a centralized view so raw material, clinker, and cement inventory are visible side by side, not silo by silo.
Set Alert Thresholds Per Silo
Configure high and low level alerts with routing to control room operators, plant managers, and dispatch coordinators individually.
Enable Depletion Forecasting
Turn current draw rate into a projected empty date so reorder decisions happen days ahead instead of the moment a silo runs dry.
Add Hangup and Structural Monitoring
Layer in bridging detection and structural stress tracking so silo-related stoppages are caught before they halt dispatch.
Retire the Manual Dip Check
Once dashboard readings are trusted against weighbridge or load-out data, manual measurement becomes an audit step, not the primary method.
What Plants See After Switching to Automated Tracking
Figures reported across cement and bulk materials storage facilities after replacing manual measurement with continuous silo analytics.
Reduction in silo-related downtime after continuous level and hangup monitoring replaced manual checks.
Improvement in inventory accuracy compared to manual dip measurement and visual estimation.
Advance warning window delivered by depletion forecasting for reorder and dispatch decisions.
Silo Level & Inventory Tracking — Questions Answered
What plant operations teams ask most often when evaluating automated silo monitoring for the first time.
Q: Do we need to replace our existing level sensors?
In most cases, no. The analytics platform integrates with existing radar, ultrasonic, guided wave, or load cell sensors through standard industrial protocols including 4-20mA, HART, Modbus, or OPC-UA. The value comes from connecting that existing sensor data into one dashboard with forecasting and alerting layered on top, rather than replacing instrumentation that is already functioning correctly. New sensors are only recommended where existing hardware is unsuitable for the material or environment. Book a demo to review your current sensor inventory.
Q: Why does radar work better than ultrasonic in a cement plant?
Cement dust generated during filling can take thirty minutes or more to settle, and ultrasonic sensors rely on sound waves that scatter badly in dense dust clouds, producing unreliable or false readings. Radar, particularly frequency-modulated continuous wave radar, uses microwave signals that penetrate dust largely unaffected, which is why it has become the standard technology for finished cement and raw meal silos across the industry. Clinker domes with extreme temperatures typically require a high-temperature rated microwave radar variant instead.
Q: What is silo hangup and why does the level reading not catch it?
Hangup, also called bridging or ratholing, occurs when compacted material forms a stable arch or channel inside the silo that blocks discharge even though material remains above it. A standard level sensor still reports material present because it is measuring the top surface, not whether that material is actually flowing, which is why hangup shows up as phantom inventory until dispatch or production discovers the blockage firsthand. Dedicated hangup detection compares level trend against expected draw rate to catch this discrepancy early.
Q: How much warning does depletion forecasting realistically provide?
Most implementations provide twelve to thirty-six hours of advance warning before a silo is projected to run empty, calculated from the current draw rate trend rather than a static average. That window is generally enough time to schedule a delivery, adjust a production run, or shift dispatch priorities before a stockout actually interrupts operations. The forecast becomes more accurate over time as the system learns each silo's typical fill and draw patterns.
Q: Can this system flag structural issues with the silo itself, not just inventory?
Yes, continuous structural health monitoring tracks the wall stress patterns that accumulate from cyclic loading and eccentric discharge over time, which is the mechanism behind most cracking and deformation issues that otherwise go unnoticed between scheduled annual inspections. Combining that structural signal with level and hangup data gives a more complete picture of silo condition than inventory tracking alone. Our support team can walk through structural monitoring setup for your silo fleet.
Know Exactly What Is In Every Silo, All the Time
Manual dip checks and phantom inventory cost real production time. Let iFactory connect your existing sensors into one live dashboard with hangup detection, depletion forecasting, and structural monitoring built in — so dispatch, production, and procurement all work from the same number.