The quality control manager at a 1.8-million-ton cement plant in the Midwest reviews the monthly production report and sees a number that demands action: a clinker factor of 82%, meaning the plant is using 820 kilograms of clinker to produce every ton of cement — 70 kilograms above the industry benchmark for integrated plants with access to fly ash and GGBS. At the plant's current production rate of 150,000 tons of cement per month, that excess clinker consumption represents 10,500 tons of unnecessary clinker production per month — 126,000 tons per year. At a clinker production cost of $52 per ton (raw materials, fuel, power, maintenance, and labor), the financial impact is $6.55 million per year in avoidable production cost. The plant's quality lab runs ASTM C618 and C989 testing on fly ash and GGBS samples from four suppliers, but the results sit in a binder on the lab manager's desk — never translated into an optimized blend design that would reduce the clinker factor while maintaining compliance with ASTM C150, C595, and C1157 cement specifications. iFactory's Quality Monitoring and Process Optimization modules give cement plant quality and production managers the digital infrastructure to characterize every SCM source by chemical composition and physical performance, model blend designs for minimum clinker factor at target strength and setting time, and track SCM feed rate consistency in real time — turning the binder of lab results into a continuously optimized clinker reduction strategy. Book a Demo to see iFactory's SCM optimization platform configured for your plant's raw material sources and cement types.
From 82% to 65% Clinker Factor — The SCM Optimization Roadmap for Cement Plants
Every percentage point of clinker factor reduction saves $500,000 to $900,000 per year in production cost and cuts CO2 emissions by 8 to 12 kilograms per ton of cement. iFactory's digital SCM platform characterizes every supplementary material, optimizes the blend design, and tracks feed rate consistency in real time.
Supplementary Cementitious Materials — Sources, Composition, and Performance Characteristics
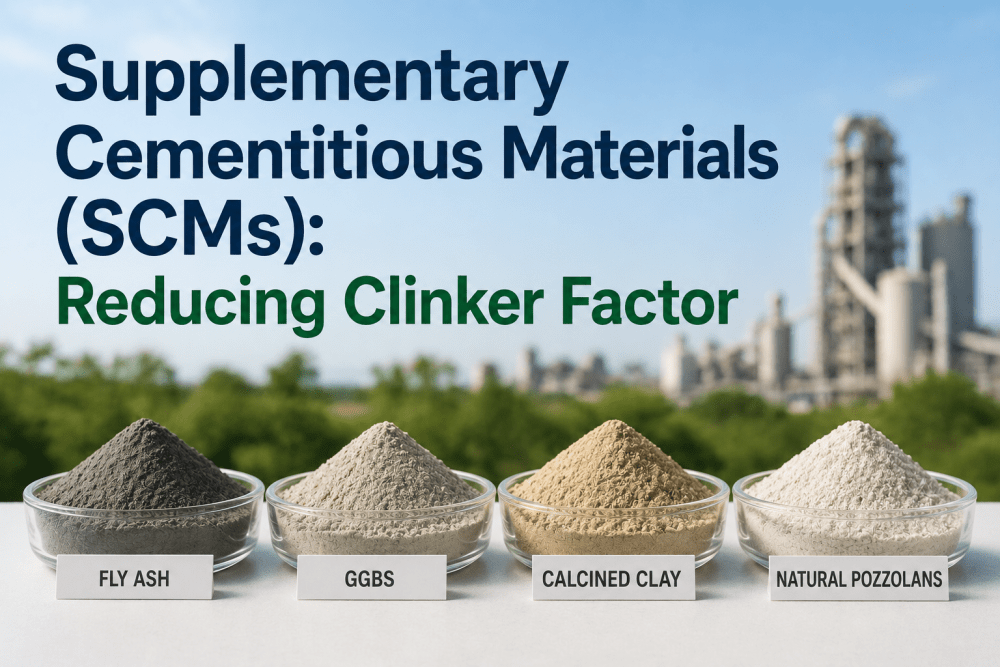
The five primary SCMs used in U.S. cement manufacturing — fly ash, ground granulated blast furnace slag, silica fume, calcined clay, and natural pozzolans — each bring a distinct chemical composition and physical performance profile to the cement blend. The table below presents the key characterization parameters for each SCM type, including typical replacement rate, impact on setting time and strength development, and the applicable ASTM standard governing its use in hydraulic cement.
| SCM Type | Source Industry | Primary Composition | Typical Replacement Rate | Strength Impact | Setting Time | ASTM Standard |
|---|---|---|---|---|---|---|
| Fly Ash — Class F | Coal-fired power plants | SiO₂+Al₂O₃+Fe₂O₃ ≥ 70%; CaO ≤ 10% | 15-35% | Slower early strength; equal or higher late strength (90d) | Moderate retardation (15-45 min delay) | ASTM C618 |
| Fly Ash — Class C | Coal-fired power plants (subbituminous/lignite) | SiO₂+Al₂O₃+Fe₂O₃ ≥ 50%; CaO 15-30% | 20-40% | Good early strength; excellent late strength | Minimal retardation (5-15 min delay) | ASTM C618 |
| GGBS — Slag Cement | Iron and steel mills | CaO 35-45%; SiO₂ 30-40%; Al₂O₃ 8-18% | 25-70% | Slower early strength; significantly higher late strength (28d+) | Moderate retardation (20-60 min delay) | ASTM C989 / C595 |
| Silica Fume | Ferrosilicon / silicon metal production | SiO₂ ≥ 85%; amorphous, ultra-fine particles | 5-12% | Very high early and late strength; reduces permeability | Acceleration possible (5-15 min reduction) | ASTM C1240 |
| Calcined Clay (LC³) | Clay mining and thermal activation | SiO₂ 50-65%; Al₂O₃ 25-40%; activated at 700-850°C | 15-30% (with limestone) | Comparable to OPC at up to 30% replacement with limestone synergy | Moderate retardation (15-30 min delay) | ASTM C618 / C595 (emerging) |
| Natural Pozzolan | Volcanic deposits / diatomaceous earth | SiO₂+Al₂O₃+Fe₂O₃ ≥ 70%; variable crystallinity | 15-30% | Slower early strength; good late strength; improved durability | Moderate retardation (20-40 min delay) | ASTM C618 |
Clinker Factor Reduction Potential by SCM Type — Cost and Emissions Impact per Percentage Point
The clinker factor — the mass of clinker required to produce one ton of cement — is the single most important metric for both production cost and carbon emissions in cement manufacturing. Each percentage point of clinker factor reduction delivers quantifiable savings in raw material cost, fuel consumption, power consumption, and CO2 emissions. The metrics below present the financial and environmental impact of reducing clinker factor by 10 percentage points (from 82% to 72%) and by 20 percentage points (from 82% to 62%) for a 1.8-million-ton-per-year cement plant, with SCM sourcing at current U.S. market pricing.
SCM Quality Monitoring and Blend Optimization — A Five-Step Process for Clinker Factor Reduction
Reducing clinker factor while maintaining cement performance requires a systematic approach to SCM characterization, blend design, production monitoring, and quality verification. The process outlined below represents the workflow that quality and production teams follow when deploying iFactory's SCM optimization platform — from initial SCM source qualification to ongoing blend performance tracking.
SCM Source Characterization
Every SCM source is characterized for chemical composition (XRF), fineness (Blaine or laser diffraction), loss on ignition, and pozzolanic reactivity (modified Chapelle or isothermal calorimetry). Results are stored in iFactory's material database with supplier, source plant, and date of sampling.
Blend Design Modeling
iFactory's optimization engine models cement blends at 2% SCM replacement increments from 0% to the maximum permitted by ASTM C595 or C1157 — calculating predicted strength at 1, 3, 7, 28, and 90 days, setting time, water demand, and sulfate resistance for each blend formulation.
Laboratory Verification
The top three blend designs from the model are batched in the plant quality lab and tested per ASTM C109 (mortar cubes), ASTM C191 (Vicat setting time), and ASTM C1038 (sulfate exposure) — confirming the model predictions before production-scale blending begins.
Production Feed Rate Control
iFactory monitors SCM feed rates from the weigh feeders in real time — comparing actual SCM percentage against the target blend design and alerting the control room operator when the feed rate deviates by more than the control limit (typically ±0.5% for fly ash, ±1.0% for slag).
Continuous Performance Tracking
Daily cement samples are tested for compressive strength, setting time, and air content. iFactory compares the test results against the expected performance curve for the active blend design — identifying any drift that requires blend adjustment or SCM source requalification.
Conventional Clinker Production vs SCM-Optimized Cement — Cost and Emissions Comparison
The financial and environmental case for clinker factor reduction becomes clear when the cost structure and emissions profile of conventional Portland cement production are compared side by side with an SCM-optimized blended cement operation. The comparison below presents the per-ton cost breakdown and emissions intensity for three scenarios: 100% OPC clinker factor, 72% clinker factor (18% fly ash + 10% slag), and 62% clinker factor (30% slag + 8% fly ash) — all at a 1.8-million-ton-per-year cement plant with raw material and energy costs at current U.S. industrial averages.
Conventional — 82% Clinker Factor
- Raw materials (limestone, clay, sand, iron): $12.40 per ton of cement
- Fuel (coal + petcoke at 825 kCal/kg clinker): $9.80 per ton of cement
- Power (110 kWh per ton cement, grinding + finishing): $8.25 per ton of cement
- SCM procurement: $2.10 per ton of cement (6% fly ash blend)
- Total cement production cost: $52.45 per ton
- CO₂ emissions: 765 kg per ton of cement (Scope 1 + Scope 2)
Optimized — 62% Clinker Factor
- Raw materials (clinker reduced by 20 points): $8.10 per ton of cement
- Fuel (clinker production reduced proportionally): $6.40 per ton of cement
- Power (higher SCM grinding but lower clinker grinding): $7.85 per ton of cement
- SCM procurement (30% slag + 8% fly ash): $11.20 per ton of cement
- Total cement production cost: $44.05 per ton
- CO₂ emissions: 495 kg per ton of cement (35% reduction vs conventional)
SCM Optimization Readiness — What Your Plant Needs for Successful Clinker Factor Reduction
Implementing a sustained clinker factor reduction program requires preparation across five areas — SCM supply chain, quality lab capability, production control systems, cement specification coverage, and team training. The checklist below covers the essential elements that iFactory's implementation team reviews during the SCM optimization deployment at each cement plant.
SCM supply agreements and quality specifications
Execute supply agreements with at least two qualified sources for each SCM type — including quality specifications (chemical composition ranges, fineness, LOI limits), delivery terms, and a quality dispute resolution process based on ASTM referee testing.
ASTM C150 / C595 / C1157 cement type coverage
Confirm that your target blend designs are covered by the plant's ASTM cement type approvals — including Type IL (limestone cement), Type IP (pozzolan cement), Type IS (slag cement), and Type IT (ternary blended cement) as applicable for your market.
Weigh feeder calibration and control loop tuning
Verify that all SCM weigh feeders are calibrated to ±0.25% accuracy and that the control loop response time is under 5 seconds for feed rate corrections — ensuring that the actual SCM percentage in the finished cement stays within ±0.5% of the target blend design.
Quality lab instrument readiness for SCM testing
Confirm that the plant quality lab has the instrumentation and certified reference materials required for ASTM C618 (fly ash/pozzolan), C989 (slag), C1240 (silica fume), and any additional SCM-specific testing — including XRF, Blaine fineness, and isothermal calorimetry or Chapelle reactivity.
Customer notification and specification change management
Develop a communication plan for customers whose cement specifications will change with the clinker factor reduction — including updated mill test reports, performance data packages, and specification sheets that document the new blend design and its verified performance characteristics.
Real-time SCM feed rate monitoring and alerting
Deploy iFactory's real-time SCM monitoring dashboard in the control room — displaying SCM feed rate, cumulative SCM percentage for the current shift, deviation from target, and automated alerts when feed rate or composition drifts outside the control limits established during the blend qualification.
What Cement Quality Managers Say About Digital SCM Optimization and Clinker Factor Reduction
I have managed quality control and cement formulation at three integrated cement plants over seventeen years — two in the Ohio River Valley and one in the Southeast — and the most persistent barrier I have seen to clinker factor reduction is not the availability of SCMs or the capability of the quality lab. It is the inability to translate lab data into production decisions in real time. At my second plant, we had an XRF analyzer in the quality lab that was running fly ash composition tests every four hours — and the results were being written on a whiteboard in the lab and then transferred to a spreadsheet at the end of the shift. The control room operator was setting the fly ash weigh feeder setpoint based on a target percentage that had been calculated on a calculator at the start of the week and never updated as the fly ash composition varied from delivery to delivery. The result was that our actual clinker factor was oscillating between 78% and 84% over the course of a month — sometimes within specification, sometimes not — and the average was 81.2%, not the 76% that the blend design was targeting. At the third plant, we deployed iFactory's quality monitoring module and configured the SCM characterization workflow so that every XRF result from the lab was automatically written to the blend model — and the control room operator's SCM feed rate target was updated every four hours based on the actual composition of the material in the silo. Our clinker factor stabilized at 73.4% within three weeks and stayed within a ±0.8% range for the following six months. The blend design had not changed. What changed was the feedback loop between the quality lab and the production floor. That loop — from measurement to model to setpoint to verification — is the difference between an aspirational clinker factor target and a sustained 10-point reduction that saves $3.7 million per year.
— Plant Quality Control Manager, U.S. Cement Manufacturing — 17 Years Quality Control and Cement Formulation — ACI Certified Concrete Field Testing Technician — ASTM Committee C01 MemberCommon Questions About Supplementary Cementitious Materials and Clinker Factor Reduction
Clinker Factor Reduction Is the Fastest Path to Lower Cost and Lower Carbon — If You Have the Data to Sustain It
Every cement plant in the United States has access to SCMs — fly ash from operating coal plants, GGBS from domestic steel mills, calcined clay from abundant clay deposits, and natural pozzolans from regional volcanic sources. The barrier to clinker factor reduction is not material availability. It is the gap between the lab data that characterizes the material and the production control system that sets the feed rate. The plant that closes that gap — with a digital platform that moves SCM composition data from the XRF analyzer to the blend model to the weigh feeder setpoint in hours instead of weeks — can sustain a clinker factor reduction of 10 to 20 percentage points and capture the $3.7 million to $7.4 million per year in cost savings and the 108,000 to 216,000 tons per year in CO2 emissions reduction that follow.
iFactory's Quality Monitoring and Process Optimization modules provide cement plant quality and production managers with the digital infrastructure to characterize every SCM source, model every blend design, control every feed rate, and track every performance metric — replacing the binder-and-whiteboard approach with a closed-loop optimization system that delivers sustained clinker factor reduction from day one. The 0.6-to-1.2 optimization ROI per dollar spent, the 4-to-6-month payback period, and the 15 to 25% clinker factor reduction at iFactory-managed plants are not the result of SCM theory. They are the result of having a system that moves SCM data from the lab to the control room in real time — every hour, every shift, every day. Book a Demo to see how iFactory's platform manages SCM characterization, blend optimization, feed rate control, and clinker factor tracking for your plant's material streams and cement types.
Every Percentage Point of Clinker Factor Reduction Is Real Money and Real Carbon Reduction
Your quality lab has the data. iFactory connects it to the control room — turning SCM characterization into sustained clinker factor reduction that saves $3M to $7M per year. Book a demo and see the system running on a cement plant network today.