In cement manufacturing, waste is not an occasional problem — it is a permanent operational condition. Whether it manifests as overgrinding that inflates electrical consumption, thermal losses from poorly controlled kiln transitions, off-spec product that must be reworked through the grinding circuit, or idle time caused by unplanned equipment stoppages, every cement plant bleeds production value every single day. Lean manufacturing — the discipline of systematically eliminating non-value-adding activities — is now being adopted by forward-looking cement producers not as a philosophy, but as a structured operational methodology backed by real-time data. For Plant Managers, Production Directors, and Process Engineers, the question is no longer whether lean applies to cement manufacturing. It is how rapidly you can build the measurement infrastructure to drive it at scale.
What Is Lean Manufacturing in the Context of Cement Production?
Lean manufacturing, rooted in the Toyota Production System, is the practice of identifying and eliminating waste — activities that consume resources without delivering customer value. In high-throughput, capital-intensive industries like cement, the principles apply with even greater financial force: every percentage point of OEE improvement, every kcal saved per kilogram of clinker, every hour of unplanned downtime eliminated represents hundreds of thousands of dollars in recovered margin annually.
For cement producers, lean is not about reducing headcount. It is about transforming production systems so that raw materials, energy, equipment, and people contribute maximally to every tonne of finished cement shipped. A typical integrated cement plant losing 8–14% of theoretical capacity to waste and inefficiency is not unusual — but it is fully remediable. Schedule a waste assessment with iFactory to understand where your plant is losing the most value, and which improvements will pay back fastest.
The 7 Forms of Waste in Cement Plants: A Lean Audit Framework
The original Toyota Production System framework identified seven forms of waste (Muda) that map directly onto cement manufacturing operations. Understanding each category — and quantifying it with production data — is the prerequisite for any serious waste reduction program. At iFactory, our production analytics platform tracks all seven waste dimensions in real time, giving your engineering team the evidence to prioritize interventions by financial impact rather than intuition.
Overproduction — Making More Than the Market Pulls
Producing cement grades ahead of confirmed demand forces extended silo storage, increases handling and contamination risk, and ties up silo capacity that limits scheduling flexibility. In grinding operations, overproduction of high-fineness cement when a coarser grade is needed wastes significant electrical energy. Lean cement plants match production schedules tightly to dispatch orders using real-time inventory and order book data rather than weekly batch planning assumptions that are often outdated on arrival.
Waiting — Downtime, Delays, and Idle Equipment
In cement manufacturing, waiting waste includes unplanned kiln stoppages, mill downtime awaiting maintenance parts, delayed quality lab results that hold production release decisions, and shift changeover gaps. Industry analysis consistently shows waiting waste accounts for 25–35% of total OEE loss in cement plants that lack structured maintenance programs. Real-time MTTR (mean time to repair) and MTBF (mean time between failures) tracking — available in iFactory — is the first step toward eliminating it systematically.
Overprocessing — Grinding Beyond Specification
One of the most prevalent and costly forms of waste in cement grinding. Running mills to achieve Blaine fineness values significantly above specification wastes electrical energy — every 100 cm²/g of excess fineness above target consumes approximately 1.5–2.0 additional kWh per tonne, reduces mill throughput, and increases grinding media wear. Tight, real-time fineness control anchored to actual specification limits is a direct and measurable lean objective with an immediate payback.
Defects — Off-Spec Cement and Rejected Batches
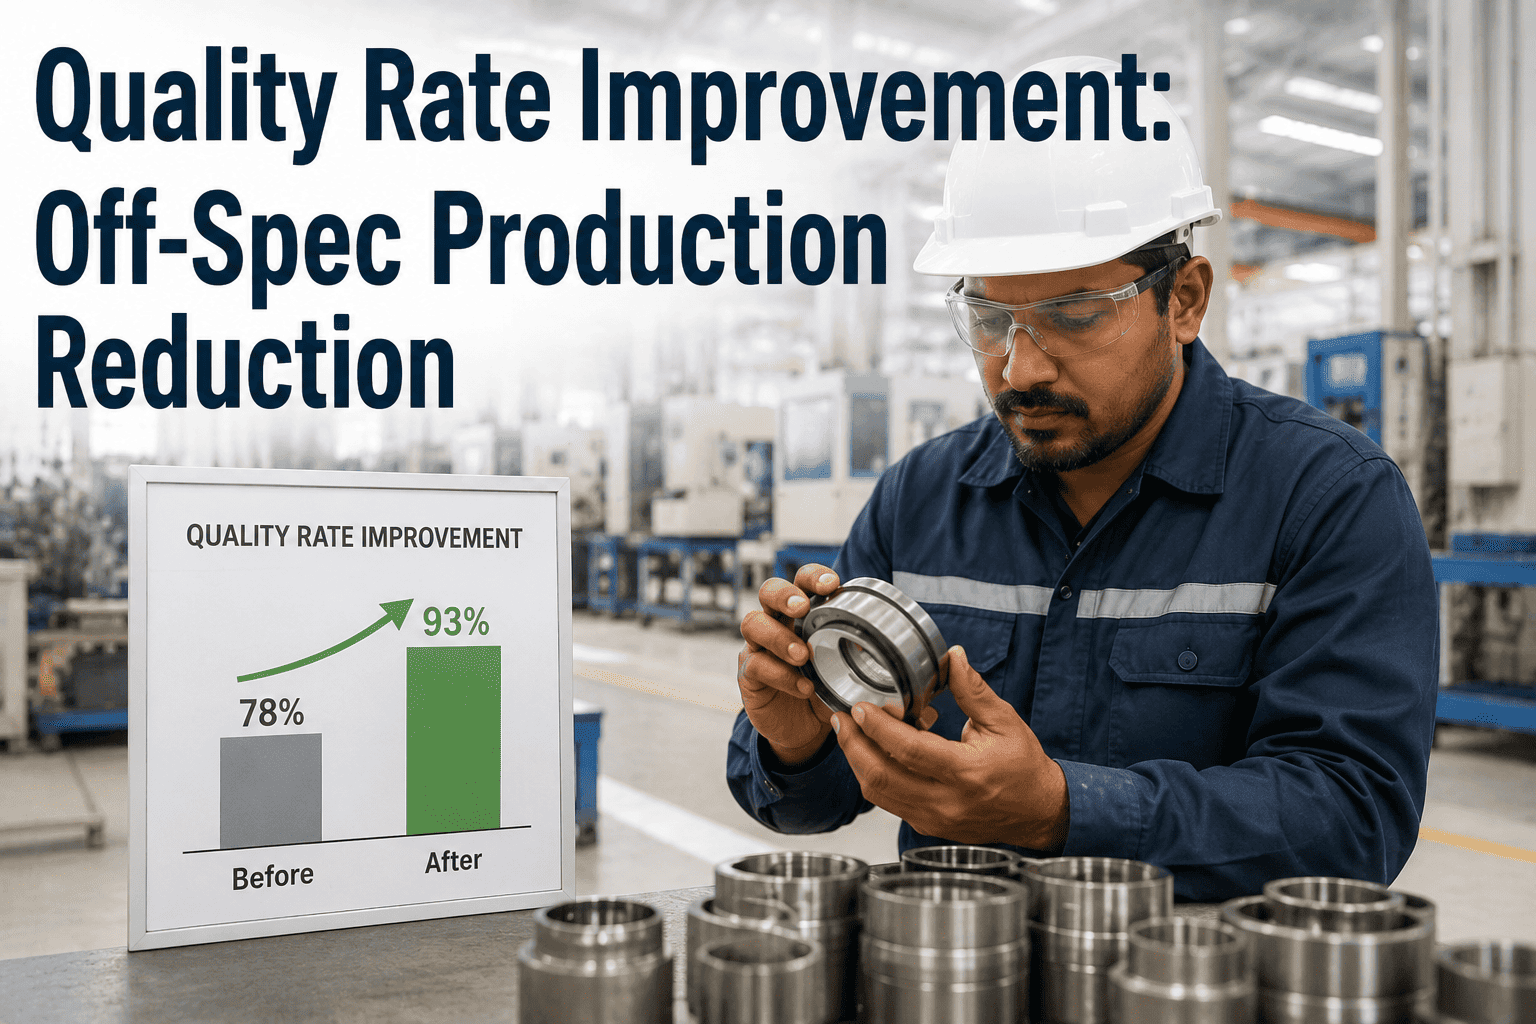
Off-specification cement — whether failing Blaine fineness, compressive strength, setting time, or chemical parameter requirements — must be either reworked through the grinding circuit (re-grinding, blending) or downgraded to a lower-value product. Both options carry direct cost. Quality defects in cement plants most commonly originate in inadequate raw mix control, poor kiln feed stability, and reactive rather than predictive quality monitoring — all areas where digital analytics delivers transformative improvement.
Transportation, Motion, and Inventory Waste
Unnecessary clinker transport between plants, poorly arranged raw material stockpiles requiring double-handling, and excess inventory of slow-moving specialty cement grades all represent quantifiable lean waste. Inventory waste is particularly significant in multi-product plants running 8–12 cement types simultaneously: SKU proliferation drives silo management complexity, product changeover losses, and contamination risk that further erodes yield and quality consistency.
Waste Distribution in a Typical Cement Plant: Where Are the Losses?
Based on production audits across integrated cement manufacturing facilities, preventable waste losses distribute across categories in ways that consistently surprise plant management teams. Energy waste dominates in absolute cost terms, but quality-related defect waste is often the most rapidly controllable category through targeted process improvement. The chart below shows typical waste distribution as a percentage of total preventable production loss — the starting point for any lean prioritization exercise and investment case.
Lean Tools and Techniques Proven in Cement Manufacturing
Lean principles translate into a specific toolkit of operational methods that have documented results in cement manufacturing environments. Each tool targets a different class of waste and requires a different data infrastructure to implement with precision. Book a product demo to see how iFactory supports each of these lean methods with real, continuous production data from your plant.
Value Stream Mapping (VSM)
VSM visualizes the complete flow of materials and information from quarry through dispatch, revealing every non-value-adding step along the way. For cement plants, VSM identifies waste such as intermediate clinker stockpiling, redundant quality sampling points, and manual data transfer delays between process areas. The output is a targeted improvement roadmap with waste quantified at each process step — a far more actionable starting point than generalized KPI reviews.
5S and Standardized Work
5S (Sort, Set in Order, Shine, Standardize, Sustain) applied to cement plants reduces motion waste and improves equipment reliability. In cement production specifically, 5S covers standardizing instrument calibration schedules, organizing shift handover documentation, and establishing standardized operating procedures for critical control points. Standardized work is the bedrock that prevents gains from regressing as personnel change shifts or roles.
Total Productive Maintenance (TPM)
TPM systematically attacks equipment downtime through autonomous maintenance, planned preventive maintenance, and focused improvement teams. In cement plants, TPM programs targeting kiln mechanical availability, mill liner change intervals, and separator bearing life have delivered OEE improvements of 5–8 percentage points within 18 months of program launch. iFactory's equipment performance tracking provides the downtime data that makes TPM target-setting evidence-based rather than anecdotal.
Kaizen Events and PDCA Cycles
Structured Kaizen events focused on specific waste problems — reducing heat consumption during kiln startup, eliminating grinding circuit upsets during product changeovers, or cutting delays in quality lab result reporting — deliver rapid, sustainable improvements. PDCA (Plan-Do-Check-Act) cycles are most effective when the Check phase is driven by real production data, not shift-end estimates. iFactory provides the measurement infrastructure that makes Kaizen Check phases definitive.
KPI Benchmarks: Measuring Lean Progress Across the Cement Value Chain
Lean programs without measurable KPIs are hypothesis exercises. Time-series KPIs — tracked against baseline and industry benchmarks — are the mechanism that converts lean philosophy into operational accountability and financial results. The comparison below shows typical performance ranges between plants operating without structured lean programs and lean-mature plants with digital process monitoring in place. Talk to our team about configuring these benchmarks in your iFactory dashboard from day one of implementation.
How iFactory's AI-Driven Platform Powers Lean Transformation in Cement Plants
The bottleneck in most cement lean programs is not the absence of improvement intent — it is the absence of reliable, timely production data. Process data trapped in PLC historians, quality data in disconnected LIMS spreadsheets, and maintenance data in paper logbooks cannot support the real-time feedback loops that lean manufacturing requires to sustain itself. iFactory's AI-driven manufacturing intelligence platform was built specifically to eliminate this data gap for cement producers.
By connecting directly to your process control systems, quality instruments, maintenance platforms, and production records, iFactory creates a unified operational data layer that surfaces waste in real time — enabling your process teams to act within the shift rather than after the weekly review. See iFactory in action across a live cement manufacturing scenario with your own production parameters.
Unlike generic manufacturing analytics tools, iFactory is purpose-built for process-intensive industries including cement. The platform understands cement-specific process hierarchies — from raw mill and kiln through cement grinding mills to dispatch — and is pre-configured with cement industry KPI templates covering specific heat consumption, grinding circuit efficiency, OEE by major equipment area, quality reject rate, and clinker-to-cement ratio. Your lean program has the right metrics from day one, without months of custom configuration work. No other general-purpose analytics tool delivers this out of the box for cement.
Lean Implementation Roadmap: 6 Phases for Cement Plants
Implementing a lean program in a cement plant requires a phased approach that builds data capability before it demands process change. Attempting lean transformation without measurement infrastructure in place is the most common reason lean programs in cement fail to sustain their initial gains. The roadmap below guides Production Directors from current-state assessment through self-sustaining continuous improvement — with iFactory accelerating every phase.
Waste Audit and Baseline Measurement
Conduct a structured waste audit across all production areas using the 7-waste framework. Establish quantitative baseline metrics for OEE, specific energy consumption, quality reject rates, and downtime categories with at least 3 months of historical production data. This phase requires 4–6 weeks of focused data collection and analysis. Output: a prioritized waste register with financial impact per category and a lean transformation business case for leadership endorsement.
Digital Data Infrastructure Deployment
Deploy iFactory's production monitoring platform to create continuous, real-time visibility into process parameters, quality results, and equipment performance. Integrate with existing PLCs, DCS, lab systems, and ERP to eliminate manual data entry and establish a single source of operational truth. Integration for most cement facilities completes in 4–8 weeks. Output: live production dashboards accessible to plant management, process engineers, and improvement teams — 24 hours per day, from any device.
Quick-Win Kaizen Projects
Use the waste audit findings and live production data to select 3–5 high-impact, fast-payback improvement projects. Typical targets in cement include: kiln startup curve optimization to reduce specific heat waste during unstable operation, grinding circuit fineness control tightening to eliminate overgrinding, and separator parameter standardization to reduce product variability. Each project runs a structured PDCA cycle with verified before-and-after measurement from iFactory's data platform.
TPM and Predictive Maintenance Program
Establish Total Productive Maintenance routines anchored to equipment performance data from iFactory's monitoring platform. Implement operator-driven autonomous maintenance checklists, configure predictive failure alerts for critical assets (kiln drives, mill bearings, separator motors, preheater fans), and track MTBF/MTTR trends monthly through iFactory's equipment performance dashboards. This phase consistently delivers the largest single OEE improvement of any lean initiative in cement.
Cross-Functional Improvement Teams and Governance
Establish a formal lean governance structure with cross-functional improvement teams — production, quality, maintenance, and dispatch — meeting weekly around iFactory's plant performance dashboards. Assign waste reduction ownership by production area, set 90-day improvement targets, and hold quarterly leadership reviews with progress measured against the original waste audit baseline. This governance layer is the structural foundation that prevents lean from becoming a one-time event that fades after the initial excitement.
Continuous Improvement Culture and Annual Maturity Review
Transition from project-driven improvement to a continuous improvement culture by embedding lean thinking into daily shift operations and management reviews. Conduct quarterly lean maturity assessments using iFactory's performance benchmarking reports, run annual VSM refresh exercises, and expand the analytical scope of the iFactory platform as new data opportunities emerge. Best-in-class cement plants at lean maturity stage are targeting 1–2% year-on-year improvements in specific energy consumption and OEE as a baseline operational expectation — not a stretch goal.
What Cement Producers Are Saying About iFactory
Before iFactory, our lean program was built on weekly reports that were always two days late and never explained why something had gone wrong — only that it had. With iFactory, our process engineers now intervene during the shift, not after it. In the first eight months, we reduced our specific heat consumption by 22 kcal per kilogram of clinker and brought our grinding electrical consumption down by nearly 3.2 kWh per tonne. That is not a marginal improvement — that is serious recoverable margin in a plant of our scale, and the data to prove it is right there in the dashboard every morning.
Frequently Asked Questions: Lean Manufacturing in Cement Plants
What does lean manufacturing mean specifically in cement production?
In cement production, lean manufacturing means systematically reducing the seven forms of waste — overproduction, waiting, overprocessing, defects, transportation, inventory, and motion — across the production chain from raw material handling through finished cement dispatch. It is a continuous, data-driven discipline requiring real-time production visibility, structured improvement methodology (5S, TPM, Kaizen, PDCA), and cross-functional team accountability. For cement plants, the highest-impact lean targets are typically energy waste in the kiln, overgrinding waste in the grinding circuit, and defect/rework waste from inadequate quality process control.
What is a realistic OEE target for a lean-mature cement plant?
Industry benchmarks place world-class cement plant OEE at 85% or above for continuous-running equipment like kilns and mills. Most cement plants without structured lean programs operate in the 62–75% OEE range, with much of the loss concentrated in unplanned downtime and speed losses from process instability. A well-executed lean program supported by real-time digital monitoring typically achieves OEE improvements of 8–12 percentage points within 18–24 months. The fastest gains almost always come from planned maintenance execution improvements (reducing unplanned downtime) and startup/shutdown waste reduction.
How does overgrinding waste manifest in cement grinding and how is it measured?
Overgrinding occurs when a cement mill runs to achieve Blaine fineness values consistently higher than the product specification requires. It is measured by comparing actual achieved Blaine fineness against the target specification for each cement grade, then correlating excess fineness with the additional electrical energy consumed per tonne. A common finding in cement plants is that average Blaine fineness runs 150–300 cm²/g above specification as a result of conservative grinding practices — representing 2–4 kWh/t of avoidable electrical waste per tonne of cement produced. iFactory's real-time fineness monitoring quantifies this waste at shift level.
How long does it take to implement a full lean program in a cement plant?
A full lean transformation — from waste audit through sustainable continuous improvement culture — typically takes 18–30 months for an integrated cement plant. However, measurable results from early Kaizen projects and digital monitoring deployment begin appearing within 3–6 months of program launch. The critical success factor is not timeline but data infrastructure: plants that deploy real-time production monitoring at the outset of their lean program consistently achieve faster and larger improvements than those attempting lean-style improvement without live process data as the foundation.
What production data does iFactory capture to support cement lean programs?
iFactory connects to your cement plant's process control systems (PLCs, DCS), quality instruments (online analyzers, LIMS), maintenance management platforms, and production scheduling systems to capture process parameters, quality results, equipment performance, energy consumption, and production throughput continuously in real time. All data flows into customizable cement-specific dashboards tracking OEE by equipment, specific heat and electrical consumption, quality reject rates, downtime categories, and lean improvement project progress — giving management the unified visibility that a structured lean program demands.
Can lean principles meaningfully reduce kiln energy waste in cement?
Yes — kiln thermal energy waste reduction is one of the highest-value lean targets in cement manufacturing. The primary drivers of excess heat consumption are uncontrolled air infiltration (false air), instability in kiln feed chemistry and raw mix burnability, poorly managed startup and shutdown transitions, and coating and ring formation that disrupts stable kiln operation. Lean programs targeting each of these factors, supported by real-time specific heat consumption monitoring through iFactory, have documented 5–8% reductions in specific thermal energy consumption. At scale, each 10 kcal/kg reduction in a 2 MTPA clinker plant represents substantial annual fuel cost savings.
Does iFactory integrate with our existing Siemens or ABB process control systems?
Yes. iFactory is designed to integrate with the major process control platforms used in cement manufacturing globally, including Siemens S7 / WinCC, ABB System 800xA, Rockwell FactoryTalk, and Honeywell Experion systems. Data integration is achieved through standard industrial communication protocols — OPC-UA, Modbus TCP, MQTT, and REST APIs — without requiring any modification to your existing control system architecture or logic. Integration timelines for most cement plant configurations are 4–8 weeks depending on the number of data sources and plant network topology.
What cement-specific KPIs does iFactory provide without custom development?
iFactory ships with pre-configured cement industry KPI templates covering OEE by major equipment (kiln, raw mill, cement mill, packing plant), specific heat consumption (kcal/kg clinker), specific electrical consumption (kWh/t cement and kWh/t clinker), Blaine fineness trend and deviation from grade specification, quality reject rate and rework percentage, clinker-to-cement ratio by grade, grinding media consumption tracking, and downtime categorized by root cause (planned, unplanned, process-caused, quality hold). Custom KPIs aligned to your specific cement grade portfolio and site configuration are added during the implementation onboarding process at no additional charge.