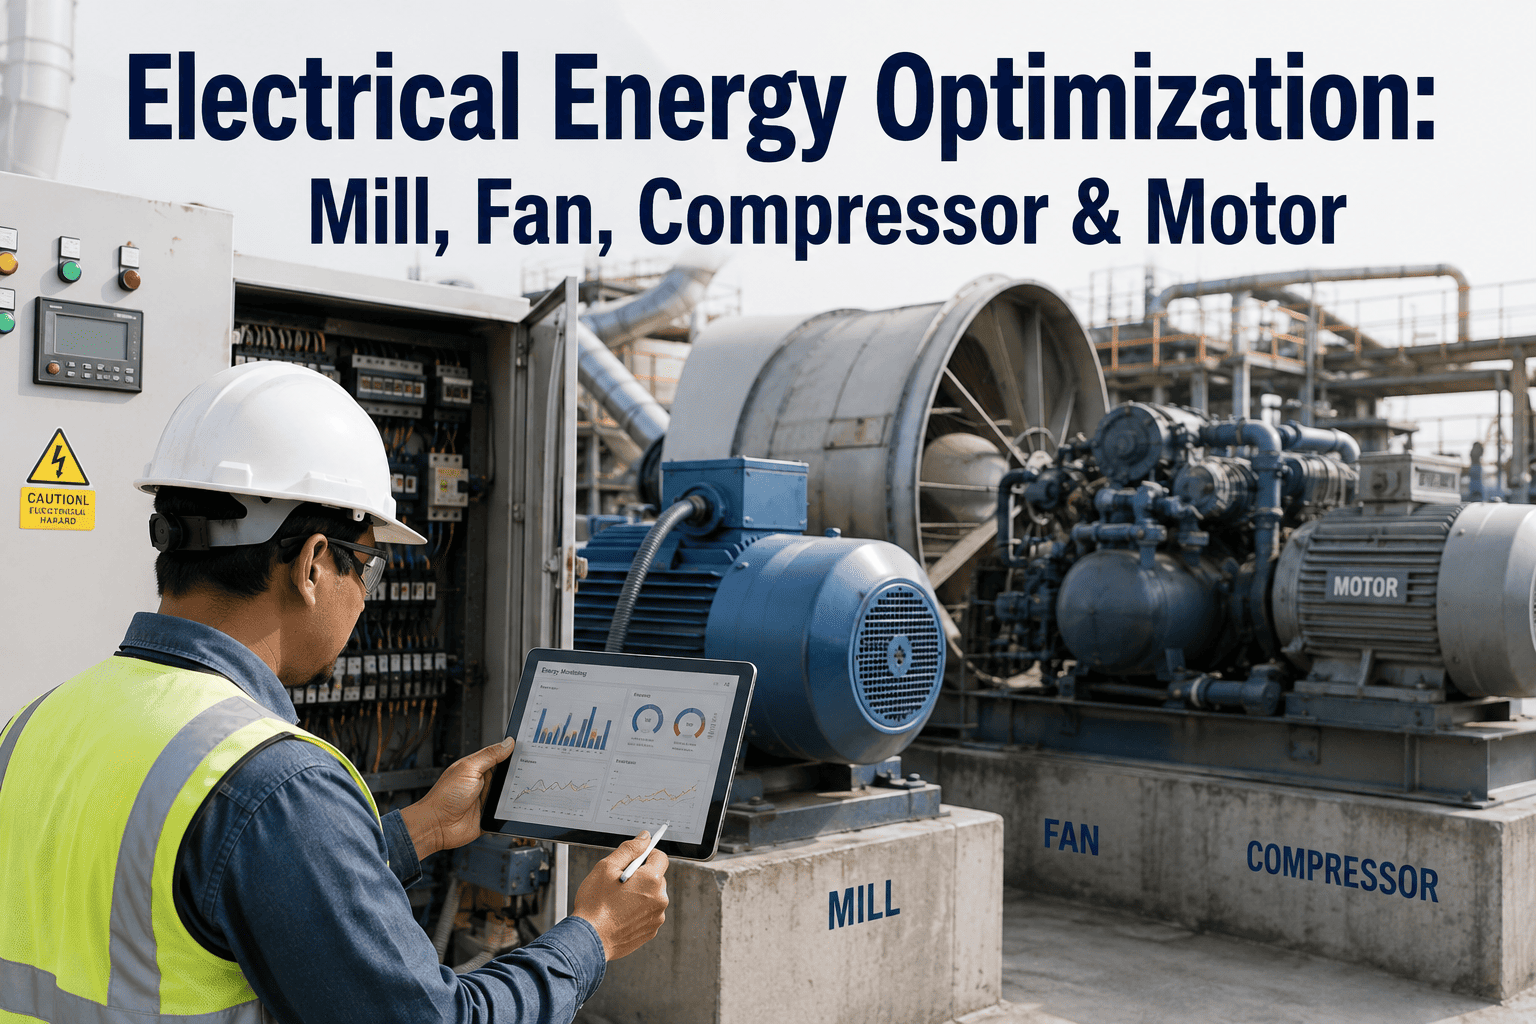
Electric motors are the largest single category of electrical energy consumption in a cement plant — accounting for 65 to 75% of total plant power draw across grinding mills, kiln drives, fan systems, conveyors, and compressors. A typical 2,000 TPD cement plant operates 300 to 500 motors ranging from 0.5 kW auxiliary drives to 5,000 kW main mill motors, and the combined inefficiency of that fleet — through degraded insulation, misalignment, rewinding losses, and operating point deviation — represents $400,000 to $900,000 in avoidable annual energy cost at U.S. industrial electricity rates. The challenge is not identifying that motors consume energy. Every plant knows that. The challenge is identifying which motors are consuming more energy than they should, why they are doing so, and what the intervention is that recovers the efficiency loss at a cost justified by the energy savings. Fixed-schedule motor maintenance — megger testing at annual outage, temperature checks on operator rounds, replacement on failure — does not answer any of these questions. It manages motors reactively and treats energy efficiency as a residual outcome of reliability maintenance, not as a primary optimization target. iFactory's motor efficiency analytics platform changes the maintenance model: connecting motor current, voltage, power factor, temperature, vibration, and shaft speed data to an AI analytics engine that continuously tracks each motor's operating efficiency against its design curve, identifies the degradation mechanism reducing efficiency, and generates the specific intervention — rewind, realignment, bearing replacement, VSD optimization, or motor upgrade — that recovers the most energy at the lowest intervention cost. Cement plants deploying iFactory's motor efficiency platform achieve an average 14% reduction in motor system energy consumption, $520,000 average annual energy cost reduction per plant, and 61% reduction in motor-related unplanned downtime.
Why Motor Efficiency Degrades — and Why Most Cement Plants Don't Know It's Happening
Motor efficiency loss in cement plants is cumulative, gradual, and largely invisible to conventional maintenance programs. A motor that ran at 94.5% efficiency when commissioned three years ago may be operating at 88% efficiency today — consuming 7% more power to deliver the same shaft output — and the difference will not appear on any alarm, any inspection report, or any operator's dashboard unless a real-time efficiency monitoring system is explicitly tracking it. The mechanisms of efficiency loss are well understood; what is missing in most plants is the monitoring infrastructure to detect them at the motor-by-motor level.
Motor Efficiency Analytics Across the Cement Plant Circuit
Each motor position in the cement process carries a distinct efficiency profile, failure mode vulnerability, and energy optimization opportunity. iFactory's monitoring configuration is tailored per motor position — applying the analytics parameters most relevant to the specific operating conditions, load cycle, and efficiency degradation mechanisms of each drive in the circuit. Book a Demo to review iFactory's monitoring scope against your plant's specific motor inventory.
Raw Mill and Cement Mill Drive Motors — Highest Energy Consumption, Highest Optimization Value
Main mill drive motors — typically 2,000 to 5,500 kW for vertical roller mills and ball mills — represent 35 to 45% of total cement plant electrical consumption. A 1% efficiency improvement on a 4,000 kW mill motor running 7,500 hours per year saves 300,000 kWh annually — approximately $24,000 at average U.S. industrial rates. iFactory monitors mill drive motors at the highest data density in the circuit: three-phase current and voltage at 1,000 Hz sampling for motor current signature analysis, continuous power factor and efficiency calculation against nameplate, bearing vibration at 5 kHz for both motor and gearbox bearings, and winding temperature at all three phases with 0.5°C resolution. The mill drive monitoring also integrates with production throughput data to express motor efficiency as kWh per ton of product — the metric that connects motor condition to production economics.
Kiln Drive Motor — Continuous Duty, High-Consequence Failure, Direct Production Impact
The kiln drive motor operates 24 hours per day at relatively constant load — making it one of the easiest motors to baseline and one of the highest-consequence motors to lose to an unplanned failure. Kiln drive motor failures that produce an unplanned kiln stop cost $180,000 to $300,000 in production loss per event at a 2,000 TPD kiln. iFactory monitors the kiln drive with continuous current signature analysis tuned for rotor eccentricity detection — the failure mode most commonly responsible for kiln drive motor failures — combined with real-time efficiency tracking that detects the efficiency loss that accompanies developing rotor problems 6 to 10 weeks before the failure produces a trip condition. The kiln drive monitoring also tracks power factor correction equipment performance, flagging capacitor bank degradation that reduces power factor and increases reactive power billing charges at the utility meter.
Fan Drive Motors — Variable Load, VSD Interaction, and Power Factor Complexity
Fan drive motors in cement plants — ID fan, raw mill fan, cooler fans, and finish grinding fans — operate under variable speed control via VSDs in most modern installations. The VSD creates a harmonic-rich power supply environment that introduces additional losses in the motor windings through high-frequency copper and iron losses not present at sinusoidal supply. Motors not rated for inverter duty (IEC 60034-25) in VSD service may lose 3 to 5% additional efficiency from harmonic losses alone. iFactory's fan motor analytics module includes a VSD harmonic loss calculation that quantifies the efficiency penalty from non-sinusoidal supply — identifying motors where inverter-duty rewinding or motor replacement would recover efficiency above the payback threshold. The module also tracks VSD switching frequency optimization for each fan motor, recommending the switching frequency setting that minimizes harmonic losses for that specific motor design.
Conveyor and Auxiliary Motors — Fleet-Scale Efficiency, Under-Loading, and Replacement Prioritization
Conveyor motors, bucket elevator drives, screw conveyor motors, and auxiliary equipment drives represent the largest number of motors in the cement plant — typically 150 to 300 units across the full plant circuit — but individually small power ratings (2 to 75 kW). The efficiency optimization opportunity in this motor category is not in preventing individual failures but in identifying fleet-wide patterns: motors consistently operating below 40% load that should be downsized, aged motors approaching the economic crossover point where IE4 replacement saves more in energy than the motor is worth to rewind, and motors with power factor below 0.75 that are contributing disproportionately to reactive power charges. iFactory's auxiliary motor analytics module processes the full conveyor and auxiliary fleet against a motor efficiency database — ranking motors by annual energy waste, replacement payback period, and power factor penalty contribution.
IE4 Motor Upgrade Economics: When Replacement Beats Every Rewind
The rewind-versus-replace decision is the most financially consequential motor management choice in a cement plant's energy program. The standard rule of thumb — replace if repair cost exceeds 65% of new motor cost — captures acquisition cost but ignores the energy cost of the efficiency gap between a rewound motor and a new IE4 premium efficiency motor. At U.S. industrial electricity rates, the energy cost calculation changes the decision for most motors above 15 kW with more than one previous rewind.
Example calculation: 75 kW motor, 6,000 operating hours per year, $0.08/kWh, full-load operation. iFactory's motor database generates this analysis for every motor in the plant fleet using actual operating hours and real-time load data.
Motor Efficiency Optimization Workflow: From Detection to Dollar Recovery
The financial value of motor efficiency analytics is realized through a structured workflow that connects anomaly detection to a specific intervention with a quantified energy savings outcome. iFactory's platform automates each step in this workflow — from continuous monitoring through intervention recommendation, work order generation, and post-intervention savings verification. Book a Demo to see the complete workflow configured for your plant's motor fleet.
Motor Efficiency Analytics Performance Benchmarks
The financial case for cement plant motor efficiency analytics is grounded in documented performance outcomes at comparable facilities — not projected benefits. The benchmark data below presents measured outcomes organized by motor category and intervention type at plants that have deployed iFactory's platform.
| Motor Category | Primary Efficiency Loss Detected | Avg. Annual Energy Saving | Intervention Type | Payback Period |
|---|---|---|---|---|
| Raw Mill Drive (3,500+ kW) | Operating point deviation — 28–35% average load on oversized motor | $38,000–$72,000 / year | VSD optimization or motor downsizing to correct rating | 8–14 months |
| Raw Mill Drive (3,500+ kW) | Insulation degradation — leakage current rise above 15% baseline | $18,000–$42,000 / year | Planned rewinding at next scheduled outage, IE4 spec | 4–9 months |
| Kiln Drive (500–1,500 kW) | Rotor eccentricity — 6–10 week advance detection via current signature | $180,000–$300,000 (trip avoidance) | Planned rotor replacement at scheduled kiln stop | <3 months |
| ID Fan Motor (200–800 kW) | VSD harmonic losses — non-inverter-duty winding in VSD service | $8,500–$19,000 / year | Inverter-duty rewind or IE4 replacement at next rewind event | 6–14 months |
| Conveyor Fleet (15–75 kW) | Under-loading — average 31% load on motors sized for peak conveyor demand | $1,200–$3,800 per motor / year | IE4 replacement at correct rating on next failure event | 10–18 months |
| Cement Mill Drive (2,000–5,500 kW) | Misalignment post-maintenance — 2× vibration + current phase deviation | $11,000–$28,000 / year | Precision laser realignment at next planned maintenance window | 1–3 months |
Comparison: iFactory Motor Analytics vs. Fixed-Schedule vs. Run-to-Failure
U.S. cement plants manage motor fleets on one of three maintenance philosophies. Each produces measurably different outcomes in energy cost, reliability, and capital spend. The comparison below maps what each approach delivers across the five outcomes that matter most to cement plant maintenance and energy managers.
Expert Review: What Cement Plant Energy Managers Say About Motor Efficiency Analytics
I have been responsible for energy management at U.S. cement plants for 18 years — two plants, combined capacity of approximately 4,800 TPD. Electric motors represent $3.2 million of our annual electricity bill at current rates, and for the first 12 years of my career, I had no visibility below the substation metering level. I knew the plant's total monthly kWh. I did not know which motors were consuming more than they should, or why, or by how much. Our motor maintenance program was calendar-based: annual megger testing, bearing replacement at 18,000 hours, rewind when failure occurred or when repair cost exceeded 65% of new motor price. We were running approximately $480,000 per year in avoidable motor energy waste — I only know that number now, in retrospect, because the iFactory platform quantified it after deployment. The single most surprising finding in the first year of operation was how many motors were under-loaded. We had 47 motors operating below 35% of rated load — most of them on conveyors that had been upsized during a plant expansion 8 years ago and never revisited. Those 47 motors alone represented $210,000 in annual energy waste that we had been paying every year without knowing it existed. The second finding that changed our maintenance economics was the rewind decision support. We had been rewinding every failed motor as a matter of policy. iFactory's analysis showed that 23 motors in our fleet had payback periods under 14 months for IE4 replacement — motors where the energy savings from the efficiency improvement paid for the new motor in less than a year and a half. We have now replaced 16 of those 23, and the energy savings are tracking within 4% of the projected values. What I tell other energy managers is: the investment in motor monitoring pays for itself in energy savings alone, before you count the reliability benefits. The reliability benefits are the bonus.
— Plant Energy Manager, U.S. Cement Manufacturing — 18 Years — Two Plant Operations — CEM (Certified Energy Manager, AEE)Conclusion
Motor efficiency is not a secondary energy category in a cement plant — it is the primary one. At 65 to 75% of total plant electrical consumption, the motor fleet determines the plant's energy cost position, and the efficiency of that fleet determines how much of the electricity bill is necessary and how much is avoidable waste from degraded insulation, misalignment, under-loading, and rewind losses that no fixed-schedule program can detect or quantify.
iFactory's motor efficiency analytics platform gives cement plant maintenance and energy managers the per-motor visibility they need to identify every efficiency loss event, classify its root cause, quantify its annual dollar impact, and execute the right intervention at the right time — before the efficiency loss becomes a failure event or a permanent energy cost increase. The $520,000 average annual cost reduction per plant is the aggregate of motor energy recovery, avoided failure costs, and capital optimization from IE4 replacement decisions made with actual operating data instead of rules of thumb. Book a Demo to see iFactory's motor efficiency analytics configured for your plant's specific motor inventory, operating hours, and energy cost profile.
Frequently Asked Questions
Yes. iFactory uses non-invasive current transformers on the MCC feeder conductors for current signature analysis — no motor-mounted sensors required for the majority of the fleet. Temperature and vibration sensors are added selectively at high-criticality motors where the additional data warrants the installation cost.
The analysis uses actual operating hours from monitoring data, your plant's current electricity rate, and the motor's measured efficiency from current signature data — not nameplate assumptions. Post-intervention tracking shows realized savings within 4 to 7% of projected values at plants where the full 12-month savings cycle has been completed.
Yes. iFactory exports motor efficiency KPIs — kWh per ton, fleet efficiency index, and energy savings achieved — via REST API to energy management platforms and generates ISO 50001-compatible energy performance indicator reports on a monthly or quarterly schedule as configured.
Intermittent motors are baselined on their run-cycle profile — efficiency comparisons are made only during active running periods at comparable load points. Start-up transients are automatically excluded from efficiency calculations to prevent false degradation alerts from normal starting current profiles.
Full deployment across 150 to 300 motors typically completes in 5 to 8 weeks. Against the $520,000 average annual improvement documented at comparable plants, payback occurs within 3 to 5 months. Book a Demo for a plant-specific deployment quote and payback model.