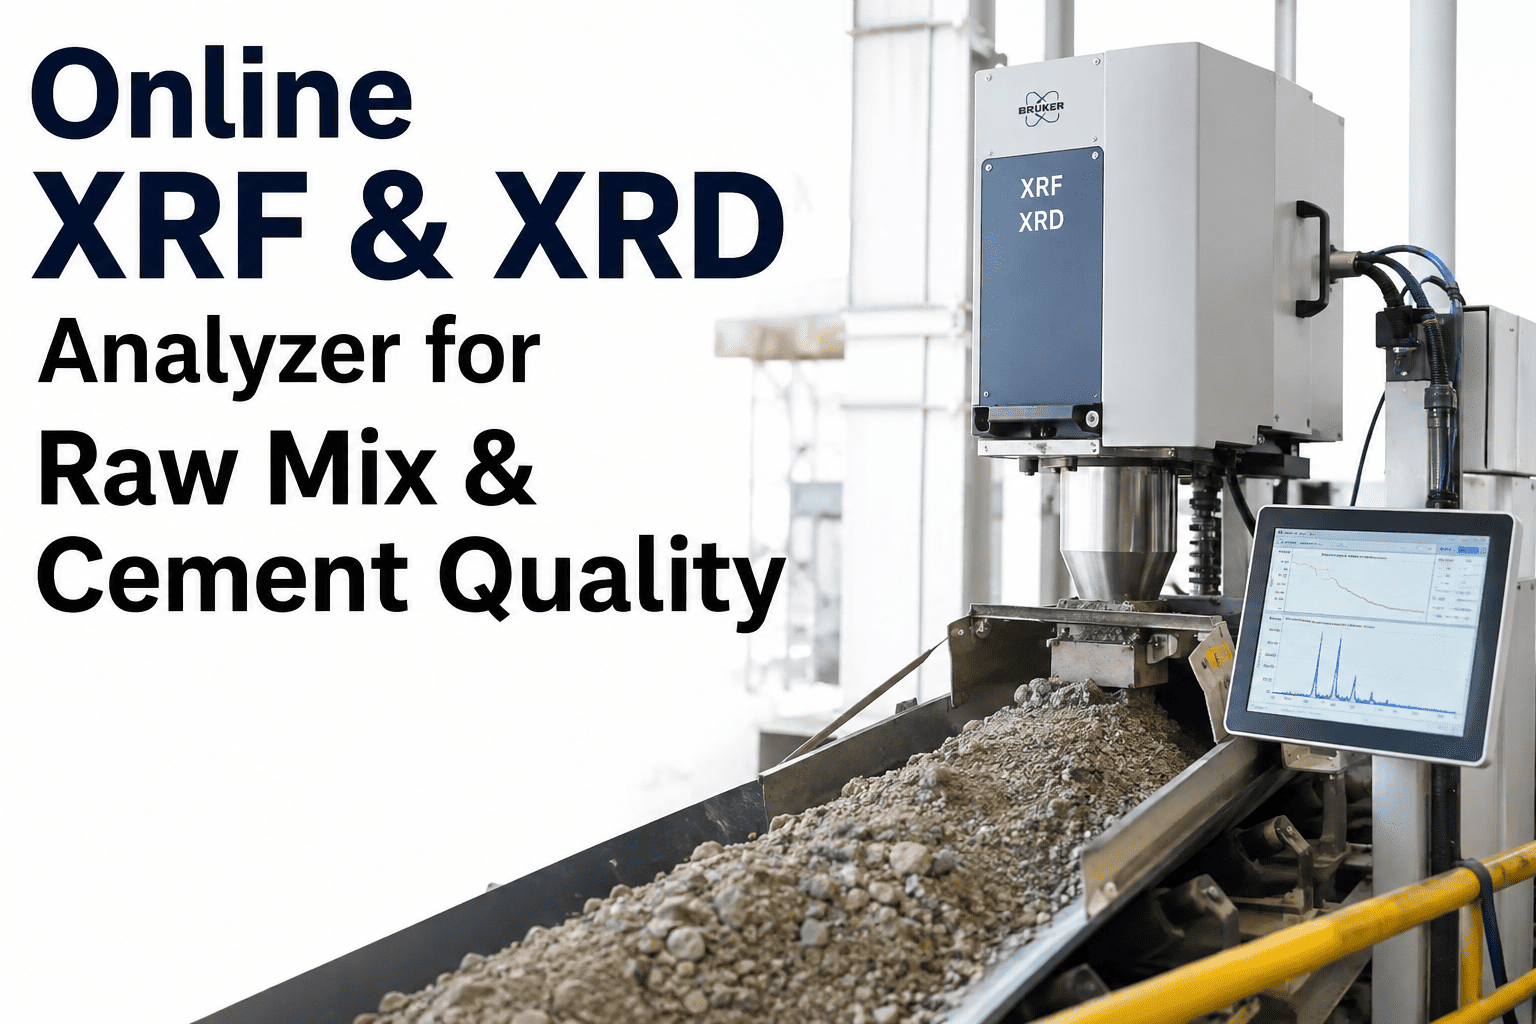
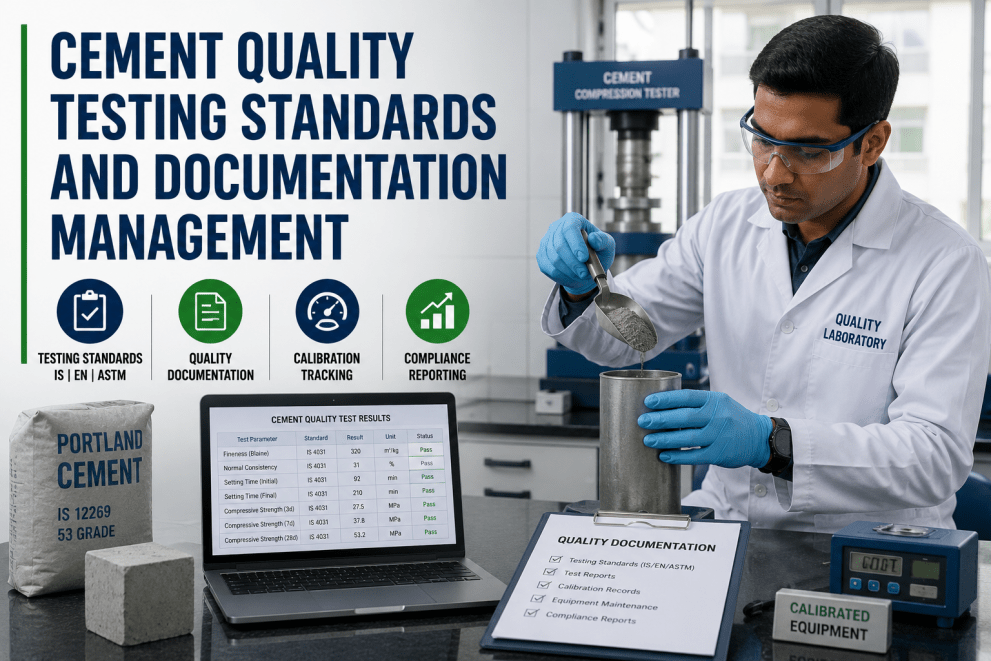
A cement plant can run its kiln at a perfectly stable set point, hold raw mix chemistry within spec on paper, and still ship a batch of clinker that fails strength testing three weeks later — because the lab that caught the deviation only pulled a sample once every few hours, and by the time the result came back, four more silos had already filled with the same off-spec material. This is the quiet, expensive reality of manual cement quality inspection: it tells you what happened, not what is happening, and the gap between those two things is where rejected loads, customer complaints, and rework costs quietly accumulate. Plants that have moved to automated sampling, online analysis, and AI-based quality prediction close that gap almost entirely, catching chemistry and strength deviations while there is still time to correct the process rather than just document the failure, and a growing number of quality teams are turning to that shift as the difference between reactive testing and genuine quality control.
CEMENT · QUALITY INSPECTION AUTOMATION
Catch Quality Deviations Before They Become Rejected Shipments
iFactory connects automated sampling, online analysis, and AI strength prediction into one quality view — so your team corrects the process instead of explaining the failure after the fact.
The Problem With Manual Testing
Why Periodic Lab Sampling Can't Keep Up With a Continuous Process
Cement manufacturing is a continuous process, but most quality inspection programs still operate on a batch mentality inherited from an era when labs had no other option. A technician pulls a grab sample every one, two, or four hours, walks it to the lab, runs a handful of tests, and reports results that describe a process condition that may have already shifted twice by the time anyone reads them. In between those samples, the plant is essentially flying blind on chemistry and quality, trusting that conditions haven't drifted.
The consequence isn't hypothetical. A raw mix chemistry excursion that lasts ninety minutes between two sampling intervals can produce clinker with free lime well outside target, and that clinker doesn't announce itself — it moves into storage, blends with surrounding material, and eventually surfaces as an inconsistent grinding behavior or a strength result that fails specification days after the fact. By then, the root cause is buried under everything produced since, and the quality team is left investigating a problem it can no longer isolate.
This isn't a staffing problem that more lab technicians solve. Human sampling frequency has a practical ceiling, and pushing past it runs into diminishing returns on cost and labor before it ever closes the visibility gap that continuous online monitoring closes by design.
There's also a traceability cost that rarely shows up in the immediate quality report but compounds over time. When a customer complaint or an internal quality flag surfaces weeks after production, the investigation depends entirely on whatever sampling record exists for that window. Sparse manual sampling means sparse traceability — the plant can often confirm that a problem existed somewhere in a multi-hour production window, but pinpointing the exact cause, whether it was a raw material shift, a kiln upset, or a grinding inconsistency, becomes far harder without a continuous data trail to narrow the search.
The Automation Stack
The Four Layers of a Modern Quality Inspection Program
Automated quality inspection isn't a single tool — it's a stack of capabilities that work together, each closing a different part of the visibility gap left by manual sampling. Book a demo to see how these layers connect to a single quality dashboard rather than four disconnected systems.
Layer 1
Automated Sampling
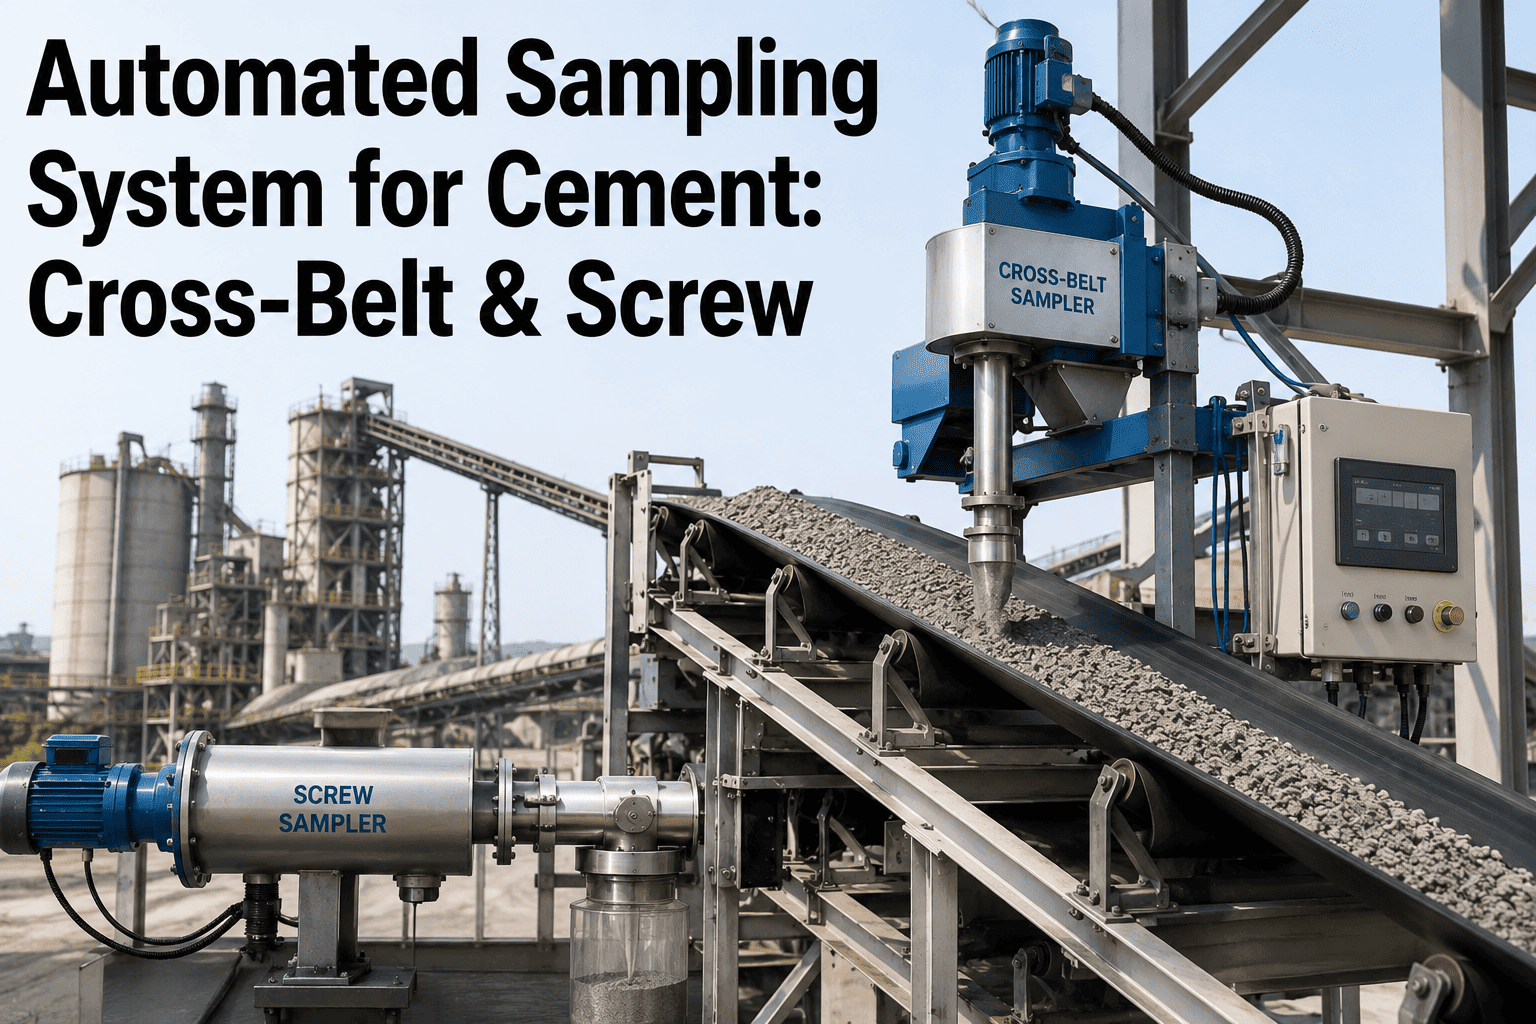
Cross-belt and cross-stream samplers pull representative material at fixed intervals without manual intervention, eliminating both sampling inconsistency between operators and the labor cost of round-the-clock manual collection.
Layer 2
Online Analysis
Continuous analyzers measure chemistry and physical properties in near real time, replacing a periodic snapshot with a running signal that shows drift as it develops rather than after it has already affected hours of production.
Layer 3
Statistical Process Monitoring
Control charts and trend limits applied to the continuous data stream flag deviations against historical process behavior, distinguishing normal variation from the kind of shift that warrants operator attention.
Layer 4
AI-Based Quality Prediction
Models trained on historical process and lab data predict downstream quality outcomes, including strength development, from upstream process signals — turning a result that used to take days to confirm into one available in near real time.
Process Checkpoints
Where Quality Actually Gets Determined, From Raw Mix to Finished Cement
Cement quality isn't decided at one single test point — it accumulates across a sequence of process stages, and automation adds the most value at the checkpoints where a deviation is cheapest to catch early and most expensive to catch late.
01
Raw Mix Proportioning
Online chemistry monitoring at the raw mill checks LSF, silica ratio, and alumina ratio continuously, catching quarry variability before it ever reaches the kiln feed.
02
Kiln Feed and Burning Zone
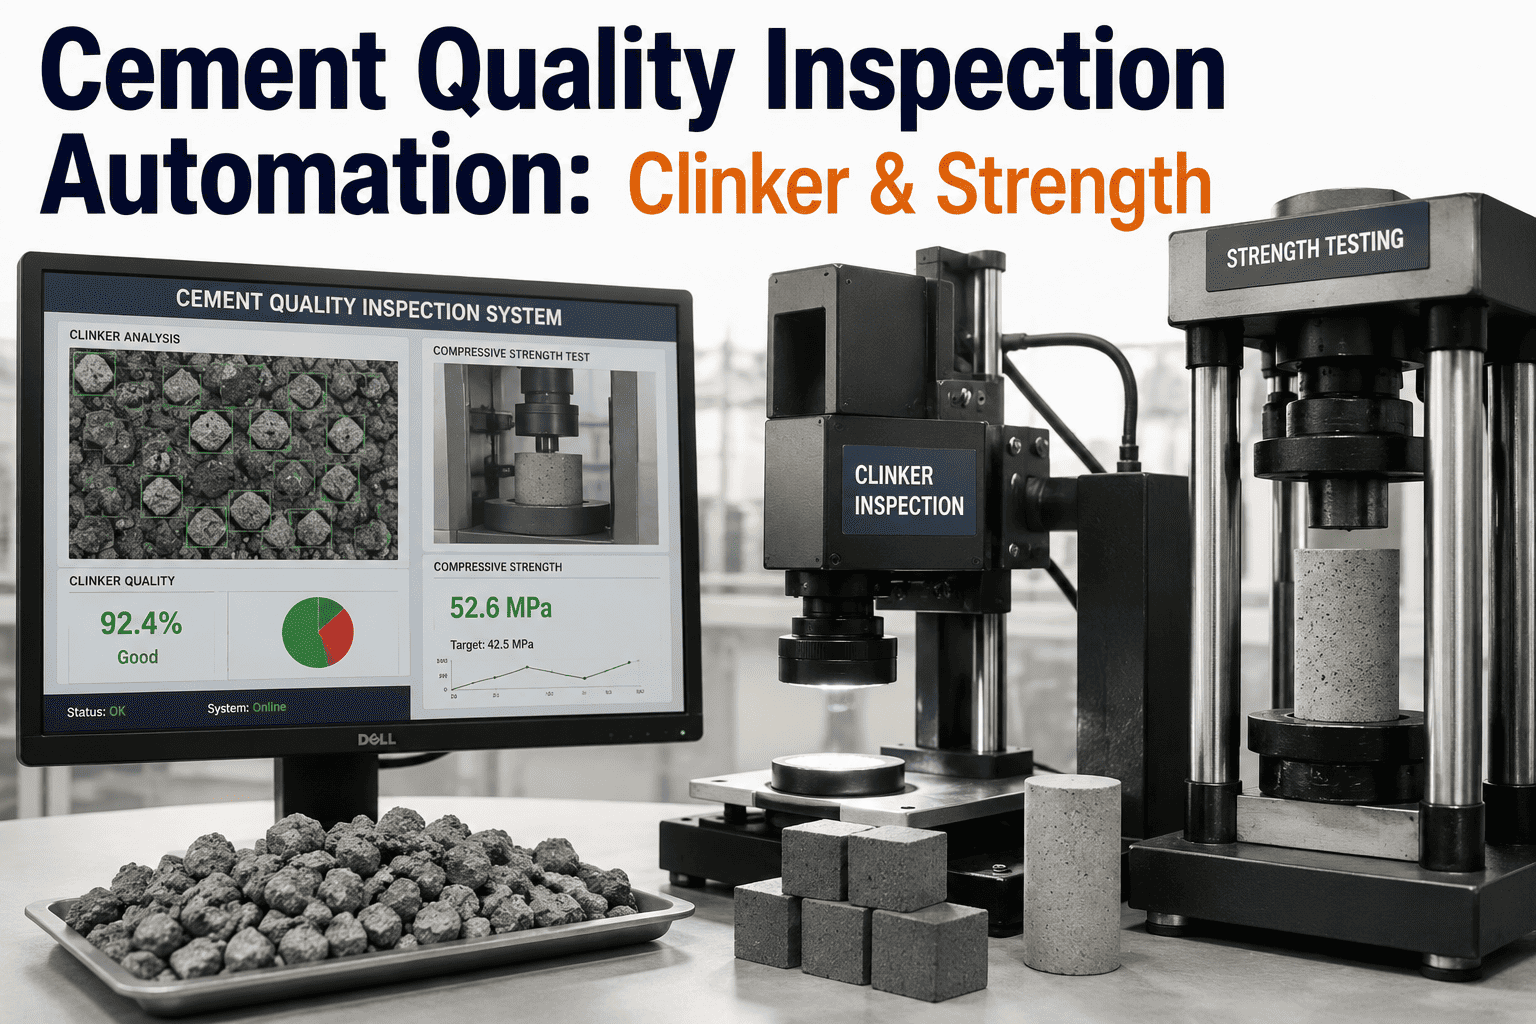
Automated clinker sampling paired with free lime analysis tracks burnability in near real time, giving kiln operators the feedback loop they need to correct burning zone temperature before a full batch is affected.
03
Clinker Storage and Grinding
Continuous monitoring at storage and grinding stages confirms that blending and homogenization are actually correcting for upstream variation rather than simply diluting it across a larger volume.
04
Finished Cement and Strength Prediction
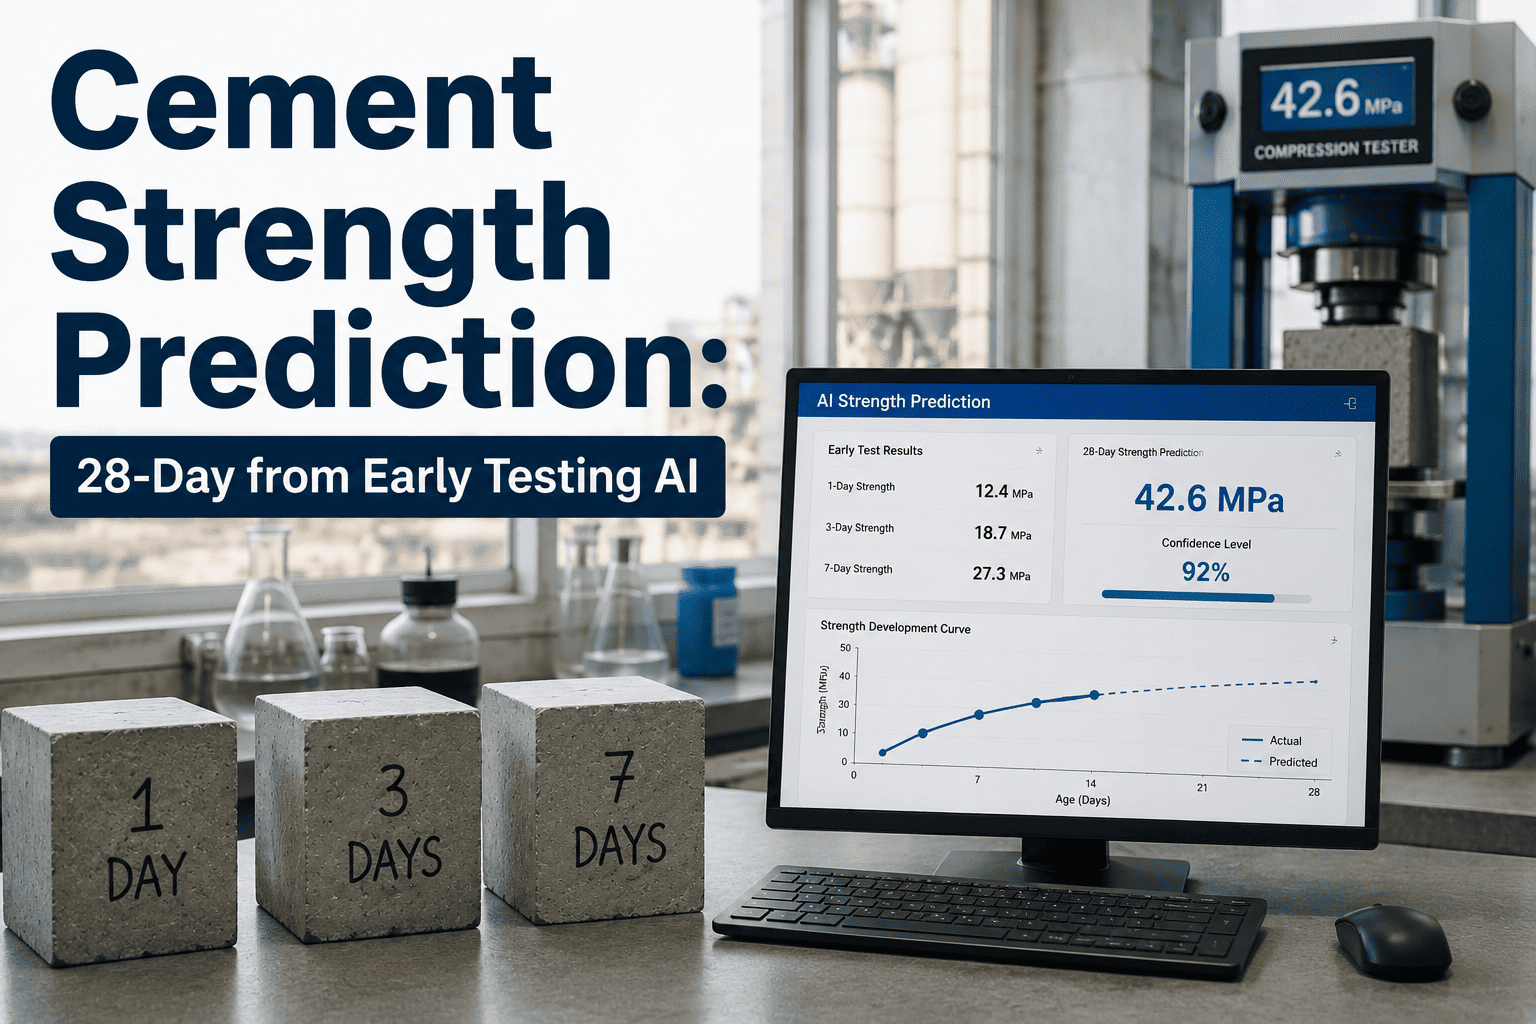
AI models correlate early-age strength indicators and process history with expected 28-day strength, giving quality teams an actionable read on final product performance long before the traditional test cycle completes.
Clinker Inspection Detail
What Automated Clinker Monitoring Actually Tracks
Clinker quality is the single biggest determinant of finished cement performance, which is why automated clinker inspection deserves more granular monitoring than any other stage in the process. A cement that meets every finished-product specification test can still trace an inconsistent strength history back to clinker variability that a coarser inspection schedule simply never picked up, which is why the following four properties tend to receive the most attention in a well-built automated program.
Free Lime
The most direct indicator of burning completeness — elevated free lime signals under-burning and predicts downstream strength and soundness problems before they show up in finished product testing.
C3S Content
The primary strength-contributing compound in clinker, continuously estimated from raw mix chemistry and burning conditions rather than waiting for periodic mineralogical testing.
Nodule Size and Structure
Physical clinker characteristics that correlate with burning zone conditions and grindability, tracked through automated visual and sampling systems rather than manual visual inspection alone.
Burnability Index
A composite measure derived from raw mix chemistry that predicts how readily a given feed will burn to target free lime, allowing proactive kiln adjustment rather than reactive correction.
SEE YOUR QUALITY DATA CONNECTED
Turn Lab Results Into a Continuous Quality Signal
Our team will walk through how automated sampling, online analysis, and AI strength prediction come together on a single quality dashboard for your plant.
The Business Case
Manual Inspection vs. Automated Inspection, Side by Side
The case for automation becomes clearest when the two approaches are compared directly across the factors that actually drive quality cost — detection speed, coverage, and the labor required to sustain the program.
It's worth noting that the value of automation isn't purely about catching more deviations — it's about catching them early enough that correction is still cheap. A chemistry excursion caught within minutes typically means a small operator adjustment. The same excursion caught days later, once it has already been baked into finished product across multiple silos, usually means blending, downgrading, or in worst cases, rejecting material outright. The cost difference between those two outcomes is what ultimately justifies the investment in continuous monitoring, far more than any single avoided incident on its own.
| Factor | Manual Sampling | Automated Inspection |
|---|
| Sampling frequency | Every 1-4 hours, operator dependent | Continuous, unattended |
| Deviation detection time | Hours to days | Near real time |
| Strength result lead time | Full 28-day cycle | Early prediction from process data |
| Sampling consistency | Varies by operator and shift | Fixed, repeatable protocol |
| Labor requirement | Dedicated technician coverage | Periodic calibration and verification only |
| Root cause traceability | Limited by sampling gaps | Continuous trend history |
Getting Started
A Practical Path to Automated Quality Inspection
Plants rarely automate their entire quality program in a single project, and they don't need to — a staged rollout that proves value at each step tends to succeed more reliably than a single large deployment.
Start With the Highest-Variability Checkpoint
Identify the single stage — often raw mix or clinker free lime — where variability currently causes the most downstream rework, and automate monitoring there first to build an early, visible win.
Connect Online Data to Existing Lab Records
Bring continuous analyzer output into the same system that already holds historical lab results, so trend analysis and AI prediction models have a complete, consistent dataset to learn from.
Layer in Predictive Strength Modeling
Once continuous chemistry and early-age strength data are flowing reliably, add predictive models that estimate 28-day strength outcomes, giving the quality team a genuine lead-time advantage.
Expand Coverage Across the Full Process
Extend the same automated sampling and analysis approach to remaining checkpoints, building toward a single, continuous quality view spanning raw mix through finished cement.
Throughout this rollout, the plants that see the strongest results tend to treat automation as a change to how quality decisions get made, not simply as new instrumentation bolted onto an existing workflow. That means giving operators and quality engineers direct access to the continuous data stream, not routing every deviation through a delayed reporting chain, and setting clear response protocols for what happens when a trend limit is crossed. Equipment alone doesn't close the visibility gap — the combination of continuous data and a team empowered to act on it does.
Frequently Asked Questions
Cement Quality Inspection Automation — FAQs
Does automated inspection replace the lab entirely, or work alongside it?
Automated inspection doesn't eliminate the lab — it changes what the lab is used for. Online analyzers and automated sampling handle the continuous, high-frequency monitoring that catches deviations early, while the lab continues to run reference tests, calibration checks, and the specific standardized tests that regulatory and customer specifications require. The two work together, with automation providing the early warning and the lab providing the certified confirmation.
How accurate is AI-based strength prediction compared to actual 28-day testing?
Prediction accuracy depends heavily on how much historical process and lab data the model has been trained on, and how consistent the plant's raw materials and process conditions are over time. Well-trained models on stable operations can track actual 28-day results closely enough to support real production decisions, though most quality teams continue running standard tests as ongoing calibration and confirmation rather than replacing them outright.
What's the biggest source of quality inconsistency that automation typically catches first?
Raw mix chemistry variability tends to be the earliest and most impactful issue automated monitoring surfaces, since quarry material naturally varies more than most plants assume between manual sampling intervals. Continuous online analysis at the raw mill frequently reveals excursions that manual sampling schedules were simply too infrequent to catch, making it a common and effective starting point.
Book a demo to see this against your own process history.
Can automated sampling systems handle the abrasive, high-temperature conditions around a kiln?
Modern automated sampling and analysis equipment for cement applications is specifically engineered for the abrasive, high-temperature, and dust-heavy conditions found around kilns and clinker coolers, using materials and enclosures rated for that environment. Proper installation location and a regular maintenance schedule remain important, but the equipment itself is designed for exactly this operating context rather than being adapted from a gentler industrial setting.
How long does it typically take to see a measurable quality improvement after automating inspection?
Many plants see the first measurable benefit — usually a reduction in the time it takes to detect and correct a process deviation — within the first few weeks of continuous monitoring going live, since that benefit doesn't depend on historical data accumulation. Benefits that depend on trend history and predictive modeling, such as accurate strength prediction, typically take longer to mature as the system builds a sufficient historical dataset to train against.
CEMENT · QUALITY INSPECTION AUTOMATION
Stop Discovering Quality Problems After the Batch Has Shipped
iFactory brings automated sampling, online analysis, and AI-based quality prediction together into one continuous view, built specifically for cement plants moving from periodic testing to real-time quality control.