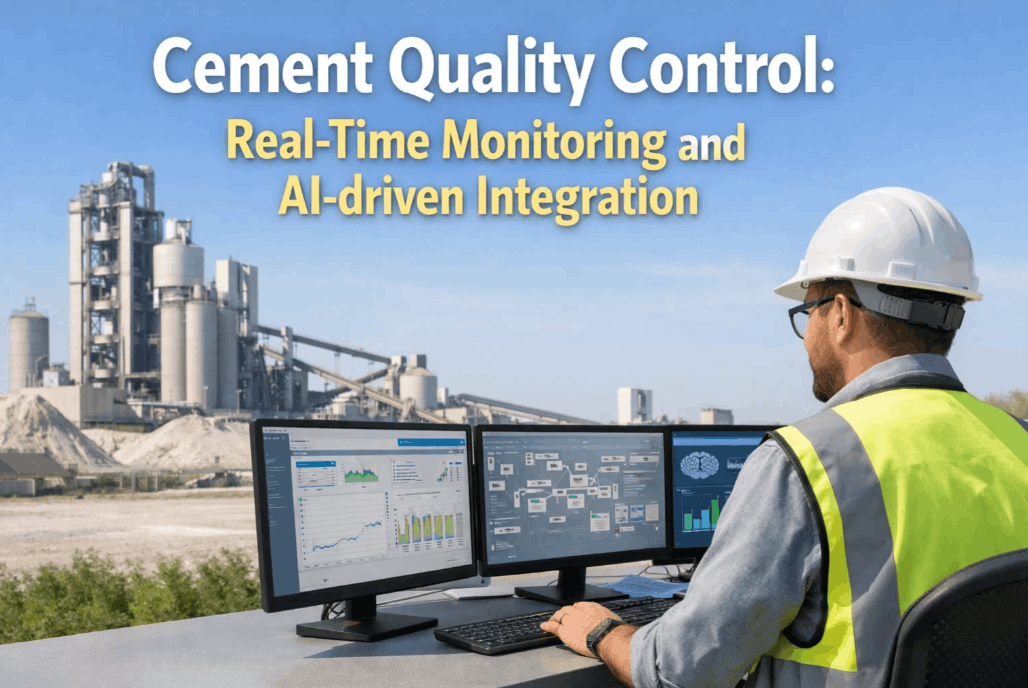
A cement kiln can run at perfect temperature and stable feed rate and still ship clinker that fails a customer's 28-day strength test, because the chemistry that determines strength is decided in the burning zone hours before any lab result comes back. Free lime, C3S content, and liter weight are the three signals that tell you whether that clinker will meet specification, but most plants only see them after the batch has already left the cooler. Reliability and quality teams who book a demo with iFactory get a live view of these parameters as they form, not two hours after the fact.
Stop Waiting for the Lab to Tell You the Clinker Failed
iFactory correlates kiln process data with free lime, C3S content, and liter weight trends so quality teams catch under-burning and over-burning before it becomes a customer claim.
Why Clinker Quality Slips Past Traditional Testing
Free lime is usually lab-tested once or twice a shift from a cooler discharge sample, which means the result reflects clinker that was burned thirty to forty five minutes earlier and has already been bagged, stored, or blended by the time the number reaches the control room. Liter weight testing follows a similar cadence, and full XRF-based mineralogy runs even less frequently because it requires a prepared, fused sample and a calibrated analyzer. Between those checkpoints, a kiln can drift out of its target burning zone temperature, change fuel blend, or lose stable feed rate without anyone knowing the clinker chemistry has moved until the next sample comes back.
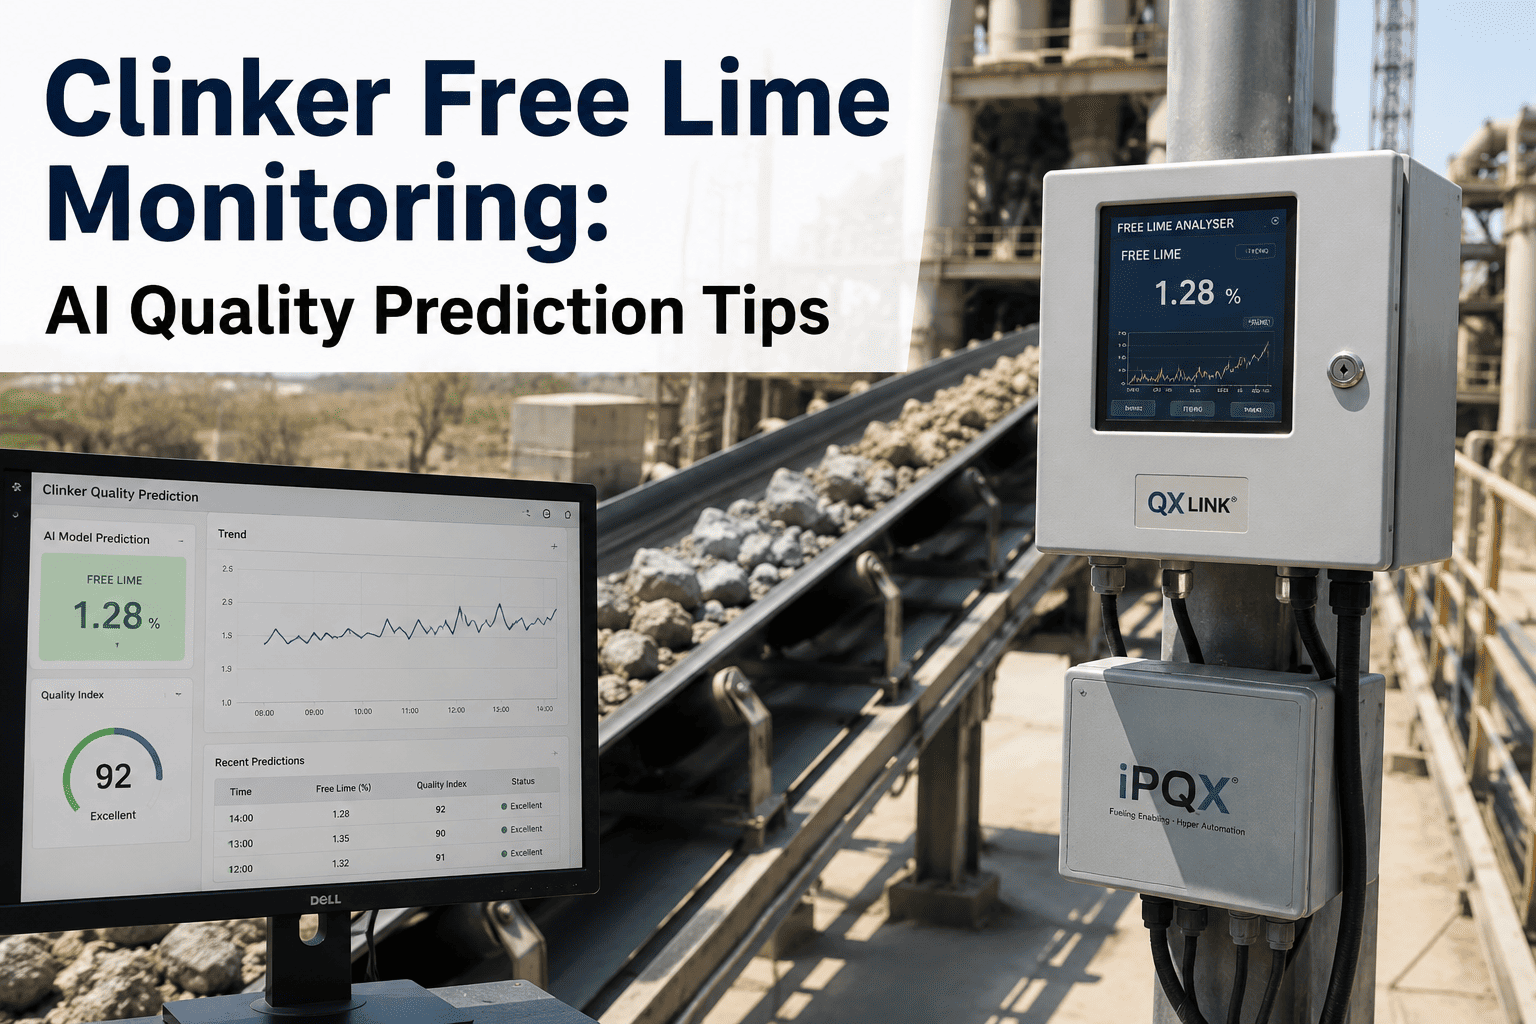
This lag is the core problem AI-driven quality monitoring addresses. By correlating burning zone temperature, kiln speed, feed rate, and secondary air conditions against historical lab results, a predictive model can estimate free lime and C3S trends between physical samples, giving operators an early warning fifteen to thirty minutes before the next test confirms a deviation. That window is often the difference between adjusting fuel rate mid-shift and rejecting an entire silo of clinker.
The same lag affects raw mix control upstream of the kiln. Lime saturation factor, silica modulus, and alumina modulus are all calculated from raw meal composition, and any inconsistency in limestone grade or corrective material dosing shows up as a burnability shift long before it reaches the burning zone. Plants that only check raw meal chemistry once or twice a shift are effectively flying blind on burnability for hours at a time, which is why continuous correlation between raw mix trends and clinker lab results closes a second, earlier gap in the same quality chain.
The Four Numbers That Define Clinker Quality
Quality control chemists track dozens of ratios, but four measurements carry most of the practical weight when deciding whether a batch of clinker will grind well and meet strength specification. Each one tells a different part of the burning story, and reading them together gives a far more reliable picture than any single number in isolation. None of these numbers should be evaluated on its own: a plant chasing a single target, like driving free lime as close to zero as possible, often ends up with dense, hard-to-grind clinker that raises mill power costs even though the free lime chart looks perfect. The goal is a stable band across all four parameters together, not a minimum or maximum on any one of them.
| Parameter | Target Range | What It Signals | Risk If Out of Range |
|---|---|---|---|
| Free Lime (f-CaO) | 0.5% – 1.5% | Degree of clinkerisation completion in the burning zone | Above 2%: under-burnt, low strength. Below 0.5%: over-burnt, hard to grind |
| Liter Weight | 1,100 – 1,300 g/L | Bulk density and porosity as a rapid proxy for free lime | Low reading: dusty, porous clinker. High reading: dense, energy-intensive to grind |
| C3S (Alite) Content | 50% – 65% by mass | Primary strength-contributing mineral phase from Bogue or XRD analysis | Low C3S with high C2S delays early and 28-day strength development |
| Lime Saturation Factor | 92 – 98 | Ratio of available lime to silica, alumina and iron oxide in the mix | Above 98: high free lime risk. Below 92: alite formation is limited |
How Free Lime and C3S Actually Connect to 28-Day Strength
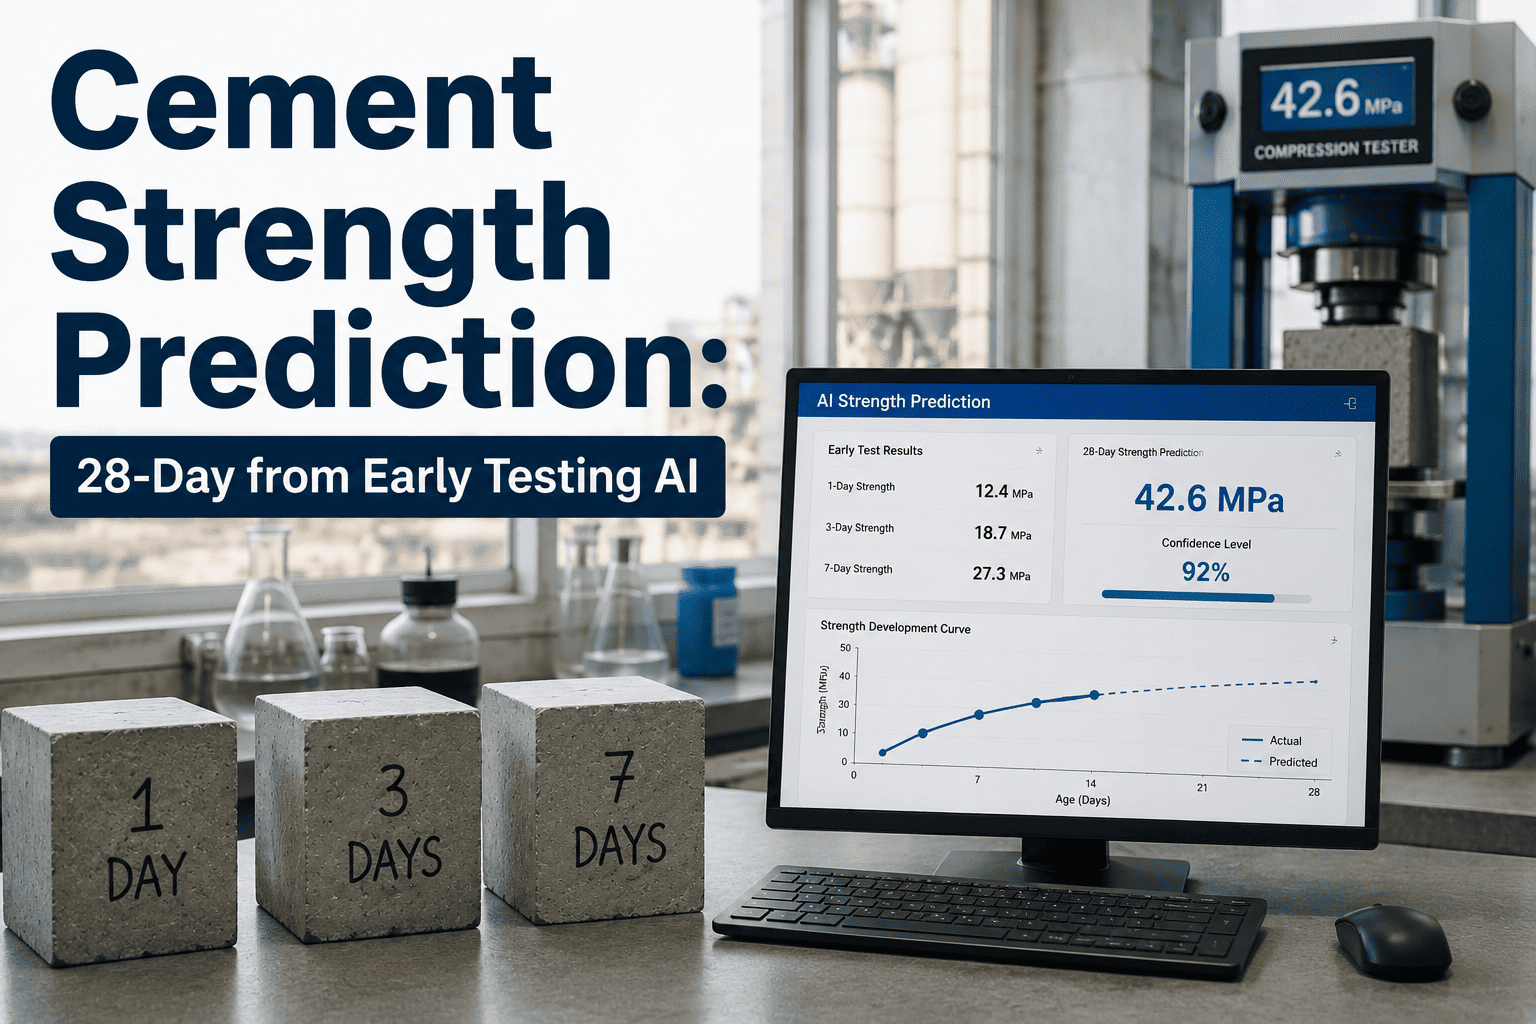
Tricalcium silicate, known in the lab as alite, is the mineral phase most responsible for early and 28-day compressive strength development in Portland cement. Clinker with a healthy alite content and a well-controlled crystal size hydrates predictably and builds strength on schedule, while clinker with excess unreacted lime or coarse, over-burnt alite crystals produces cement that is harder to predict and more likely to fall short of specification. Free lime and liter weight are the fast, practical proxies plants use every shift because a full XRD mineralogy run is too slow and too expensive to perform on every batch. The steps below trace how a burning zone deviation actually turns into a strength problem weeks later, which is the chain most quality investigations end up reconstructing after the fact.
Burning Zone Temperature Sets the Ceiling
The reaction that converts belite (C2S) and free lime into alite (C3S) only proceeds efficiently between roughly 1,400°C and 1,450°C. Below that window, insufficient liquid phase forms and lime stays uncombined, capping how much alite the clinker can develop no matter how long it stays in the kiln.
Residence Time Determines Completion
Even at the correct temperature, the alite-forming reaction needs enough time in the burning zone to run to completion. A kiln running fast to chase production numbers can leave the burning zone before the reaction finishes, showing up directly as elevated free lime on the next lab result.
Cooling Rate Locks the Crystal Structure
Clinker that cools slowly through the 1,250°C to 1,100°C range allows some C3S to revert back toward C2S, permanently reducing the reactive alite fraction. A quench rate above roughly 20°C per minute through that window is what preserves the strength-contributing structure formed in the kiln.
Lab Confirmation Closes the Loop
Free lime, liter weight, and periodic XRF-based Bogue calculations confirm what the process data predicted. When these three checkpoints agree consistently, quality teams gain enough confidence in the AI model to trust its early warnings between physical samples.
What Goes Wrong When Quality Drift Isn't Caught Early
Most clinker quality failures are not sudden events. They build gradually across a shift as one small process variable drifts, and by the time the lab confirms the problem, the plant has already produced hours of off-specification material that has to be reworked, blended down, or in the worst case, rejected outright. The four scenarios below cover the most common ways a slow drift in kiln conditions turns into a quality incident that shows up somewhere downstream of the burning zone, often in a part of the plant that has no direct visibility into what the kiln was doing when the problem originated.
Under-Burning Cascades
A burner flame that drifts out of shape or a fuel blend change reduces heat transfer gradually, pushing free lime upward over several hours before it crosses the alarm threshold on a shift-based sampling schedule.
Grinding Cost Escalation
Over-burnt, dense clinker with a high liter weight is significantly harder to grind, quietly raising cement mill power consumption long before anyone connects the increased kilowatt-hours per ton back to a kiln burning zone issue.
Customer Strength Claims
Cement produced from clinker with borderline free lime can pass initial testing but underperform on delayed strength or expansion tests at the customer site, generating claims that trace back to a burning zone deviation weeks earlier.
Blended Silo Contamination
Off-specification clinker that reaches storage before detection gets blended with good material in the silo, spreading the quality problem across a much larger production volume than the original deviation caused.
The Measurable Impact of Predictive Quality Monitoring
Plants that move from purely reactive lab testing to AI-assisted quality prediction consistently report faster deviation response and fewer downstream quality incidents, because operators get an early signal instead of a confirmed failure. The value shows up in two places at once: fewer silos of off-specification clinker that need to be reworked or downgraded, and lower average fuel consumption because the kiln spends less time running hotter than necessary as insurance against free lime spikes. Both effects compound over a full production year, which is why quality prediction is increasingly treated as a cost-control tool as much as a compliance one.
Clinker Quality Monitoring — Frequently Asked Questions
Can free lime be predicted accurately between physical lab samples?
Yes, when a model is trained on enough historical burning zone temperature, kiln speed, feed rate, and fuel data alongside matched lab results, it can estimate free lime trends with useful accuracy in the gap between samples. The prediction is not a replacement for lab testing, but an early warning layer that lets operators react to a developing deviation instead of waiting for confirmation, which is where our engineering team typically starts a deployment.
Why does liter weight matter if free lime is already being tested?
Liter weight testing takes only a few minutes and can be run more frequently than a full free lime titration, making it a useful rapid proxy for burnability between the scheduled free lime checks. A dropping liter weight trend combined with rising process temperature deviations is often the earliest physical signal a shift team has that clinker density and porosity are shifting away from target.
Does higher C3S content always mean higher cement strength?
Not necessarily, because C3S crystal size, MgO content, and SO3 solid solution all influence how reactive that alite actually is during hydration. A clinker with a moderate C3S content but well-formed, appropriately sized alite crystals can outperform a higher-C3S clinker with coarse, over-burnt crystals, which is why quality teams look at burning zone temperature and cooling rate alongside the raw mineral percentages.
How often should XRF and Bogue calculations be run for effective quality control?
Most plants run XRF-based elemental analysis and the resulting Bogue mineralogy calculation once or twice per shift, since it requires a fused or pressed sample and calibrated equipment that isn't practical to run continuously. This is exactly the gap that process-data-driven prediction is designed to fill, giving continuous directional visibility between the less frequent but more precise XRF checkpoints.
What kiln process data is needed to start predictive clinker quality monitoring?
A useful starting dataset includes burning zone temperature readings, kiln speed, feed rate, fuel rate and type, back-end oxygen levels, and at least several months of matched free lime, liter weight, and XRF lab results to train the correlation model. Plants that book a demo can walk through what data their existing kiln instrumentation already provides before any new sensors are specified.
Give Your Quality Team a Window Into the Burning Zone, Not Just the Lab Report
iFactory turns kiln process data into an early clinker quality signal, helping teams catch under-burning and over-burning before it reaches storage, grinding, or a customer complaint.