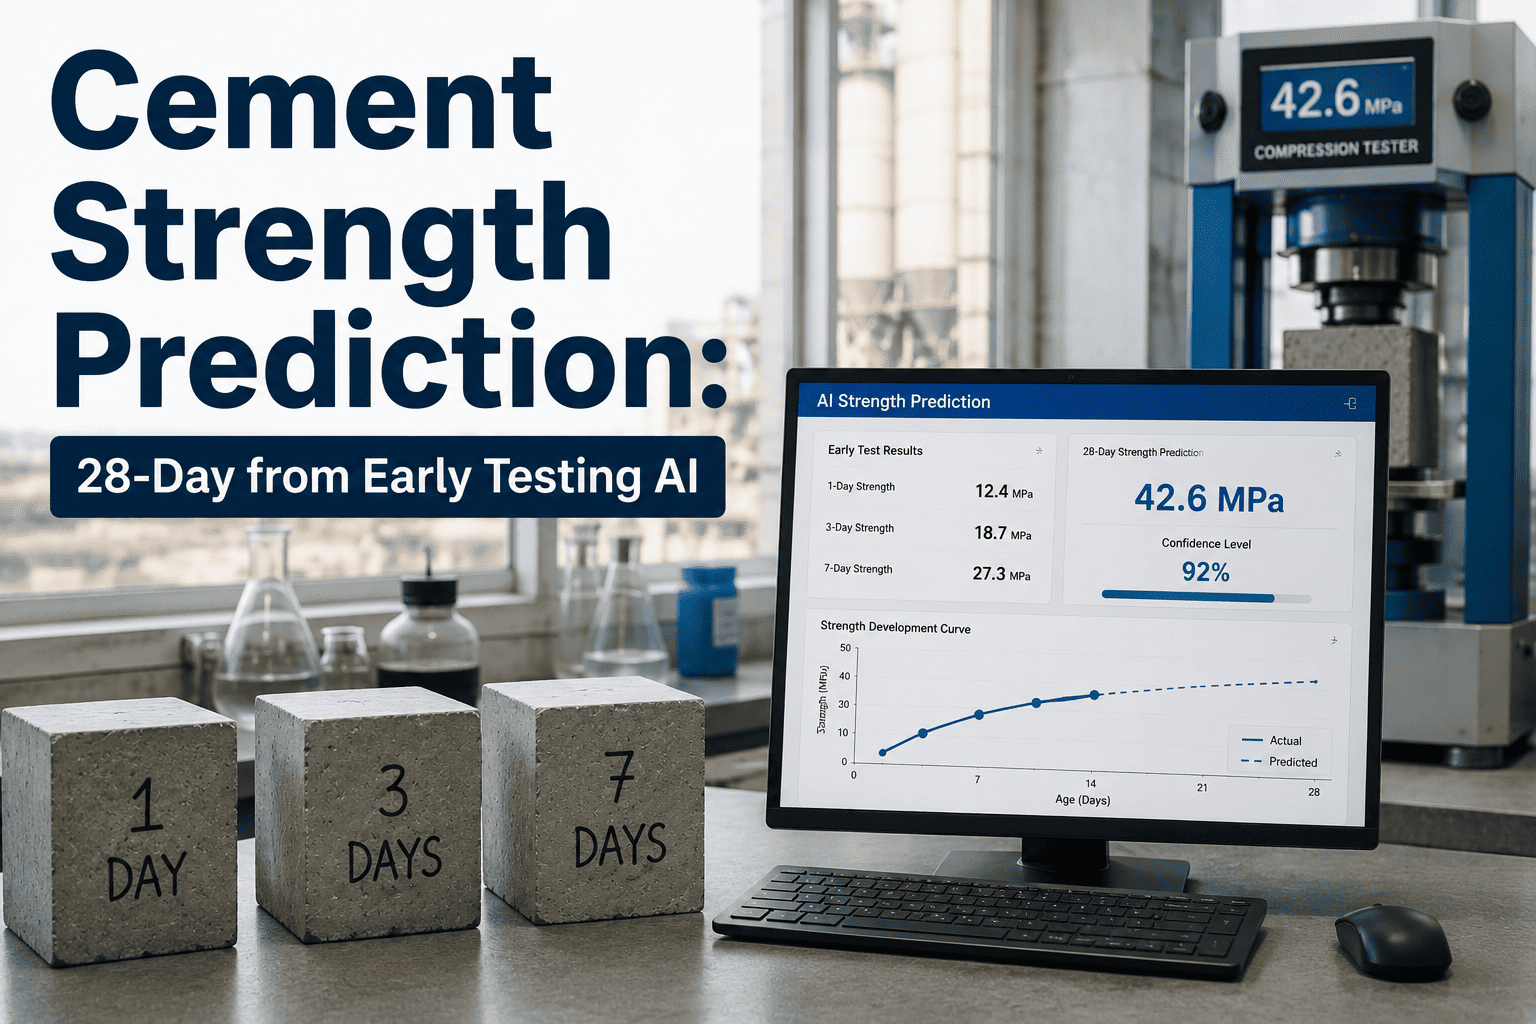
Every cement quality lab runs on the same twenty-eight-day clock, and that clock has not changed in over a century. Cubes are cast, cured, and broken at 1, 3, 7, and 28 days exactly as the standard requires, and the 28-day result is still the number that decides whether a batch is accepted, rejected, or flagged for a customer claim. The problem is not the test itself — it is what happens in the four weeks between casting the cube and reading the result, during which the kiln, mill, and blending conditions that produced that clinker have already moved on several times over. By the time a 28-day result comes back low, the plant has no way to trace it back to the specific production window that caused it. Book a demo to see how early-age prediction shortens that four-week blind spot to days.
CEMENT · QUALITY INSPECTION · STRENGTH PREDICTION
Know Your 28-Day Strength Before Day 7
iFactory correlates 1-day and 3-day strength results, cement chemistry, and fineness data to project 28-day compressive strength early enough to act on it, not just record it.
Why This Matters
The 28-Day Wait Was Designed for Compliance, Not Speed
The 28-day compressive strength test exists because it reliably reflects long-term hydration behavior, and standards bodies built quality specifications around it for good reason — it is a stable, well-understood benchmark. But stability was never the same goal as speed, and a plant that only finds out its strength is trending low a full month after the clinker was burned has no practical way to connect that result back to the specific raw mix, grinding fineness, or kiln condition that produced it. The production window responsible is long gone by the time anyone reads the number.
That lag creates a specific, recurring cost pattern: off-spec cement gets discovered only after it has already been bagged, shipped, or in some cases placed into a customer's structure. Reworking a blend after the fact, issuing a customer credit, or managing a strength-related claim all cost meaningfully more than catching the same issue while the batch is still inside the plant. Early-age prediction exists specifically to shrink that discovery window from weeks to days.
Research into early-age strength correlation is not new — mathematical models predicting 28-day strength from 1-day and 3-day results have existed in concrete literature for decades. What has changed is the ability to run that correlation continuously across live production data, using machine learning models trained on a plant's own historical chemistry, fineness, and strength records, rather than a generic formula applied after the fact in a spreadsheet.
The Correlation
Early Strength Results Carry More Signal Than Most Labs Use
1-Day
Earliest Signal
First strength reading available, useful for catching gross mix or grinding errors early but a weaker standalone predictor of 28-day strength on its own.
3-Day
Strongest Single Predictor
Published model studies consistently identify 3-day compressive and flexural strength as the most significant single input driving 28-day strength predictions.
7-Day
Confirmation Point
Widely used as a mid-course check against the specification, and as a secondary input that sharpens a prediction already made from 1-day and 3-day results.
28-Day
Compliance Result
The official quality-of-record result used for classing and specification compliance, and the number a well-tuned prediction model is trained to project accurately in advance.
Published machine learning studies on this exact problem report strong results: transformer and gradient-boosted models trained on early-age strength, chemistry, and fineness data have achieved R² values above 0.99 in predicting 28-day cement strength, with 3-day compressive and flexural strength consistently ranked as the most influential inputs in those models. That level of correlation is what allows a plant to treat an early-age prediction as an operational signal, not just an academic exercise.
Model Inputs
What a Strength Prediction Model Actually Needs
SEE YOUR OWN STRENGTH CURVE MODELED
Turn Early-Age Test Results Into a 28-Day Forecast
Our team will walk through how iFactory trains a strength prediction model on your plant's own chemistry, fineness, and testing history.
Old Way vs New Way
Traditional QC Versus Predictive Strength Monitoring
| Dimension |
Traditional 28-Day QC |
AI-Based Early Prediction |
| Time to actionable result |
Approximately 28 days |
Days, once early-age and chemistry data are in |
| Traceability to production cause |
Weak, since conditions have since changed |
Strong, correction happens near the same batch |
| Role of 1-day and 3-day tests |
Informal early indicators, rarely modeled formally |
Core predictive inputs feeding the model |
| Compliance record |
28-day test remains official |
28-day test remains official, model adds early view |
| Response to a drifting mix |
Discovered after full batch already shipped |
Flagged while adjustment is still possible |
Nothing about predictive monitoring removes the 28-day test from the quality program — it remains the specification of record for classing, shipment release, and customer reporting. What changes is the four weeks in between, where a plant previously had no formal signal at all beyond an operator's informal read of the early-age numbers.
Cost of Waiting
What the Four-Week Blind Spot Actually Costs
Rework and Blend Correction
A mix drifting toward the low end of specification runs unnoticed for the full 28 days, meaning any correction to grinding fineness or clinker blend ratio only happens after several weeks of production have already gone out the door.
Customer Claims and Reputation
Strength issues discovered by a customer after placement are far costlier, both financially and reputationally, than the same issue caught internally before the cement ever left the plant.
Inventory and Release Delays
Plants that hold cement inventory pending 28-day confirmation tie up warehouse space and working capital for a month at a time, a cost that shrinks considerably once early strength can be projected with confidence.
Root Cause Investigation Cost
Tracing a low 28-day result back to a kiln or mill condition from a month earlier consumes significant quality team time and often ends without a conclusive answer once the relevant production window has passed.
Frequently Asked Questions
Cement Strength Prediction — FAQs
How accurate are AI models at predicting 28-day cement strength from early results?
Published research on this exact problem reports strong performance, with some gradient-boosted and transformer-based models achieving R² values above 0.99 when trained on early-age strength, chemistry, and fineness data together. Accuracy in practice depends heavily on how much historical, consistently tested data a specific plant has available to train the model, and how stable the raw mix and grinding process have been over that history.
Book a demo to see this modeled against your own plant's testing history.
Which early-age result matters most for predicting 28-day strength?
Across multiple published studies, 3-day compressive strength consistently ranks as the single most significant input, followed closely by 3-day flexural strength where that data is available. 1-day results add some early signal but are generally considered a weaker standalone predictor, useful mainly for catching gross mix or grinding errors rather than fine-tuning a 28-day forecast on their own.
Does predicting 28-day strength early mean the 28-day test can be skipped?
No. The 28-day test remains the specification of record for classing, shipment release, and customer-facing quality documentation in virtually every standard. Early prediction is an operational tool that sits alongside the 28-day program, giving quality and production teams an actionable signal during the weeks the official test is still curing, not a replacement for the compliance test itself.
What other variables improve a strength prediction beyond early-age test results?
Clinker chemistry, particularly C3S content and free lime at the time of grinding, along with Blaine fineness and particle size distribution, all materially improve prediction accuracy when added alongside early-age strength readings. Curing temperature and maturity data further refine the model, since hydration rate and therefore strength development at any given age depends heavily on temperature history.
Book a demo to see which of these inputs matter most for your specific mix designs.
How much historical data does a plant need before a prediction model becomes reliable?
There is no single universal threshold, but plants with at least a year or two of consistently recorded early-age and 28-day results, tied to matching chemistry and fineness data, tend to produce a model that performs reliably across normal production variation. Plants with sparse or inconsistent historical records typically need a longer validation period before the prediction is trusted for operational decisions rather than treated as a directional estimate.
CEMENT · QUALITY INSPECTION
Stop Finding Out About Strength Problems a Month Late
iFactory connects your early-age testing, chemistry, and fineness data into one predictive strength view, so quality issues get caught while there is still time to act on them.