A kiln drive that trips during a half-second voltage sag can cost hours of lost production and a ramp-up cycle that burns fuel before a single tonne of clinker is produced — yet the event itself might never show up anywhere except a fault light that flickered and a shift log entry reading "drive tripped, unknown cause." Voltage sags are the most common power quality disturbance in industrial settings, and an average industrial facility can experience dozens of sag events a year, each one a candidate for a production stoppage if the equipment behind it is not built to ride through. Logging every power quality event against what it actually did to production is what turns "the drive trips sometimes" into an evidence-based case for a fix. Electrical and reliability teams who want to see their own power events linked to production impact can walk through a power quality event log review with our team.
Connect the Voltage Event to the Production Stop It Caused
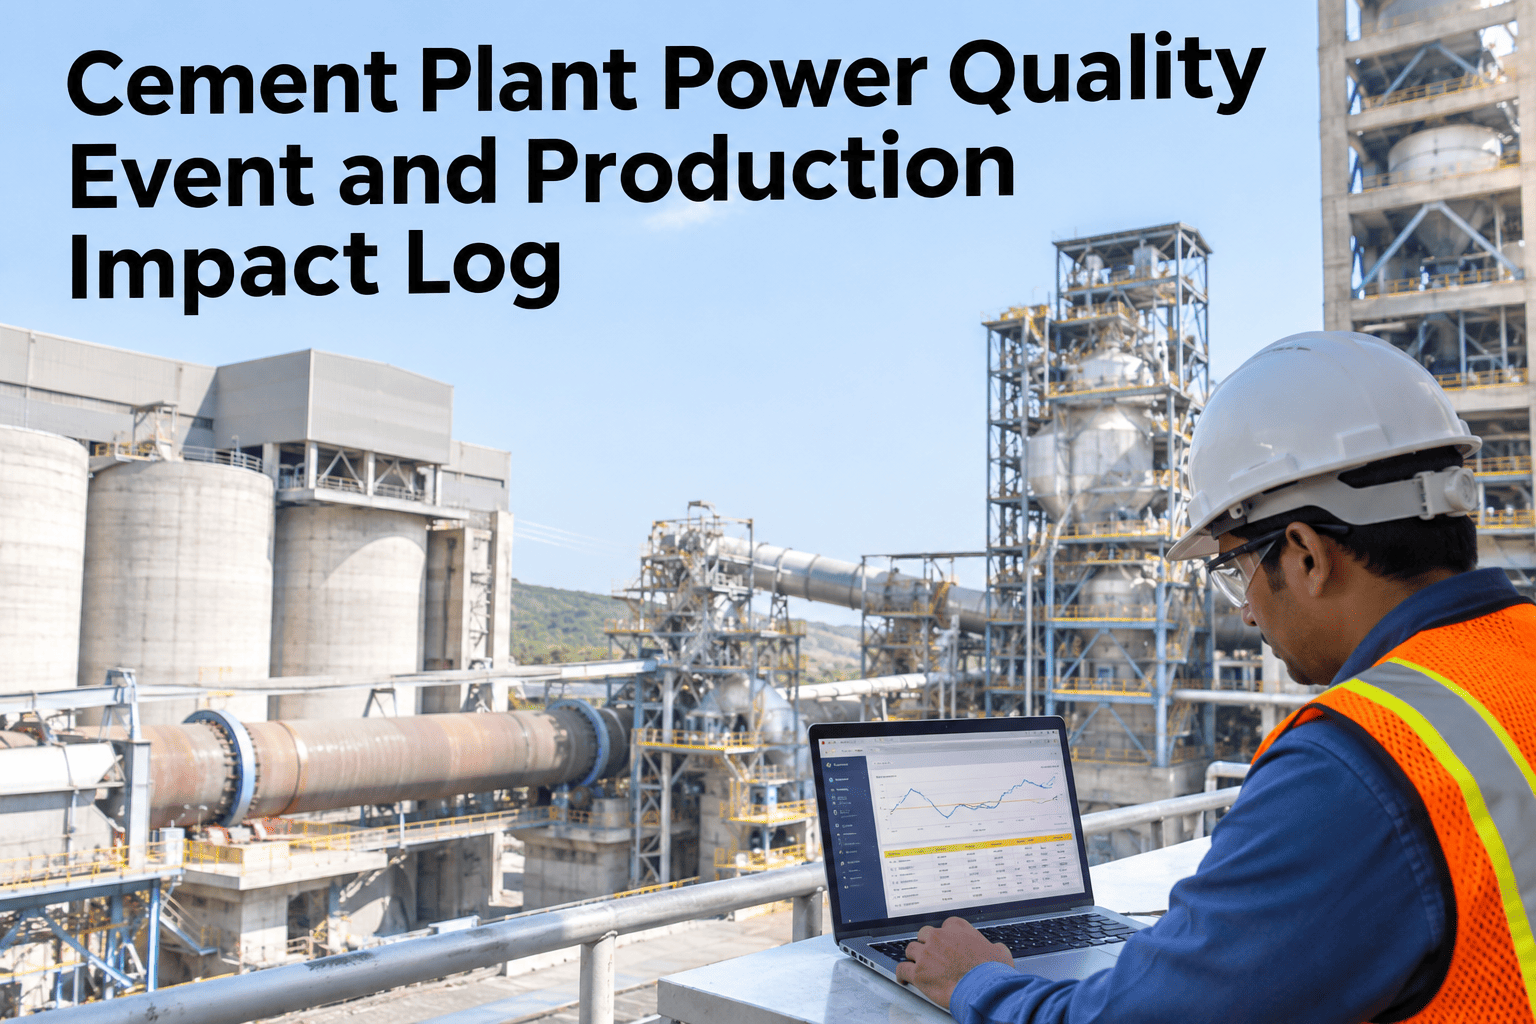
iFactory, an on-premise AI platform for cement plant energy and reliability, logs every power quality event alongside affected equipment and the production timeline it disrupted.
Why Does "The Drive Trips Sometimes" Never Get Fixed?
A power quality meter logs the voltage event. A production log, if it captures anything at all, logs the downtime. The two usually live in different systems, checked by different people, and nobody routinely connects a specific sag at 14:32 to the specific kiln drive trip at 14:32 that followed it. Without that link, a recurring problem looks like a string of unrelated incidents instead of one pattern with one fix. Ask our team how your current power and production logs would connect.
Event Types and What Each One Typically Does
| Event type | Definition | Typical equipment impact |
|---|---|---|
| Sag | Voltage drop to 10-90% of nominal, brief duration | VSD trip, PLC reset, contactor drop-out |
| Swell | Voltage rise to 110-180% of nominal, brief duration | Insulation stress, component failure over time |
| Interruption | Voltage drops below 10% of nominal | Full stop of affected equipment |
| Transient | Very short, high-magnitude spike | Electronic component damage, nuisance trips |
See Which of Your Recent Trips Trace Back to a Power Event
Share a recent unexplained drive trip, and we will show how to check it against a power quality record.
From Event Capture to a Closed Root Cause
Voltage and frequency are recorded continuously at the point of monitoring.
Each event is tagged as a sag, swell, interruption or transient.
Equipment trips in the same window are matched to the event.
External grid cause versus internal switching cause is determined.
A corrective action — ride-through upgrade, utility complaint, internal fix — is tracked to close.
External Grid Event vs Internal Switching Cause
The Kiln Drive Trip That Was Never the Drive's Fault
A kiln main drive tripped three times in a month, each time blamed loosely on "drive instability" with no deeper investigation. A correlated power quality log showed all three trips lined up with voltage sags recorded at the plant's incoming feeder within the same second.
Power Events and Production Impact, on One Timeline
Continuous Power Monitoring
Voltage and frequency events are captured and classified automatically against IEEE 1159.
Automatic Correlation
Equipment trips are matched to power events in the same window, without manual cross-checking.
Root Cause Workflow
External versus internal cause is tracked through to a documented corrective action.
Turnkey On-Premise Deployment
Power quality and production data stay on your own server, with no outside cloud dependency.
What Electrical Teams Ask About Power Quality Event Logging
What's the difference between a sag and a full interruption?
A sag is a brief drop to 10 to 90 percent of nominal voltage, while an interruption drops below 10 percent — the distinction matters because equipment ride-through capability is usually rated differently for each. Review your own event classification against these definitions.
How do we know if a trip was caused by a power event or an internal fault?
A correlated log checks whether a power quality event was recorded in the same window as the trip — if nothing shows on the power record, the cause more likely sits with the equipment itself. Ask support how correlation is checked.
Can we use this data to raise an issue with our utility?
Yes, a documented event log with timestamps, severity and production impact gives a utility concrete evidence to investigate, which is far more effective than a general complaint about unreliable power. Discuss building a utility-ready event record.
Does ride-through capability cost a lot to add to existing drives?
Cost varies by drive type and the depth of sag it needs to ride through, so a targeted upgrade on the specific drives shown to be most affected is usually more practical than a blanket plant-wide change. Discuss targeted ride-through options for your equipment.
How long should power quality data be retained?
Retention depends on how often you review trends and whether you need historical evidence for a utility dispute or insurance claim, so most plants keep at least a year of event-level data on hand. Ask about retention settings for your event log.
Stop Guessing Which Trips Are Power Events
See voltage events, affected equipment and production impact connected on one timeline.