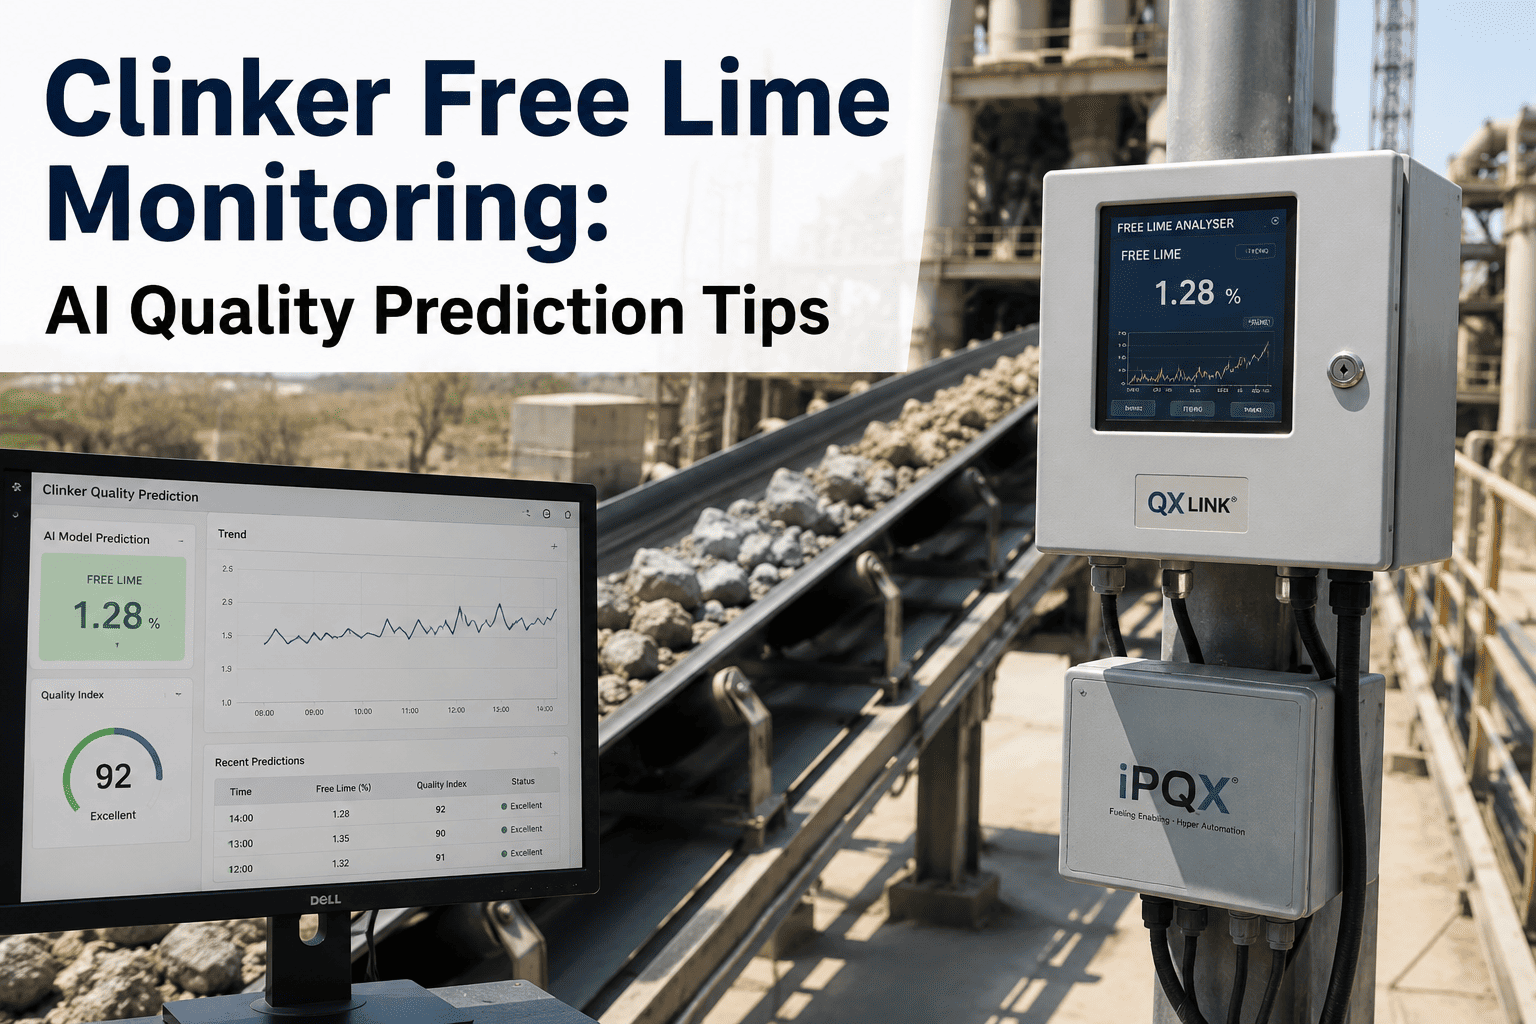
Free lime is the single most unforgiving number in a cement quality lab. A clinker sample can pass every other chemical and physical check and still get rejected the moment free-CaO drifts outside its narrow band, because it signals the kiln simply did not finish converting calcium oxide into the silicate phases that give cement its strength. The trouble is that free lime forms deep inside a burning zone running past 1,400°C, where no sensor can sit long enough to measure it directly, so every plant is left inferring quality from temperature, feed chemistry, and fuel data that update continuously against a lab result that only arrives every few hours. That lag is exactly where off-spec clinker slips through, tonne after tonne, before anyone in the control room even knows there is a problem. Book a demo to see how AI-based free lime prediction closes that gap before it costs you a kiln stop.
Free Lime Is a Symptom, Not a Cause
Free lime, or uncombined calcium oxide, is what remains in clinker when the burning zone has not fully converted the raw mix into the calcium silicate phases that give cement its strength. It is not a defect that originates in one place — it is the downstream readout of everything upstream: raw mix chemistry, burning zone temperature stability, kiln feed homogeneity, coal quality, and kiln speed all feed into the same final number. That makes free lime an excellent quality indicator and a genuinely difficult one to control, because by the time a lab result flags a problem, the conditions that caused it may have already changed several times over.
Most plants target a free lime range between roughly 0.5% and 1.5% at the kiln outlet, with the majority of stable operations clustering closer to 0.8–1.2%. Values above roughly 2.0% typically indicate the burning zone is running cold relative to the feed chemistry, while values pushed too low through overcompensation bring their own risk of over-densified, hard-to-grind clinker and accelerated refractory wear. Neither extreme is free — it is simply a choice between which cost shows up first, in the mill or in the kiln.
The physical reason free lime cannot be measured directly in the burning zone is straightforward: at 1,400–1,450°C, the clinker bed is in a semi-liquid state, and no practical sensor survives long enough in that environment to give a continuous free-CaO reading. Every plant is therefore working from proxies — burning zone temperature, kiln torque, back-end oxygen, and feed ratio — updated every few seconds, layered against a lab free-lime result that updates every two to four hours at best. Historically, the only bridge between those two timescales has been operator experience: an experienced burner watching flame shape, clinker bed viscosity, and coating appearance can often sense a free lime problem developing before the lab confirms it, but that judgment lives in one person's head and does not transfer cleanly across shifts or new hires.
That reliance on individual judgment is precisely the gap a correlation model is built to fill, not by replacing the operator's experience but by making the same pattern-recognition available continuously, consistently, and across every shift regardless of who is at the panel. Book a demo to see how a correlation model bridges that timing gap using data you already collect.
The Parameters That Define an In-Spec Burn
Kiln operators do not control free lime directly — they control the handful of process variables that determine it, each within its own target band. Holding all of them inside range simultaneously, rather than chasing one at a time, is what separates a stable burn from a kiln that is constantly being corrected after the fact.
| Control Parameter | Typical Target Range | Impact When Out of Spec |
|---|---|---|
| Burning Zone Temperature | 1,400 – 1,450°C | Low: unconverted free-CaO. High: dense clinker, refractory wear, ring formation |
| Free Lime (f-CaO) | 0.5% – 1.5% | Above 2.0% signals underburning; above 3.5% risks cement soundness failure |
| Liquid Phase Content | 20% – 27% by weight | Too low delays alite formation; too high causes sticky, unstable clinker beds |
| Lime Saturation Factor (LSF) | Plant-specific, typically 0.92 – 0.98 | Drift raises fuel demand needed to hold the same free-lime target |
| Kiln Speed | Process-specific | Too fast reduces residence time, raising free-CaO at a given temperature |
These targets interact rather than acting independently. A kiln can be sitting precisely inside its burning zone temperature window and still produce high free lime if the raw mix LSF has drifted, or if coal ash infiltration has quietly pulled the mix chemistry off target. That interaction is exactly why single-variable monitoring — watching temperature alone, or free lime alone — consistently misses the early signals that a multi-variable model catches.
What Actually Moves Free Lime, Shift to Shift
Underburned and Overburned Clinker Are Both Expensive
How Continuous Prediction Closes the Lab Sampling Gap
Connecting Prediction to Daily Kiln Discipline
A free lime prediction model is only as useful as the workflow it feeds into. The plants that get the most value from continuous prediction are not the ones with the most sophisticated model — they are the ones that connect the predicted trend directly to the same control room screens, shift handover reports, and kiln operator training that already govern day-to-day burning zone decisions. A prediction sitting in a separate dashboard nobody checks during a shift change delivers little more value than the lab result it was meant to supplement.
The strongest programs also tie the prediction back to root cause, not just the number itself. When predicted free lime starts drifting, the same model surfaces which upstream variable moved first — burning zone temperature, feed LSF, or coal quality — so the operator response is a targeted correction rather than a blanket temperature adjustment that risks overcorrecting into the opposite problem. Book a demo to see this root-cause view applied to your own kiln's historical data.
What It Actually Takes to Stand Up Free Lime Prediction
The single biggest factor in how quickly a plant can stand up a working free lime prediction model is not sensor availability — most modern kilns already log everything the correlation needs through the existing DCS historian. It is the depth and consistency of historical lab data available to train the model against. Plants with two or more years of consistently timed free lime samples, tied cleanly to the corresponding DCS timestamps, tend to get a usable prediction running far faster than plants where lab records are inconsistent or where sampling frequency has changed several times over the years.
Raw mix chemistry stability matters almost as much as data volume. A kiln running a single, well-controlled quarry blend produces a cleaner correlation than one that regularly switches between multiple raw material sources with different chemical signatures, simply because the model has to account for more variability in what free lime should look like at any given temperature. Neither situation rules prediction out, but it does change how much historical data is needed before the model can be trusted for day-to-day operator decisions rather than treated as a directional trend line.
Most plants that go through this process start with a validation phase, running the predicted free lime alongside the existing lab program for several weeks without changing any operating decisions, simply to confirm the correlation holds across different production rates, fuel mixes, and seasonal raw material shifts. Only once that validation period shows consistent agreement does the predicted trend typically get promoted to a live control room display that operators are expected to act on during a shift.