Most cement plants find out their WHR plant underperformed for a quarter, not the day it started. The power output number gets pulled once a month from a handful of disconnected meter logs, someone reconciles it against expected generation, and only then does anyone notice the plant delivered 22% instead of 28% of site power for the past ten weeks. Nobody caused that gap on purpose — it accumulated a fraction of a percent at a time across boiler fouling, turbine wear, and condenser scaling, invisible in any single day's reading. A live KPI dashboard doesn't prevent every one of those issues, but it turns a quarter-long blind spot into a same-week correction, which is the entire difference between a WHR plant that pays back in three years and one iFactory gets called in to fix after it already hasn't.
Four Numbers Tell You Whether Your WHR Plant Is Actually Working
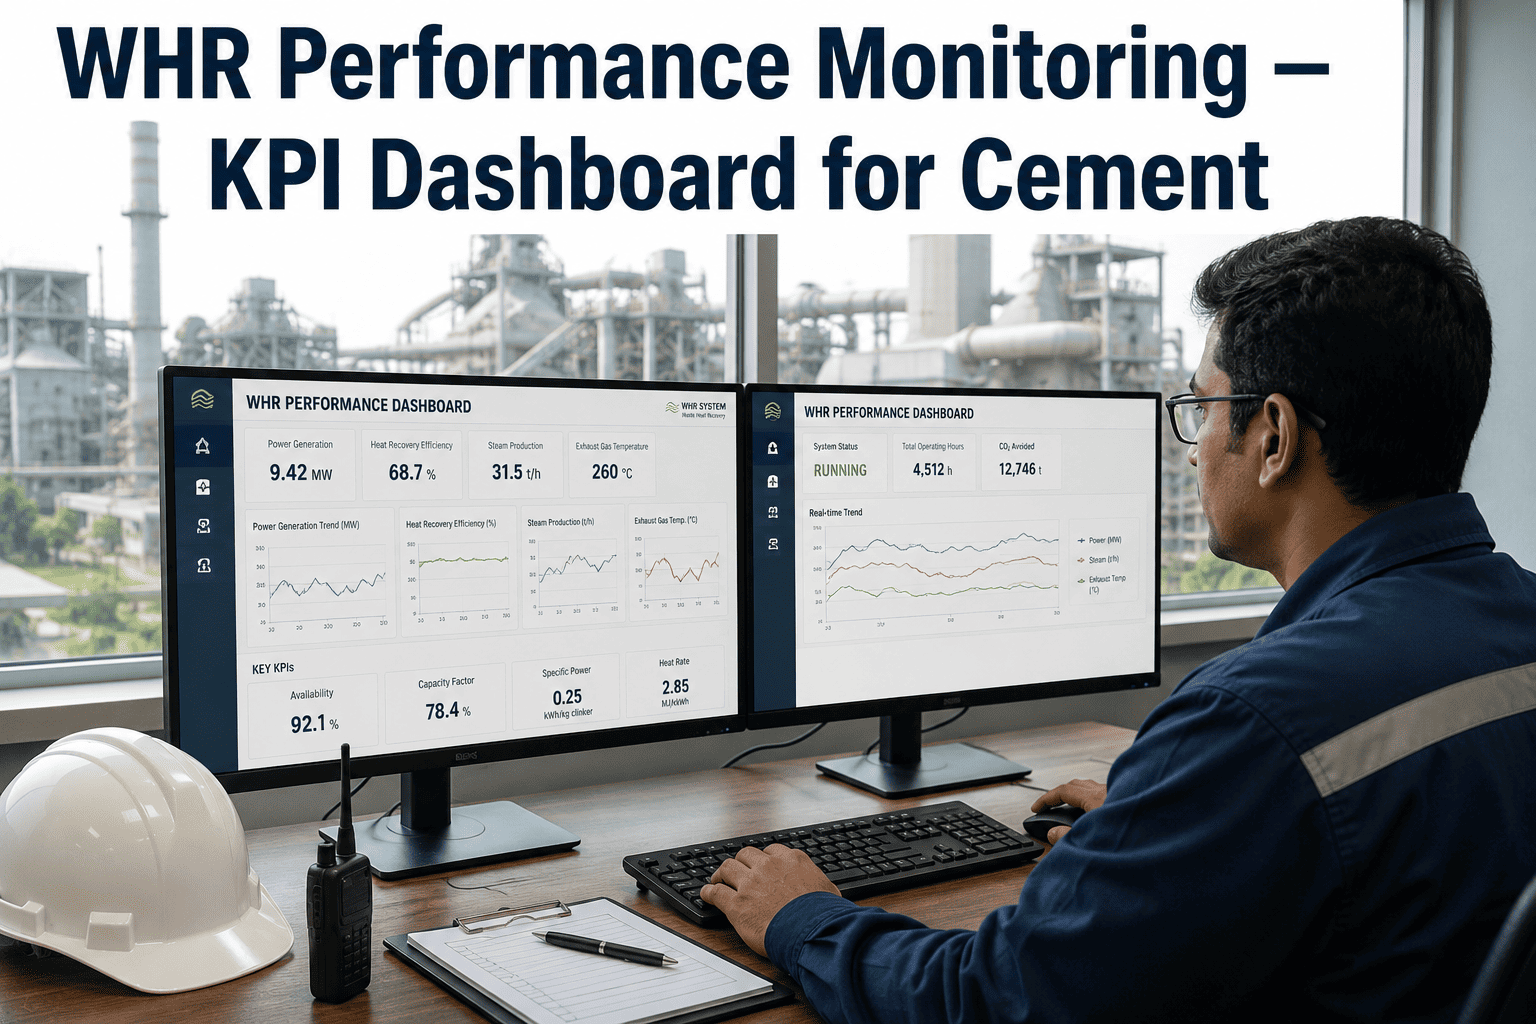
A well-run WHR system can realistically cover 18 to 30% of a cement plant's power demand and generate on the order of 25 to 30 kWh per tonne of clinker, with a payback window of roughly two to three years. Whether a specific plant is hitting those numbers or quietly falling short of them comes down to four KPIs, tracked daily rather than discovered monthly.
The Four KPIs That Actually Matter
Plenty of dashboards show dozens of WHR data points. Only four of them tell you, at a glance, whether the plant is performing to design — the rest are useful for diagnosing why, once one of these four has already moved. Every additional metric on a WHR dashboard should ultimately trace back to explaining a change in one of these four, not compete with them for attention.
Power Output (MW)
The raw generation number in real time, measured against the design capacity for current kiln operating conditions rather than nameplate rating alone. A gap here that persists for more than a shift is the first sign something upstream has changed.
Heat Rate (kcal per kWh)
How efficiently recovered thermal energy converts into electricity. A rising heat rate at steady steam conditions is one of the earliest signals of turbine efficiency loss from seal wear, blade erosion, or condenser vacuum degradation.
Availability (%)
The share of total time the WHR plant is actually generating versus tripped, in bypass, or under maintenance. Availability below roughly 85 to 90% usually points to a maintenance cadence problem rather than a design limitation.
Capacity Factor (%)
Actual energy generated over a period divided by what the plant would generate running at full rated output the entire time. This is the number that ultimately tells finance whether the WHR investment is on track for its payback timeline.
Want to see these four KPIs built against your own plant's WHR meter data? Book a dashboard walkthrough and bring your last six months of generation logs.
Benchmark Ranges and Warning Thresholds
A KPI without a benchmark is just a number. These are the ranges that separate a WHR plant performing to design from one that is quietly leaking value, along with where each figure typically comes from. None of these thresholds are universal constants — they should be calibrated against each plant's own commissioning baseline and feasibility study — but they give a starting point for what "normal" looks like before a plant has built its own history.
| KPI | Healthy Range | Investigate Below | Primary Data Source |
|---|---|---|---|
| Power output vs. design | 95–100% of expected for current kiln load | Under 90% for more than one shift | Generator meter, DCS |
| Heat rate | Stable within 2–3% of commissioning baseline | Rising trend over 2+ consecutive weeks | Steam flow, fuel-equivalent calc |
| Availability | 90%+ on a rolling 30-day basis | Below 85% rolling average | Trip logs, CMMS downtime codes |
| Capacity factor | Within 5 points of feasibility-study projection | More than 10 points under projection | Monthly generation report |
| Specific generation (kWh/t clinker) | 25–30 kWh per tonne on a well-designed system | Sustained drop of 3+ kWh/t | Production log cross-reference |
Why Monthly Reporting Misses the Window That Matters
Most cement plants still assemble WHR performance figures once a month from meter readings, DCS exports, and a maintenance log pulled by hand. Every one of those steps adds delay, and delay is exactly what turns a correctable trend into a quarter of lost generation. The gap between the two approaches below is not a matter of dashboard aesthetics — it is the difference between catching a boiler fouling trend in its second week and discovering it only once the quarterly reconciliation lands on someone's desk.
- Detection lag of 4–8 weeks between a degradation starting and someone noticing
- Root cause guessed after the fact from incomplete logs
- Corrective action scheduled for the next convenient outage, not the earliest one
- Finance sees the shortfall only in the quarterly power reconciliation
- Deviation flagged within the same shift it starts trending away from baseline
- Root cause narrowed immediately by cross-referencing heat rate, availability, and maintenance codes
- Corrective action scheduled against the earliest safe maintenance window
- Finance sees capacity factor trending against projection in real time, not after the fact
Energy Manager Perspective
We had all the meter data. What we didn't have was the four numbers next to each other on one screen, updated daily instead of assembled at month end. Once we put power output, heat rate, availability, and capacity factor on a single rolling baseline, we caught a condenser scaling problem in nine days instead of finding it in the next quarterly report.
— Energy Manager, cement plant WHR performance review
of total site power demand a well-maintained WHR plant can realistically cover
typical payback period for a WHR investment when performance tracks to design
average detection lag for a performance deviation under monthly reconciliation alone
What a Live Dashboard Recovers Over a Year
Closing the gap between monthly reconciliation and daily tracking is not a reporting upgrade — it is recovered generation. A capacity factor that trends a few points under projection for months, caught in week two instead of month three, is the difference between a WHR plant that hits its payback timeline and one that quietly extends it. Over a full operating year, that gap compounds into a meaningful share of the plant's total recoverable electricity, and every megawatt-hour missed is one still bought at full grid tariff instead of generated for the cost of dust and heat the kiln was already producing.
kWh generated per tonne of clinker on a well-maintained WHR system tracked to a daily baseline
CO2 reduction per kWh generated, which is also lost every time recoverable generation is missed
realistic detection window for a developing performance issue once the four KPIs sit on one rolling baseline
Curious what your capacity factor looks like against feasibility-study projections? Book a 30-minute review and iFactory will map the gap before your next quarterly report does.
Stop Finding Out Your WHR Plant Underperformed a Quarter Late
iFactory puts power output, heat rate, availability, and capacity factor on one live dashboard, benchmarked against your feasibility-study projection and updated daily instead of monthly. Start with one WHR line. See the deviation the week it starts. Then trust the number finance is reading.
Frequently Asked Questions
What is the difference between availability and capacity factor for a WHR plant?
Availability measures the share of total time the WHR plant is actually able to generate, excluding time lost to trips, bypass operation, or planned maintenance — it answers whether the plant is running. Capacity factor measures actual energy generated over a period against what the plant would generate running continuously at full rated output, which answers whether the plant is running at the output it should be. A plant can show high availability while still posting a disappointing capacity factor if it is online most of the time but consistently underperforming on output, which is exactly why both numbers need to sit on the same dashboard rather than being tracked separately, reviewed by different teams, and reconciled only weeks apart.
How much power can a cement plant WHR system realistically generate?
On a well-designed installation, specific generation typically falls in the range of 25 to 30 kWh per tonne of clinker, which for a large kiln line can translate into enough electricity to cover somewhere between 18 and 30% of the plant's total power demand. The exact figure depends heavily on preheater exhaust temperature, clinker cooler air volume, moisture content of raw materials and fuel, and which thermodynamic cycle — steam Rankine, Organic Rankine, or Kalina — the system uses. Actual performance against that design figure is precisely what a live KPI dashboard is meant to confirm rather than assume.
Why does heat rate matter if power output already looks normal?
Heat rate can start rising well before power output falls far enough to look abnormal, because a turbine or condenser losing efficiency will draw more thermal input to hold the same electrical output for a period before the output itself finally drops. Tracking heat rate against a stable commissioning baseline surfaces that early inefficiency — often tied to condenser vacuum loss, seal wear, or scaling — while power output alone would still look acceptable. This is why heat rate belongs on the same dashboard as output rather than being checked only when output has already slipped.
Can a WHR KPI dashboard integrate with our existing DCS and CMMS?
Yes. A functioning WHR dashboard needs to pull generator meter data and steam parameters from the DCS in real time, and cross-reference that against maintenance and downtime codes logged in the CMMS, so an availability dip can be tied to its actual cause rather than left as an unexplained gap in the trend line. iFactory's platform connects to standard DCS historians and CMMS systems via existing tags and APIs, so the four core KPIs update from data the plant is already generating rather than requiring new instrumentation.
How quickly can a plant expect to see value from moving to daily KPI tracking?
Most plants see the first meaningful catch within the first month, simply because a deviation that would previously have accumulated for four to eight weeks under monthly reconciliation gets flagged within days once the same four KPIs sit on a rolling baseline. The larger value compounds over a full year, as the gap between actual and projected capacity factor narrows and the WHR investment tracks closer to its original payback timeline. Book a review to see what your current reporting cadence is likely costing in detection lag alone.