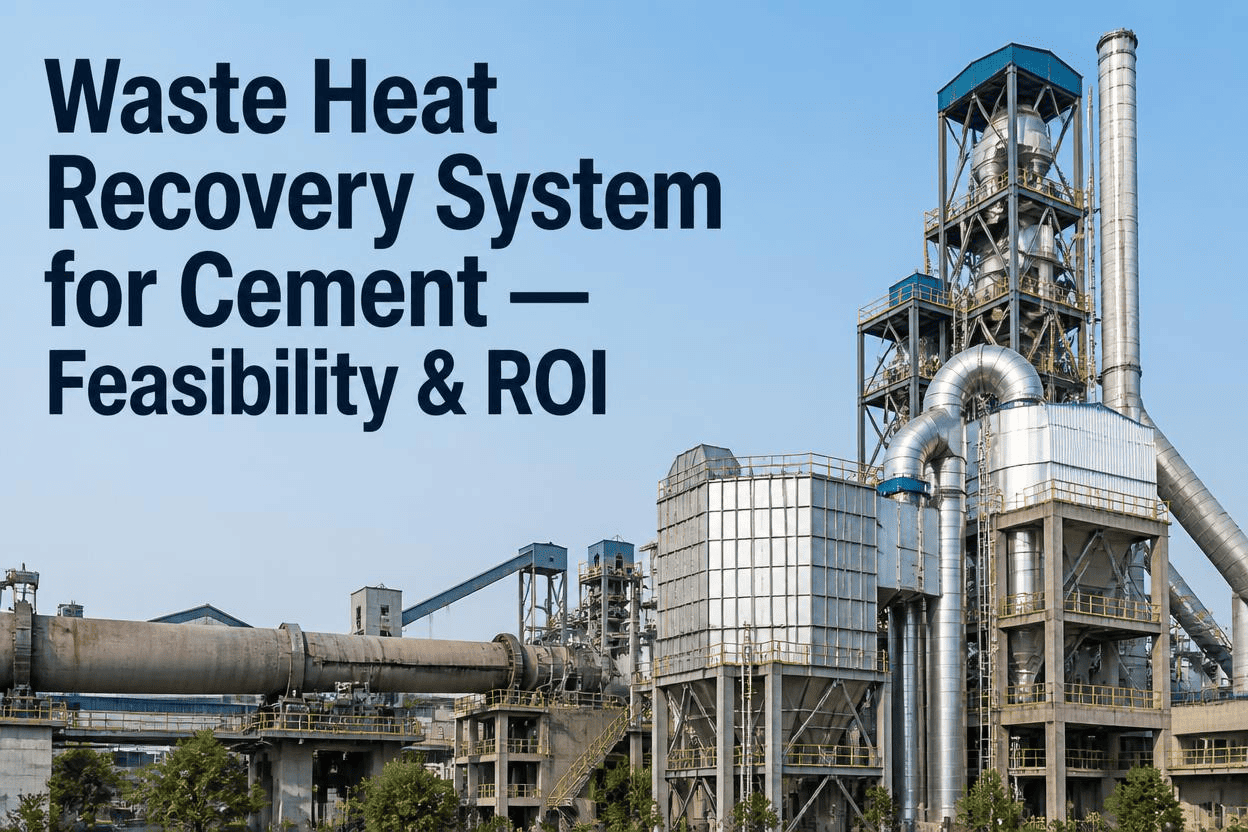
A waste heat recovery system in a cement plant is only as good as the efficiency it actually delivers on a given operating day, and that efficiency is rarely the number stamped on the original design sheet. Approach temperatures widen as heat exchanger surfaces foul with dust, turbine blades lose their aerodynamic edge to erosion, and condenser vacuum drifts as cooling water quality degrades, and each of these changes quietly shaves megawatts off the power a WHR system was built to generate. Most plants discover the gap only when a quarterly performance test shows generation running well below the commissioning baseline, by which point months of lost recovery have already passed. The sections below walk through where WHR efficiency actually leaks, how to monitor it continuously rather than periodically, and how a maintenance program built around a short scheduling demo keeps a WHR system closer to its designed output year round.
Every Degree of Approach Temperature Drift Is Megawatts Walking Out the Stack
iFactory tracks the heat exchanger, turbine, and cooling system indicators that actually predict WHR power output, and turns any efficiency drop into a scheduled maintenance action before the next performance test finds it.
Three Systems, Three Different Ways to Lose Power Output
A cement plant WHR system converts preheater exhaust and clinker cooler air into steam or organic working fluid and then into electricity, and each conversion stage has its own degradation path. Heat exchanger surfaces foul with cement dust on the gas side and scale on the water side, narrowing the approach temperature and reducing heat transfer long before any alarm trips. Turbine blades erode from entrained particulate in the working fluid, and nozzle wear changes the pressure drop the turbine was designed around. Cooling systems lose capacity as condenser tubes scale and cooling towers lose fill efficiency, which raises back pressure and caps the turbine's achievable output regardless of how much heat reaches it. None of these three failure paths shows up as a hard trip. They show up as a slow, compounding decline in kilowatt-hours per tonne of clinker that is easy to miss without continuous tracking.
What to Track Daily, Weekly, and Quarterly to Catch Drift Early
WHR efficiency does not fail suddenly. It drifts, and the drift is only visible if the right parameters are checked at the right frequency against the right baseline. Daily flue gas temperature and steam flow readings tell you whether the immediate operating point matches expectations, but they will not reveal a slow fouling trend on their own. Weekly approach temperature checks and monthly condenser vacuum reviews catch the medium-term drift that daily snapshots miss. Quarterly turbine efficiency calculations, run from actual operating data rather than design assumptions, are what confirm whether the unit is still converting heat to power at anywhere near its commissioned rate.
| Frequency | What to Check | What It Reveals |
|---|---|---|
| Daily | Flue gas inlet and outlet temperature, steam pressure and flow, feedwater quality | Immediate deviation from the current operating baseline |
| Weekly | Approach temperature differential across each heat exchanger bank | Early-stage fouling buildup on gas or water side |
| Monthly | Condenser vacuum level, cooling water flow rate, cooling tower condition | Back-pressure creep that caps turbine output |
| Quarterly | Vibration trending on all bearing positions, turbine efficiency calculation from live data | Mechanical wear and the true generation efficiency gap versus baseline |
| Annual | Turbine internal inspection, tube bundle inspection, working fluid analysis | Condition requiring planned overhaul versus continued monitoring |
Six Practices That Keep a WHR System Near Its Design Output
Facilities that hold WHR generation close to design intent over multiple years share a common set of operating disciplines rather than a single piece of technology. The practices below are drawn from how well-run WHR programs structure their maintenance calendars, their cleaning intervals, and their escalation triggers.
Steam Rankine Cycle vs Organic Rankine Cycle for Cement Exhaust
Most cement WHR installations recover heat from two distinct exhaust streams, the preheater exit gas and the clinker cooler vent air, and the temperature profile of each stream drives which thermodynamic cycle makes sense. A standalone steam Rankine cycle using water as the working fluid performs well against the higher-temperature preheater stream, where enough thermal energy is available to generate high-pressure steam efficiently. The clinker cooler stream runs at a lower temperature, and an organic Rankine cycle, using an organic fluid with a lower boiling point and higher vapor pressure than water, extracts useful power from that lower-grade heat far more effectively than a steam cycle could. Many plants run both cycles side by side, or a combined configuration feeding both streams into one power block, and the maintenance profile for each differs enough that condition monitoring thresholds should be set per cycle rather than applied uniformly across the whole WHR installation.
| Factor | Steam Rankine Cycle | Organic Rankine Cycle |
|---|---|---|
| Typical heat source | Higher-temperature preheater exhaust gas | Lower-temperature clinker cooler vent air |
| Working fluid | Water, requiring water treatment and boiler-grade feedwater quality | Organic fluid, requiring periodic fluid analysis and top-up instead of water treatment |
| Fouling risk profile | Gas-side dust fouling dominant, boiler tube scaling secondary | Gas-side fouling similar, but lower operating pressure reduces some mechanical stress |
| Typical maintenance focus | Boiler tube integrity, feedwater chemistry, turbine blade erosion | Working fluid condition, evaporator fouling, seal integrity at lower pressure |
Stop Finding Out About Efficiency Loss at the Quarterly Test
iFactory schedules every WHR inspection point on meter-based and calendar triggers, logs every reading against your commissioning baseline, and flags the moment approach temperature, vibration, or vacuum drifts past your defined threshold, so degradation becomes a work order instead of a surprise.
Five Signs a WHR System Needs Attention Before the Next Scheduled Outage
Waiting for the next planned overhaul to address a developing WHR problem often means accepting months of avoidable generation loss. The signs below are the ones most commonly missed until a quarterly performance test finally quantifies the gap.
What Disciplined WHR Efficiency Management Is Worth
The figures below reflect the range of outcomes reported by cement plants that moved from calendar-only WHR maintenance to condition-based, continuously monitored programs, measured against comparable plants still running periodic inspection routines only.
What Unaddressed WHR Degradation Actually Costs Over a Year
The cost of deferred WHR maintenance rarely shows up as a single line item, which is exactly why it survives budget reviews that a more visible expense would not. A slow efficiency decline is absorbed into the plant's overall power bill rather than flagged as a maintenance failure, and by the time a quarterly performance test quantifies the gap, months of avoidable generation loss have already passed unrecovered. The breakdown below separates where that cost accumulates across a typical operating year for a WHR system left on calendar-only maintenance.
Fitting WHR Monitoring Into Plant Systems Already in Place
A WHR condition monitoring program does not need to operate as an isolated system sitting apart from the rest of the plant's instrumentation. Flue gas temperature, steam flow, and vibration data already exist in most plant DCS and SCADA historians, and a monitoring layer that reads directly from that existing infrastructure avoids duplicating field instrumentation that is already in service. The practical benefit is that approach temperature, vacuum, and vibration trending can begin almost immediately on any WHR system with reasonably complete existing instrumentation, with the main integration work focused on establishing thresholds and routing alerts to the right maintenance queue rather than installing new sensors.
Common Questions on WHR Efficiency Improvement
Turn WHR Maintenance From a Calendar Exercise Into a Data-Driven Program
iFactory connects your heat exchanger, turbine, and cooling system readings into one asset record, tracks every threshold against your own commissioning baseline, and automates the work orders that keep generation close to design output year round.