Waste Heat Recovery System for Cement — Feasibility & ROI

By Johnson on July 7, 2026

waste-heat-recovery-system-cement-feasibility-roi

Every rotary kiln in a cement plant throws away enough heat through the preheater tower and clinker cooler exhaust to run a meaningful share of the plant's own electricity load — most operators simply never turn that thermal loss into a line item they can act on. The question is never whether a plant has waste heat; it always does. The real question is whether the temperature, volume, and consistency of that heat justify the capital outlay for a recovery system, and how fast that outlay comes back. A proper feasibility study answers that with numbers, not assumptions, before a single boiler is ordered. If your plant has never had its thermal profile mapped against a WHR business case, book a demo to see what your kiln line's exhaust is actually worth.

Feasibility & ROI Blueprint
Waste Heat Recovery for Cement: Is Your Kiln Line Worth the Investment?
A structured way to size the thermal opportunity, choose between SRC and ORC, and model a realistic payback before committing capital
25–45
kWh recoverable per tonne of clinker produced
20–30%
Typical cut in purchased grid electricity
3–5 yrs
Common payback window for a properly sized system

Why Feasibility Is the Step Most Plants Skip

Plants rarely fail at WHR because the technology doesn't work — steam and organic Rankine systems have been recovering cement kiln heat for decades. They fail because the feasibility study was rushed, generic, or based on nameplate figures instead of the plant's actual, hour-by-hour thermal behavior.

A
Power Costs Keep Climbing
Grid tariffs rarely move in a cement plant's favor, and captive power from waste heat is one of the few costs a plant can lock in and stop worrying about for the next fifteen years.
B
Carbon Reporting Is Tightening
Scope 2 emissions tied to purchased electricity are under growing scrutiny, and self-generated WHR power is one of the more straightforward reductions a cement operation can document.
C
The Heat Is Already Paid For
Unlike solar or wind, WHR doesn't compete for land or depend on weather. The fuel is exhaust gas your kiln has already burned fuel to produce — the only remaining cost is capturing it.

Step 1: Map the Thermal Profile Before Anything Else

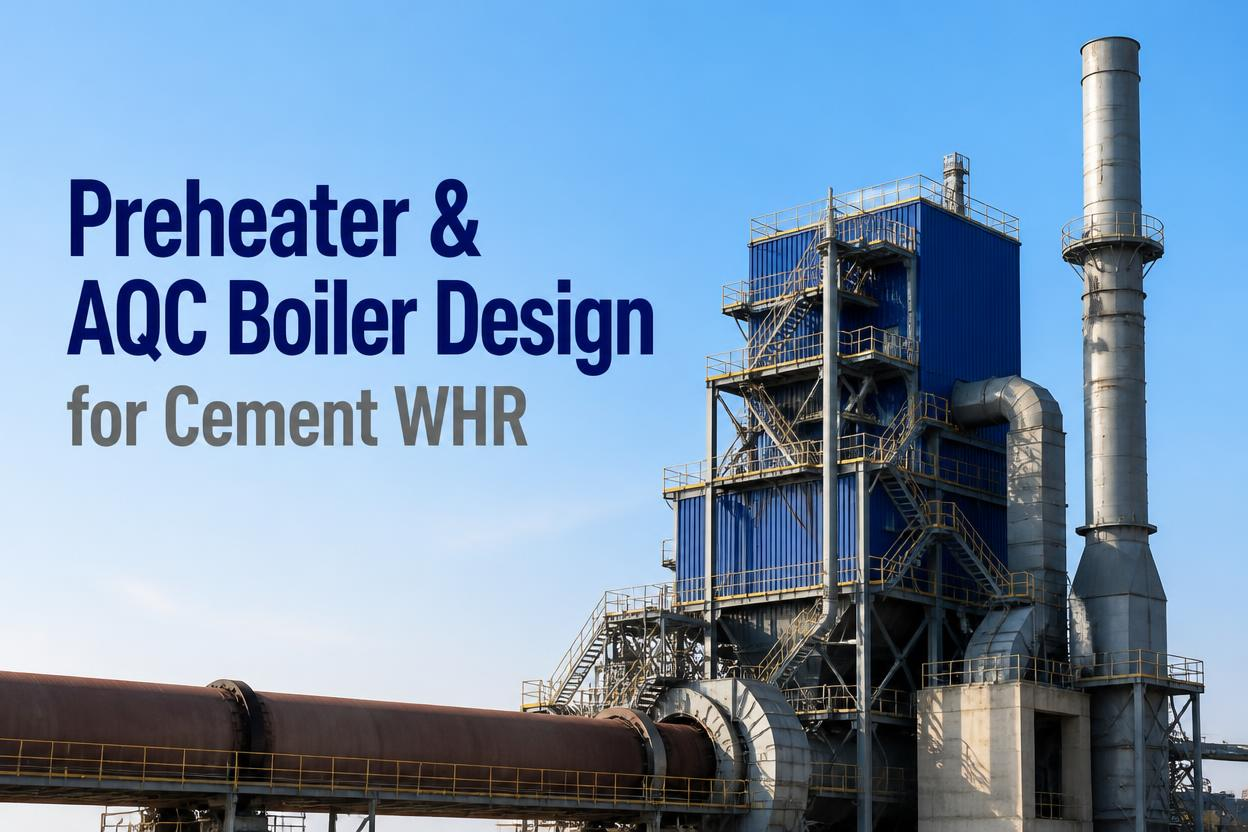
A feasibility study starts with two exhaust streams, not one. The preheater tower typically discharges kiln exhaust gas around 300–350°C, while the clinker cooler vents hot air near 300°C through its mid-tapping points. Neither stream is uniform — both shift with kiln feed rate, fuel mix, and cooler load, which is exactly why a single nameplate reading from the commissioning report is not enough to size equipment against.

01
Preheater (PH) Exhaust
Hot gas exiting the top cyclone stages, generally 300–350°C. Plants with older 4 or 5-stage preheaters typically carry more recoverable heat than newer 6-stage designs, since fewer stages already leave more thermal energy in the exhaust.
02
Clinker Cooler (AQC) Air
Hot air drawn from mid-tapping points on the grate cooler, close to 300°C. Mid-tapping placement matters because it captures the highest available gas temperature before dilution with ambient cooling air.
03
Continuous Logging
Temperature, flow, and dust loading are logged across weeks, not hours, so the feasibility model reflects real kiln variability instead of a single favorable snapshot.
04
Thermal Balance Check
The model confirms enough residual heat still reaches raw meal drying and pre-calcination, since a WHR system is only sized against heat that is genuinely surplus to the kiln process.

Step 2: Choose the Recovery Technology

Once the thermal profile is mapped, the central engineering decision is Steam Rankine Cycle versus Organic Rankine Cycle. Both convert the same PH and AQC heat into electricity, but they suit different plant conditions, and picking the wrong one erodes the payback case regardless of how well the thermal audit was done.

Factor Steam Rankine Cycle (SRC) Organic Rankine Cycle (ORC)
Best suited to Large kiln lines with consistently high exhaust temperatures Smaller lines or fluctuating, lower-grade heat loads
Working fluid Water, converted to high-pressure steam Organic fluid with a lower boiling point than water
Water requirement Higher — water treatment and cooling water needed Minimal to none, useful for water-scarce sites
Maintenance profile More complex, high-pressure turbine components Simpler, largely automated operation
Typical capacity fit Large-capacity lines, higher MW output Small to mid-capacity lines, partial-load tolerant

Most full systems combine one AQC boiler with one or two PH boilers on a single kiln line to capture both streams, rather than relying on either source alone.

A feasibility study is only as good as the thermal data behind it. See how continuous PH and AQC monitoring turns your kiln's exhaust into a bankable business case — book a demo to walk through your plant's numbers.

How Much Power Is Actually on the Table

The honest answer depends on kiln capacity, preheater stage count, and fuel mix, but industry data gives a workable range for early-stage sizing before a full audit is run.

25–45
kWh recoverable per tonne of clinker, depending on preheater stages and cooler design
6–9 MW
Typical generation output for a mid-to-large single kiln line running PH plus AQC recovery
~0.8 kg
CO2 avoided per kWh of self-generated power versus grid electricity, on average
2 of 3
Boilers a single kiln line typically needs — two PH units plus one AQC unit for full recovery

Matching System Size to Kiln Capacity

Feasibility numbers change meaningfully with plant scale, which is why a generic "one-size" WHR package rarely produces an accurate business case. A mid-sized line running around 3,000 tonnes per day and a large line running near 10,000 tonnes per day both follow the same PH-plus-AQC recovery principle, but the boiler heat exchange area, steam turbine selection, and expected megawatt output scale with throughput, not with a fixed template. A smaller line may only justify a single AQC boiler with a compact ORC package, while a large line with two PH boilers and one AQC boiler can often support a full steam turbine island generating several times the output. Sizing decisions made at this stage carry through every later number in the model — undersizing leaves recoverable power on the table, and oversizing extends the payback well past what the thermal profile can actually support.

Step 3: Model the Payback, Not Just the Capacity

Capacity numbers alone do not justify capital spend — the payback model is what a plant's finance team actually signs off on. Published project data across dozens of cement retrofits consistently lands in a 3 to 5 year payback range for well-matched SRC and ORC installations, though the number shifts with local tariffs, plant utilization, and how much of the thermal potential is actually captured.


Aggressive Case
High tariff, strong utilization
~2–3 yrs

Typical Case
Standard industrial conditions
~3–5 yrs

Conservative Case
Lower tariff, added CCHP scope
~6–7 yrs

The gap between the aggressive and conservative case is almost always explained by two variables: how accurately the thermal audit captured real operating conditions, and how tightly the plant tracks power substitution once the system is live — both of which are feasibility-stage decisions, not construction-stage ones.

Feasibility Concerns Worth Addressing Early

"Won't this starve the preheater of the heat it needs?"
No, when the system is engineered correctly. WHR captures heat only after it has already served the kiln process, and a digital thermal balance model verifies that raw meal drying and pre-calcination keep their required heat margin at every load condition.
"Isn't dust fouling going to wreck the boilers?"
Dust is a real operating factor, not a fatal flaw. Modern PH and AQC boiler designs include rapping and self-cleaning mechanisms, and tracking the temperature delta and pressure drop across each boiler flags fouling early enough to schedule cleaning before efficiency drops.
"What happens during kiln upset conditions?"
Automated bypass dampers divert exhaust gas away from the boilers instantly during start-up or upset events, so cement production always takes priority over power generation and the recovery system never becomes a bottleneck.

Traditional Feasibility Study vs. Digital Thermal Assessment

The gap between these two approaches usually shows up months after go-live rather than during the study itself. A one-time audit hands the plant a static report, a technology recommendation, and a payback estimate frozen at the moment the readings were taken. A continuous digital assessment keeps that same data flowing after construction, which means the plant can see whether real generation is tracking the original model or drifting away from it — and why — instead of finding out at the next annual energy review.

Dimension Traditional One-Time Study Continuous Digital Assessment
Data basis A handful of manual readings, often near-nameplate conditions Continuous PH and AQC temperature, flow, and dust logging
Accounts for kiln variability Rarely — single snapshot in time Yes — captures load swings across weeks of operation
Technology selection confidence Based on generalized industry benchmarks Based on this plant's specific thermal signature
Visibility after go-live Feasibility report is filed away once construction starts Power substitution rate and ROI tracked in real time post go-live
Early fault detection Not part of the scope Turbine vibration, bearing temperature, and boiler fouling flagged early

Frequently Asked Questions

How long does a proper WHR feasibility study take?
A thorough thermal audit generally needs several weeks of continuous PH and AQC monitoring to capture real kiln variability rather than a single favorable reading. That data feeds the technology selection between SRC and ORC and produces a payback model built on your plant's actual operating pattern instead of generic industry figures. Rushing this stage is the most common reason WHR payback estimates miss reality once construction is complete. A demo call can outline what a monitoring window would look like for your specific kiln line.
Is ORC always cheaper to maintain than steam Rankine systems?
Generally yes, since ORC systems avoid high-pressure steam components and use minimal or no water, which simplifies operation and reduces water treatment costs. That said, ORC is not automatically the right choice for every plant — large kiln lines with consistently high exhaust temperatures often get better economics from a steam Rankine system despite its higher maintenance complexity. The right answer depends on your thermal profile, not a blanket preference for either technology.
Can an existing, older cement line still be a good WHR candidate?
Often yes, and sometimes more so than a newer line. Plants with older 4 or 5-stage preheaters tend to leave more heat in the exhaust stream than modern 6-stage designs, which can mean a higher recoverable power potential per tonne of clinker. Cooler configuration and mid-tapping placement matter just as much as preheater age, so a proper thermal audit is still the deciding factor either way.
Does a WHR system count toward carbon reduction reporting?
Yes. Electricity generated from waste heat displaces purchased grid power, which directly reduces a plant's Scope 2 emissions since no additional fuel is burned to produce it. Many cement operators use documented WHR generation figures as one of their more straightforward, verifiable line items in sustainability and carbon disclosure reporting, since the power substitution can be metered and tracked continuously rather than estimated.
What ongoing monitoring does a WHR system actually need after installation?
Once live, the system still needs active tracking of turbine vibration, bearing temperatures, and isentropic efficiency to catch mechanical issues early, along with continuous monitoring of temperature delta and pressure drop across the PH and AQC boilers to detect dust fouling or tube leaks before they cut generation. Plants that treat go-live as the finish line rather than the start of ongoing monitoring typically see their real-world output drift below the original feasibility projection. Reach out to support to see how this monitoring is typically structured.
Find Out What Your Kiln Line Is Worth
A feasibility study built on real thermal data, not nameplate assumptions, is the difference between a WHR project that hits its 3 to 5 year payback and one that never gets board approval in the first place.

Share This Story, Choose Your Platform!