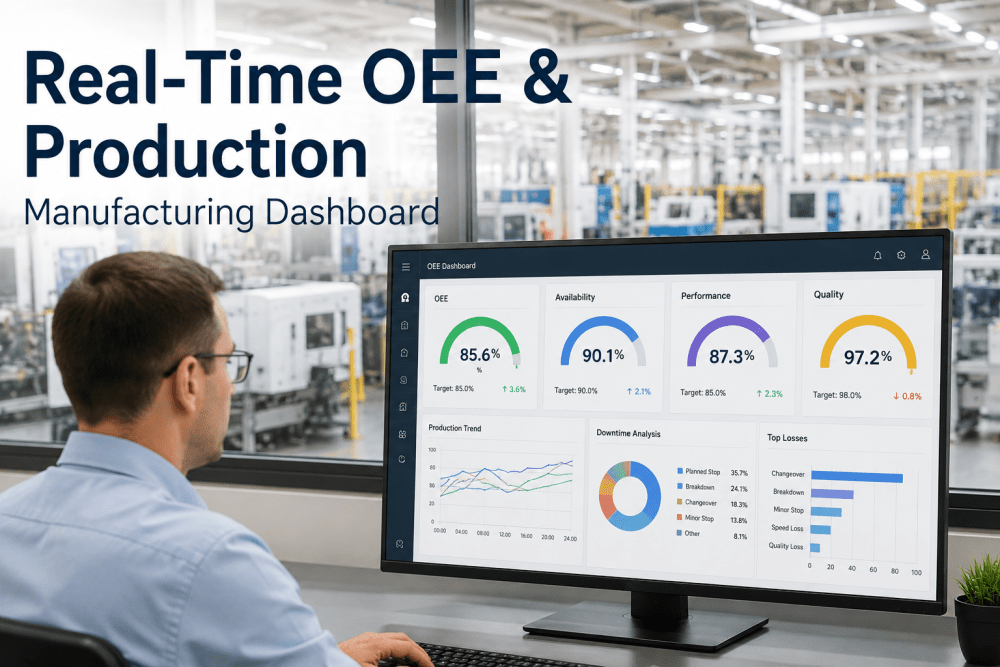
Most U.S. manufacturing plants have the sensor infrastructure to calculate OEE in real time—and most are still discovering their OEE numbers at the end of the shift from a spreadsheet their production supervisor fills out manually. That gap is not a technology problem. It is an integration and visibility problem. Overall Equipment Effectiveness is only actionable when it surfaces in real time, broken down by machine, line, and shift, connected to the actual loss events that are driving it below world-class benchmarks. A dashboard that shows 72% OEE at 5 PM is a historical record. A dashboard that shows availability dropping to 68% on Line 3 at 10:47 AM—with the root cause identified as a recurring changeover overrun on the downstream sealer—is an operational intervention tool. iFactory's real-time OEE and production monitoring platform does the latter, unifying Modbus OPC-UA, MQTT, and legacy PLC protocols into a single live dashboard that plant managers production supervisors, and operations directors use to stop losing output before the shift ends. Plants running iFactory report an average OEE improvement of 11–18 percentage points within the first 90 days of deployment.
Every Machine.
Live OEE Visibility.
How iFactory AI unifies disparate machine protocols into a single real-time OEE dashboard tracking availability, performance, and quality — and turns that data into production decisions that happen during the shift, not after it.
Why Real-Time OEE Changes What Manufacturers Can Actually Do
The ISO 22400 definition of OEE has not changed: it is the product of availability, performance, and quality. What has changed is the operational consequence of knowing your OEE in real time versus knowing it after the fact. An end-of-shift OEE report tells you what happened. A live OEE dashboard tells you what is happening — and gives your production team a fighting chance to intervene before a 4-hour availability event becomes a full shift of lost output.
The math is straightforward. A single production line running at 65% OEE when the world-class benchmark is 85% is leaving 20 percentage points of capacity on the floor — capacity that has already been paid for in labor, energy, and capital depreciation. At $12,000 per hour of rated output on a mid-complexity discrete manufacturing line, recovering 10 of those 20 points represents $1.2 million in additional annual output from the same footprint, with no new capital investment.
The Three OEE Pillars: What iFactory Measures and Why Each One Matters
OEE is a composite metric, and the actions required to improve it are entirely different depending on which pillar is driving the loss. A plant with 78% availability, 94% performance, and 91% quality needs a completely different intervention strategy than one with 94% availability, 78% performance, and 91% quality. iFactory's dashboard makes this distinction immediately visible — not as a single aggregate number, but as three live metrics with drill-down to the specific events behind each one.
Availability: Planned vs. Actual Uptime
Availability measures the percentage of planned production time that the equipment is actually running. iFactory captures every downtime event automatically from machine signals — no manual downtime entry, no shift supervisor estimation. Downtime events are classified by category (planned maintenance, unplanned breakdown, changeover, material shortage, operator absence) in real time, with duration, frequency, and MTTR tracked per machine, line, and shift. The platform surfaces your top three downtime contributors by category automatically every 24 hours, giving maintenance and production teams a Pareto-ranked action list without requiring any manual analysis.
- Automatic downtime capture from PLC and sensor signals
- Downtime categorization with MTTR and MTBF trending
- Changeover time tracking with target vs. actual comparison
- Automatic Pareto ranking of top downtime contributors daily
Performance: Actual vs. Ideal Cycle Time
Performance losses are the most underestimated OEE category in discrete manufacturing — because micro-stoppages under 2 minutes and speed reductions of 5–8% below rated capacity are invisible to manual tracking but cumulative in their impact. iFactory monitors machine cycle times against the ideal cycle time baseline in real time, flagging speed loss events the moment actual cycle time exceeds the rated threshold by more than the configured tolerance. A machine running at 93% of rated speed for 6 hours loses the same output as 25 minutes of unplanned downtime — and most plants never know it happened.
- Cycle time monitoring versus rated ideal cycle time baseline
- Micro-stoppage detection under 2-minute threshold
- Speed loss alerts with configurable tolerance bands
- Cumulative performance loss expressed in output units lost
Quality: Good Parts vs. Total Parts Produced
Quality losses include both scrap and rework — any unit that does not meet first-pass quality specification. iFactory integrates with vision inspection systems, CMM data feeds, and manual quality entry stations to track the good-parts ratio in real time. When quality drops below a configurable threshold, the dashboard alerts the quality supervisor and production manager simultaneously, with the timestamp and machine ID of the degradation event. The platform also tracks startup rejects separately from steady-state rejects — giving process engineers the data to quantify how much of the quality loss is attributable to changeover warm-up versus steady-state process drift.
- Real-time good-parts ratio from vision or manual QC entry
- Scrap and rework tracked separately with cost impact
- Startup reject rate tracked per changeover event
- Quality threshold alerts to supervisor and production manager
Composite OEE: Live Dashboard and Trend Analysis
The composite OEE score on iFactory's dashboard updates every 60 seconds per machine, with configurable refresh rates down to 15 seconds for high-speed lines where second-by-second cycle time matters. The dashboard supports simultaneous display of OEE across all lines in the facility on a single screen — a plant-wide view that production managers use during shift meetings to identify which lines need immediate attention versus which are performing on target. Trend charts show OEE by shift, week, and month with overlay capability to compare current performance against prior periods and target benchmarks.
- 60-second refresh rate with configurable down to 15 seconds
- Plant-wide view across all lines on a single display
- Shift, week, and monthly trend charts with period comparison
- Target benchmark overlay and gap-to-target calculation
Machine Protocol Unification: Connecting Every Machine to One Dashboard
The practical barrier to real-time OEE at most U.S. manufacturing plants is not a willingness problem — it is a protocol problem. A typical mid-size discrete manufacturer has equipment from 8–15 different vendors, spanning Siemens S7, Allen-Bradley ControlLogix, Fanuc CNC controllers, Mitsubishi MELSEC, legacy Omron and Modicon PLCs, and standalone machines with only dry-contact I/O available. Getting all of these onto a single OEE dashboard without a purpose-built integration layer requires either a multi-year IT project or a vendor-specific MES that forces equipment replacement. iFactory does neither. The following workflow shows how a typical multi-protocol manufacturing floor is connected in 3–6 weeks.
Machine Inventory and Protocol Audit
iFactory's integration team conducts a machine inventory mapping every piece of monitored equipment to its communication protocol, available data tags, and network topology. PLC-connected equipment is cataloged with rack and slot addressing; legacy machines with no network connectivity are assessed for dry-contact or analog signal availability.
Duration: 1–2 days on-siteEdge Gateway Deployment
iFactory edge computing gateways are installed at each production line — typically one gateway per 4–8 machines. The gateway connects to Siemens, Rockwell, Mitsubishi, Fanuc, and Beckhoff controllers via OPC-UA or native protocol drivers. Legacy equipment with no network port receives a discrete I/O module that converts run/stop, fault, and cycle complete signals to network-addressable data points without PLC modification.
Duration: 2–5 days depending on line countTag Mapping and Ideal Cycle Time Configuration
Each machine's run status, cycle count, fault code, and quality signal tags are mapped to the iFactory data model. Ideal cycle times are entered by machine and product code — the baseline the performance metric compares actual output against. Downtime reason codes are configured to match the plant's existing categorization scheme.
Duration: 1–2 days per facilityDashboard Configuration and Shift Structure Setup
Production lines, shift schedules, planned maintenance windows, and product changeover sequences are configured in the platform. The OEE calculation engine begins computing availability, performance, and quality metrics against the defined production schedule. Dashboard layouts are customized for plant-floor display screens, supervisor workstations, and mobile devices.
Duration: 1 dayLive Validation and Operator Training
The live dashboard runs in parallel with the existing manual tracking process for one week. Discrepancies between automated and manual OEE calculations are investigated and resolved — typically catching systematic errors in manual downtime categorization that were masking the true availability loss picture. Operator and supervisor training covers dashboard navigation, alert response, and downtime reason code entry for events requiring manual classification.
Duration: 5–7 daysReady to connect your production floor to a live OEE dashboard this quarter? Book a protocol assessment with iFactory's integration team — we'll map your machine inventory and give you a deployment timeline before any commitment.
OEE Benchmarks by Industry and What the Gaps Cost
Not all manufacturing sectors have the same OEE baseline or the same cost of losses. Here is how iFactory-monitored plants compare against industry benchmarks across six common discrete and process manufacturing categories, with the annual financial impact of the typical gap calculated at industry-average revenue-per-machine-hour figures.
| Industry Sector | Typical Current OEE | World-Class Target | OEE Gap | Est. Annual Loss per Line | Primary Loss Driver |
|---|---|---|---|---|---|
| Automotive Assembly | 68–74% | 85% | 11–17 pts | $820K–$1.4M | Availability |
| Food & Beverage | 60–70% | 80% | 10–20 pts | $380K–$920K | Quality |
| Pharmaceutical Mfg. | 55–65% | 80% | 15–25 pts | $1.2M–$3.8M | Quality |
| Electronics / PCB | 70–78% | 90% | 12–20 pts | $640K–$1.1M | Performance |
| Metal Fabrication | 63–72% | 82% | 10–19 pts | $290K–$680K | Availability |
| Plastics / Injection Molding | 65–75% | 85% | 10–20 pts | $420K–$940K | Performance |
From Dashboard to Action: How iFactory Closes the OEE Loop
A real-time OEE dashboard that displays loss data without connecting it to a corrective action workflow is a reporting tool, not an improvement tool. iFactory's platform closes the loop between OEE visibility and operational response through four integrated action mechanisms that convert loss event data into work orders, alerts, and production adjustments without manual coordination.
Automatic Work Order Generation
When a machine downtime event exceeds the configured threshold for a fault category — for example, a drive fault lasting more than 15 minutes — iFactory automatically generates a corrective maintenance work order in the connected CMMS with the machine ID, fault code, downtime duration, and OEE impact expressed in units of lost output. The maintenance supervisor receives a mobile alert with one-tap acknowledgment.
Escalation Alerts with Response Routing
OEE threshold breaches trigger tiered alerts: a first alert to the line supervisor when OEE drops below the warning threshold, an escalation to the production manager if no acknowledgment is received within the configured window, and a director-level notification if OEE remains below the critical threshold for more than the escalation period. Response routing is configurable by line, shift, and fault category.
Shift Performance Reports — Automated at Shift End
At the end of each shift, iFactory automatically generates a shift performance report for each production line — OEE by pillar, top three downtime events, output vs. target, and comparison to prior shift and same shift last week. The report is emailed to the supervisor and production manager and posted to the plant's digital shift log without any manual input required from the outgoing shift team.
Predictive Loss Forecasting
iFactory's analytics engine identifies recurring loss patterns — machines that consistently underperform on Monday morning, lines that show quality degradation after 4 hours of continuous run, changeover overruns that correlate with specific product sequence combinations — and surfaces these patterns as predictive alerts before the shift where the loss is likely to recur. This transforms OEE monitoring from reactive reporting to proactive loss prevention.
ROI of Real-Time OEE: What the Numbers Look Like at a U.S. Mid-Size Manufacturer
The financial case for real-time OEE monitoring is built on a simple calculation: the value of output recovered from existing equipment versus the cost of the platform that recovers it. Below is the ROI model for a representative U.S. discrete manufacturer with 6 production lines and an average current OEE of 67%.
Expert Review: What Operations Directors Say About Live OEE Visibility
"Before iFactory, our OEE was 69% and we thought we were doing reasonably well. Within the first two weeks of live monitoring we discovered that Line 4 was running at 84% of rated speed for the entire morning shift — a systematic speed loss that had been invisible in our manual tracking because operators weren't counting it as downtime. That single discovery was worth $340,000 per year in recovered output. We recouped the first year of platform cost in six weeks."
"The protocol unification was what I was most skeptical about. We have Siemens, Allen-Bradley, and three older Fanuc cells that nobody had been able to connect to anything centrally. iFactory had all six machines on the dashboard in four days. The actual OEE improvement — 67% to 79% in the first quarter — was significant, but it was the integration speed that changed my view of what was actually possible with our existing equipment."
Conclusion
Real-time OEE monitoring is not a reporting upgrade — it is a fundamental change in when and how production decisions get made. The difference between a 67% OEE facility and a 79% OEE facility is not equipment quality or workforce capability. It is the speed at which loss events are detected and acted on. Manual tracking systems compress that speed to a shift lag. iFactory compresses it to under two minutes — and connects that detection to automatic work orders, escalation alerts, and shift reports that require zero manual coordination from the production team.
The protocol unification capability is what makes this practical for the actual machine mix on most U.S. manufacturing floors. iFactory connects Siemens, Rockwell, Fanuc, Mitsubishi, legacy Modicon, and dry-contact-only equipment into a single data layer — no equipment replacement, no IT infrastructure project, no multi-year MES implementation. The result is an OEE visibility platform that most plants can have live within three to six weeks, generating measurable output recovery from existing capital in the first quarter of operation.
Frequently Asked Questions
Ready to Put Real-Time OEE to Work on Your Production Floor?
From mixed-protocol machine connectivity to live Availability, Performance, and Quality dashboards, automated shift reports, and CMMS-integrated work order generation — iFactory gives your production team the visibility to recover output from existing capital, starting in the first shift.