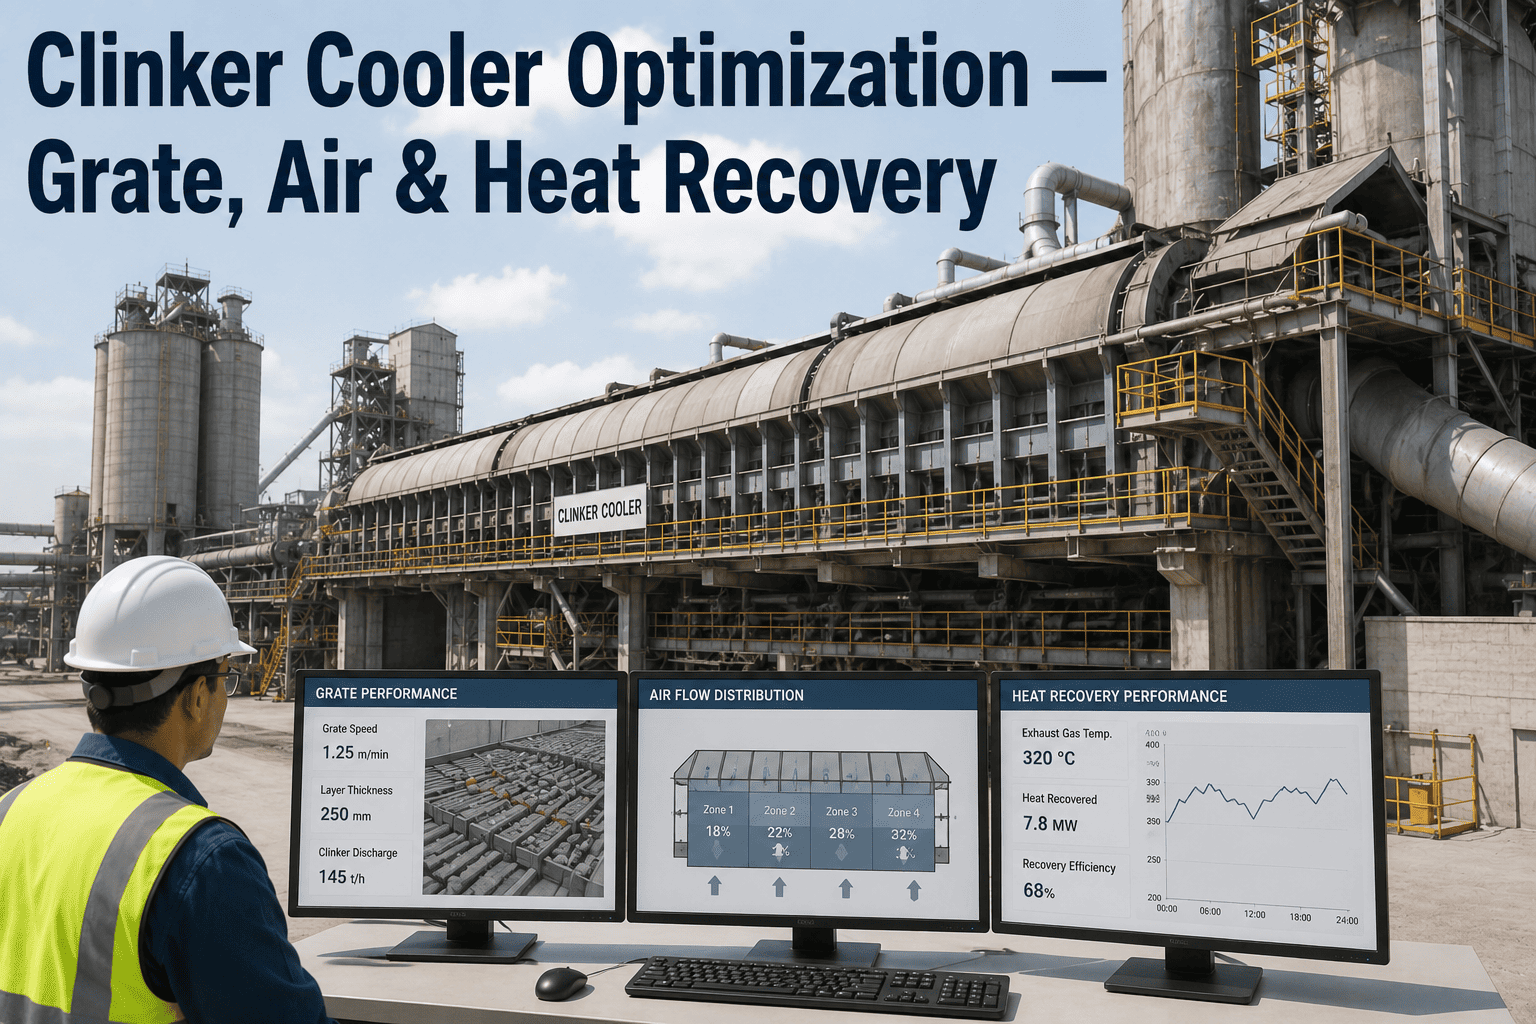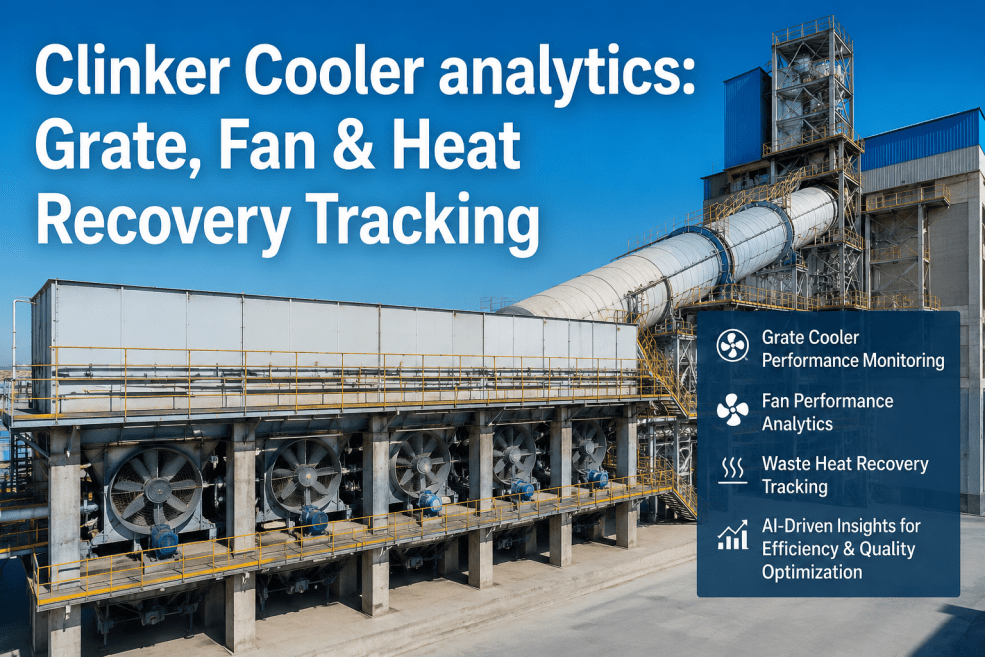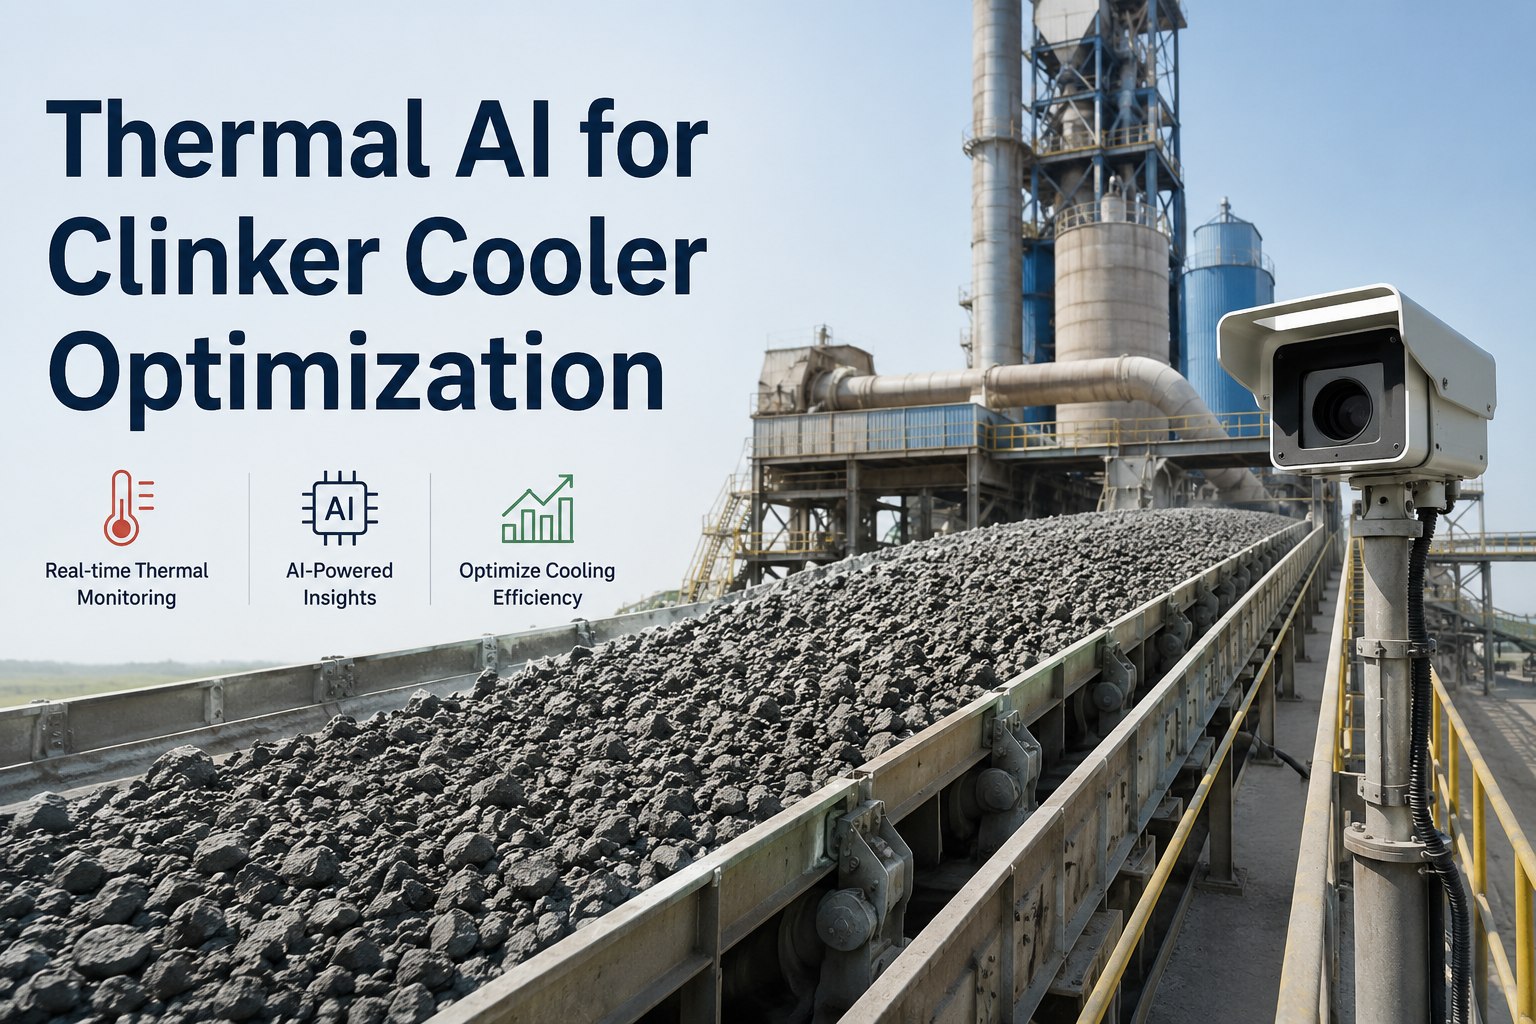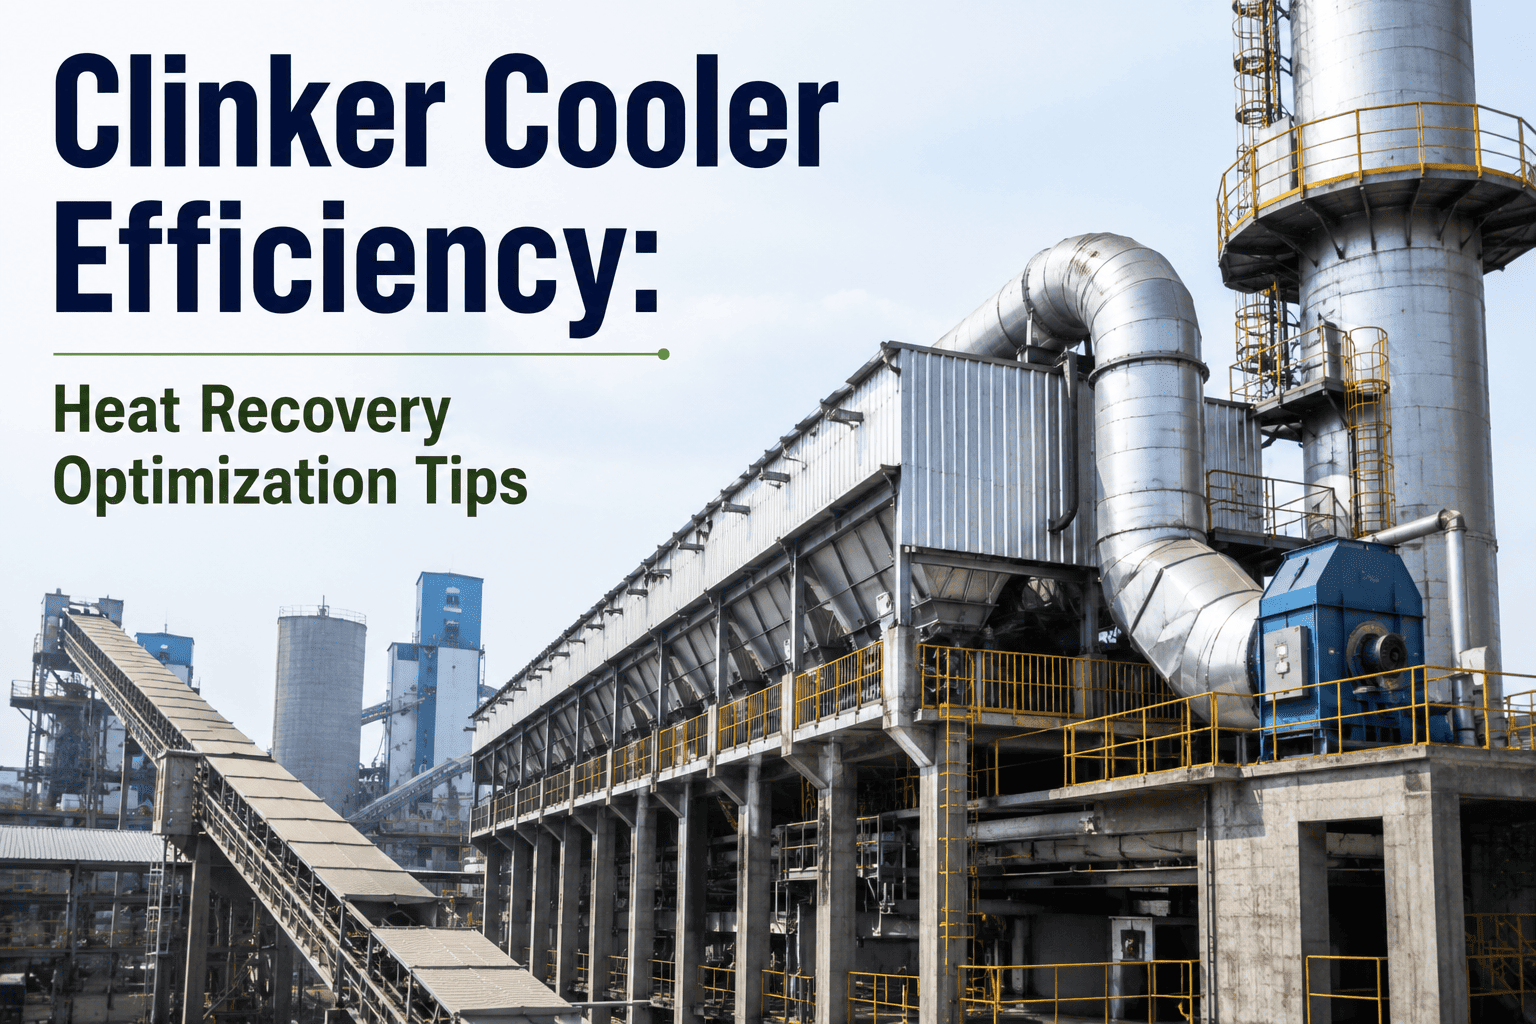
Every tonne of clinker leaves the rotary kiln carrying an enormous amount of heat, and the clinker cooler is the one piece of equipment standing between that heat being recovered as combustion air or lost permanently up the stack. Somewhere between thirty-five and forty percent of a cement plant's total process heat passes through this single machine, which means a poorly tuned cooler is not a minor efficiency gap — it is one of the largest fuel-cost levers in the entire pyroprocessing line. Most grate coolers run somewhere in the 76 to 86 percent thermal efficiency range, yet plant benchmarking studies consistently find another five to ten percent sitting unclaimed because of airflow imbalance, worn grate plates, or bed depth that drifts without anyone noticing. Reliability and process teams who want to see exactly where that unclaimed heat is going on their own kiln line can book a demo and walk through a live cooler heat balance.
Your Clinker Cooler Is Either Saving Fuel or Quietly Burning It
iFactory continuously models secondary air temperature, tertiary air temperature, bed depth, and grate airflow distribution, translating cooler performance directly into fuel cost so efficiency gains are measured in real currency, not just percentages.
Where Clinker Heat Actually Goes
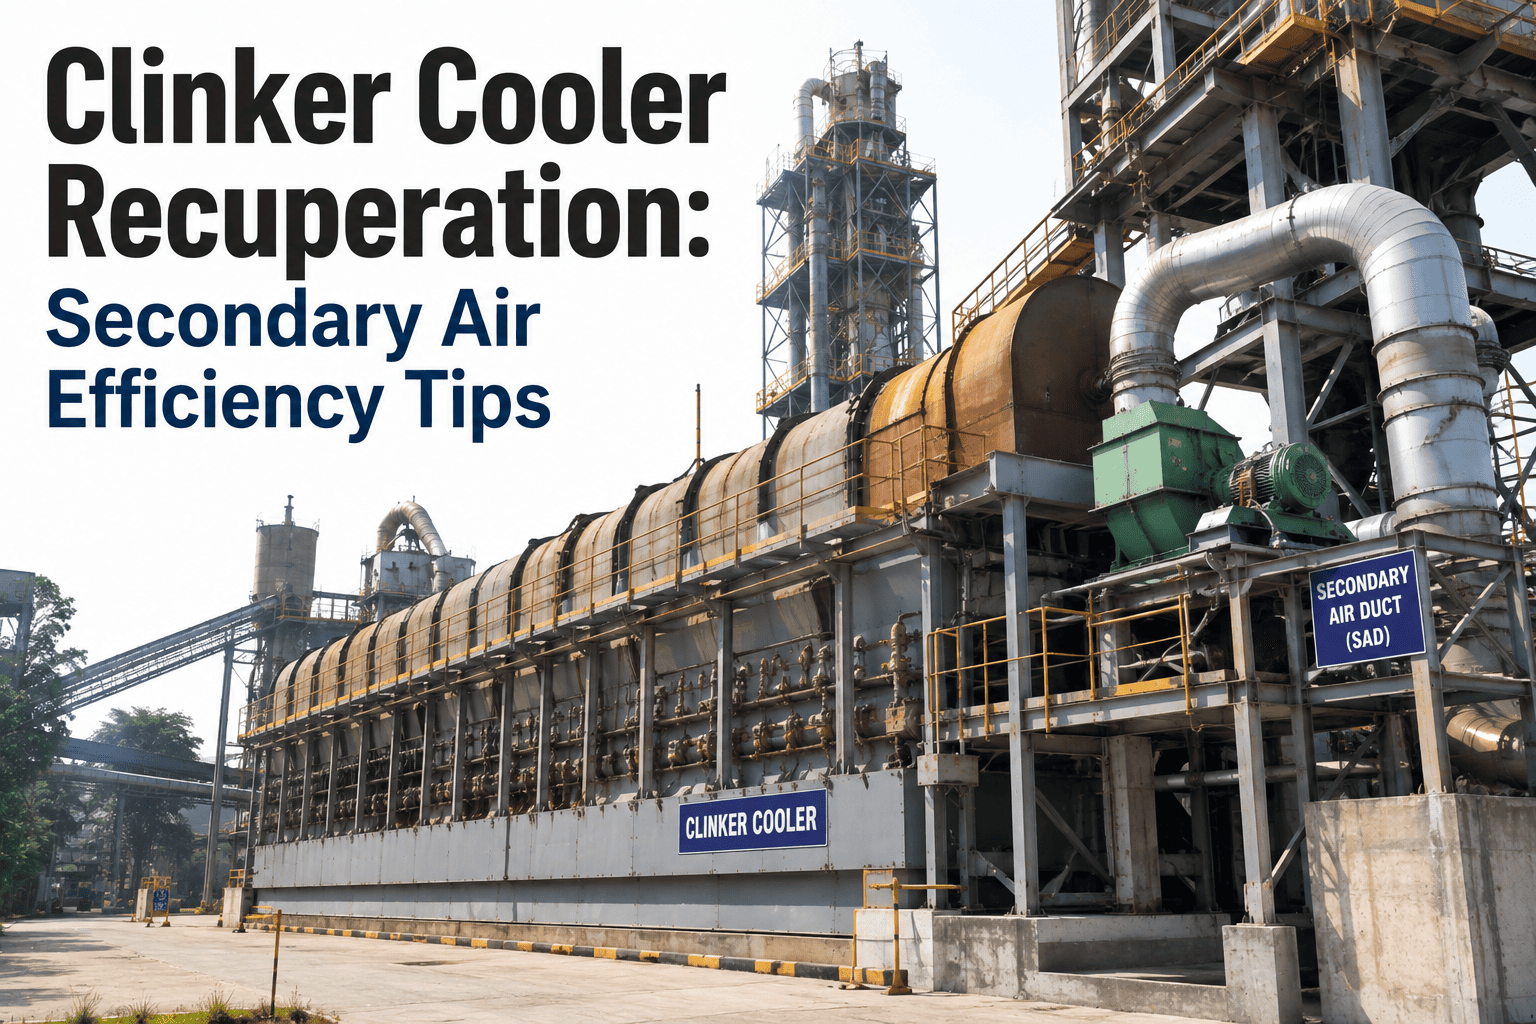
Clinker enters the cooler at roughly 1,400°C and needs to leave at close to ambient plus 65°C for downstream grinding and handling. Cooling air forced up through the bed absorbs that heat as it passes through, and what happens to that heated air next determines whether the plant just recovered free combustion energy or vented it to atmosphere. In a well-run system, the hottest air becomes secondary air feeding the kiln burner at around 1,050°C, a smaller but still substantial share becomes tertiary air feeding the calciner at 950°C or higher, and the remainder exits as cooler exhaust — air that still carries usable heat but at a temperature too low to feed combustion directly. The proportions below reflect a typical, well-tuned grate cooler air balance, and the width of that exhaust segment is exactly where most of the unclaimed efficiency in a cooler tends to hide — every percentage point that shifts from exhaust into secondary or tertiary air is fuel the kiln no longer has to burn to compensate.
The Fan Power You're Also Paying For
Heat recovery is only half of the cooler's energy story, and the other half rarely gets the same attention. Moving enough cooling air through the bed to take clinker from around 1,400°C down to near-ambient temperature takes somewhere around two cubic meters of air per kilogram of clinker at standard conditions, and pushing that volume through a resistant bed is what drives the roughly 7 kilowatt-hours per tonne that a full cooler fan system typically consumes. A bed that has drifted deeper than target, or grate plates that have worn unevenly, increases the resistance those fans are working against, which means the plant pays twice for the same underlying problem — once in lost heat recovery and again in higher electrical draw to force air through a bed that is harder to penetrate than it should be. Tracking fan power alongside air temperature is what turns a heat recovery conversation into a complete energy picture instead of half of one.
Why the First Two to Three Meters of the Grate Matter Most
Quench rate in the first section of the cooler is not just about heat recovery — it locks in the mineral structure that gives cement its strength. Clinker cooled quickly through this zone preserves the alite (C₃S) crystal structure that drives early and late strength development. Clinker that cools too slowly, because bed depth has drifted or airflow is uneven, allows C₃S to revert toward belite (C₂S), a permanent change that reduces cement reactivity no matter what happens downstream. That single fact is why cooler tuning is never purely an energy conversation for a process team — a cooler running efficiently for fuel savings is very often also the cooler protecting the plant's cement strength specification at the same time. This is worth stating plainly to any operations leader who has ever felt pressure to trade one metric for the other during a busy production period, because in this particular case the trade-off largely does not exist — the same bed depth control and airflow distribution that recovers the most heat is the same discipline that gives the clinker the fastest, most uniform quench.
| Cooler Zone | Primary Role | Key Parameter | Typical Target |
|---|---|---|---|
| Recuperation Zone (0–3m) | Rapid quench, locks C₃S crystal structure | Bed depth, under-grate pressure | 400–600mm uniform bed depth |
| Heat Recovery Zone | Generates secondary and tertiary air | Air temperature, grate speed | Secondary air ~1,050°C |
| After-Cooling Zone | Final clinker temperature reduction | Exhaust air flow, residence time | Discharge below ambient +65°C |
| Discharge & Crusher | Sizing for downstream handling | Clinker size distribution | Consistent grate plate wear pattern |
Four Signs Your Cooler Is Leaving Efficiency on the Table
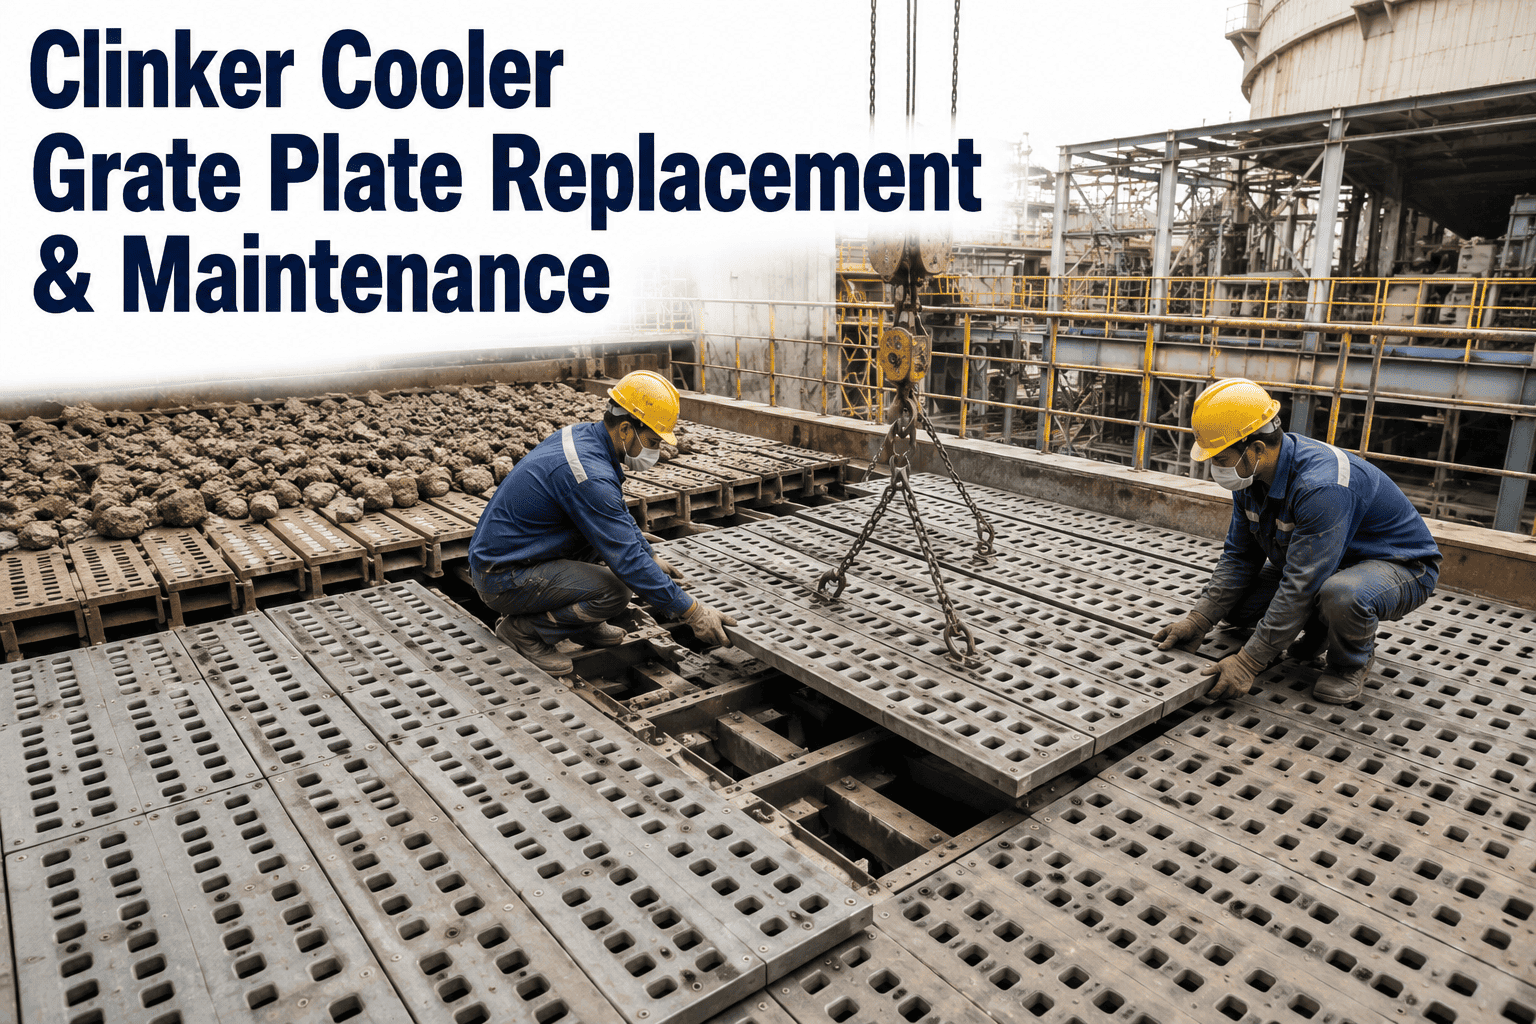
Because cooler losses build up gradually rather than announcing themselves with an alarm, most plants only notice once fuel consumption has already drifted upward over months. The four patterns below are the ones process engineers see most often, and each one has a distinct signature in operating data long before it becomes visible on a fuel invoice, and catching that signature early is almost always the difference between a routine grate plate replacement during a planned stop and an emergency repair that extends an outage no one budgeted for.
Red River Channeling
Hot clinker forms a visible glowing channel through gaps in an uneven bed, bypassing the cooling air entirely and wasting recoverable heat while accelerating localized grate plate damage.
Uneven Bed Depth Across Grate Width
Broken or missing grate plates and poor inlet distribution create hot zones on one side of the cooler and overcooled dead zones on the other, destabilizing under-grate pressure readings.
Declining Secondary Air Temperature
A gradual drop in secondary air temperature is one of the earliest measurable signs of cooler inefficiency, often traced back to air leakage, worn plates, or abnormal clinker sizing.
Rising Fan Power for the Same Throughput
When cooling fans draw more power to move the same air volume through the bed, it usually signals grate plate wear or blockage increasing resistance to airflow.
See What Your Own Cooler's Heat Balance Looks Like
iFactory pulls secondary air temperature, tertiary air temperature, under-grate pressure, and grate speed into one continuous model, showing exactly which zone is costing fuel and by how much.
What Closing the Gap Is Actually Worth
The numbers scale predictably with kiln size, which is what makes cooler optimization one of the more straightforward energy business cases in the plant to build. On a 5,000 tonne-per-day kiln line, closing a typical efficiency gap translates into three to eight kilograms less coal burned per tonne of clinker and two to five kilowatt-hours less electricity per tonne from more efficient fan operation. Raising tertiary air temperature by as little as 50°C has a measurable effect on calciner fuel demand on its own. Multiplied across a full year of production, that is not a rounding error on the fuel budget — it is frequently one of the largest single energy-efficiency opportunities available anywhere in the pyroprocessing system, and unlike a capital equipment upgrade, most of the gap can be closed through better control and monitoring of equipment the plant already owns. That distinction matters most to plant managers building an annual budget, because the business case for cooler optimization rarely competes against other capital projects for approval — it competes against doing nothing, and doing nothing has a fuel cost attached to it every single day the imbalance goes uncorrected.
Why Manual Control Loops Struggle to Hold the Gains
Most coolers today are managed by single-loop PID control, where grate speed responds to under-grate pressure in one compartment while fan speeds run largely fixed. That approach works reasonably well when kiln operation is stable, but a single pressure reading can mask wide variation across the width of the grate, and an operator correcting one zone based on that reading can unintentionally worsen conditions in another. Bed depth, fan air distribution, and grate speed all interact continuously with secondary air temperature and kiln draft, which is exactly the kind of multi-variable, constantly shifting relationship that isolated control loops were never designed to coordinate. This is the core reason cooler efficiency tends to drift over time even when nothing on the equipment has visibly failed — the control strategy simply cannot see the whole picture at once. It also explains why two coolers of identical design, running on identical kilns, can post noticeably different fuel-per-tonne numbers purely based on how disciplined the operating team has been about catching drift between scheduled reviews rather than any real difference in the equipment itself.
| Approach | What It Optimizes | Where It Falls Short |
|---|---|---|
| Single-Loop PID Control | Grate speed against one under-grate pressure reading | Blind to variation across grate width and interacting zones |
| Periodic Manual Tuning | Corrects drift when an engineer reviews trend data | Days to weeks between adjustments while fuel cost accumulates |
| Continuous AI Heat Balance Modeling | Bed depth, fan distribution, and grate speed as one coordinated system | Requires reliable sensor coverage and a validated baseline to start from |
Bringing Continuous Heat Balance Monitoring Onto an Existing Cooler
None of this requires replacing the cooler or the existing control system. It requires connecting the sensor data that already exists — under-grate pressure, fan current, secondary and tertiary air temperature, clinker discharge temperature — into a model that can see all of it at once and hold a consistent baseline over time. Most plants already have the majority of these instruments installed for basic process control; what is usually missing is the layer that correlates them continuously and translates a drifting reading into an operator-actionable recommendation before the drift compounds.
Establish the Heat Balance Baseline
Current secondary air, tertiary air, exhaust temperature, and fan power are logged across several full production cycles to establish what normal actually looks like on this specific cooler.
Map Bed Depth and Grate Zones
Under-grate pressure readings across each compartment are correlated with bed depth and airflow distribution to identify which zones are already running efficiently and which are not.
Model Fuel Impact in Real Time
Every shift in secondary or tertiary air temperature is translated directly into an estimated fuel cost impact, so operators see the financial consequence of a drifting setpoint, not just a temperature number.
Recommend and Track Setpoint Changes
Grate speed and fan distribution recommendations are generated continuously, and the resulting fuel savings are tracked against the original baseline to confirm the gains are holding.
Clinker Cooler Efficiency and Heat Recovery — Frequently Asked Questions
What is a realistic secondary air temperature target for a well-run cooler?
Most well-tuned grate coolers hold secondary air temperature around 1,050°C feeding the kiln burner, though the exact achievable number depends on clinker throughput, cooler design, and ambient conditions at the plant. A temperature that has drifted meaningfully below your own historical baseline, even if it still looks reasonable in isolation, is usually a more useful signal than comparing against a generic industry number. Teams that want that baseline tracked automatically can contact support to see how it is set up.
How is red river formation different from ordinary uneven bed depth?
Uneven bed depth is a gradual imbalance across the grate width, while red river formation is a more acute condition where hot clinker channels through a gap and largely bypasses the cooling air altogether. Red river is usually visible as a distinct glowing streak during a shutdown inspection and tends to accelerate rapidly once it starts, because the channel itself further erodes the grate plates around it and widens over time.
Does optimizing the cooler for fuel savings risk clinker quality?
When done correctly, the opposite is usually true. The rapid quench in the first section of the grate that preserves the alite crystal structure responsible for cement strength is the same condition that maximizes heat recovery into secondary air, so a cooler tuned for efficient heat recovery is generally also protecting clinker quality rather than trading one for the other.
How much can cooler optimization actually save on fuel cost?
Industry benchmarking generally puts the swing between a well-tuned and a poorly controlled cooler at five to eight percent of kiln fuel consumption, which on a mid-size kiln line translates into a substantial annual figure once multiplied across a full year of production. Plants that want a number specific to their own kiln size and current cooler performance can book a demo and review the math against their own operating data.
Why does a single under-grate pressure reading fail to catch these problems?
A single pressure sensor reports one point average across a grate that can be several meters wide, and it is entirely possible for one section to run hot and unstable while another runs overcooled, with the two effects partially canceling out in the average reading an operator actually sees. That is precisely why isolated single-loop control tends to miss developing imbalance until it has already become visible as a fuel or quality problem.
Turn Recovered Heat Into a Measured Fuel Savings Number
iFactory's AI platform gives cement process teams continuous visibility into cooler heat balance, secondary and tertiary air temperature, and bed depth condition, converting a slow efficiency drift into a scheduled correction instead of a rising fuel bill.