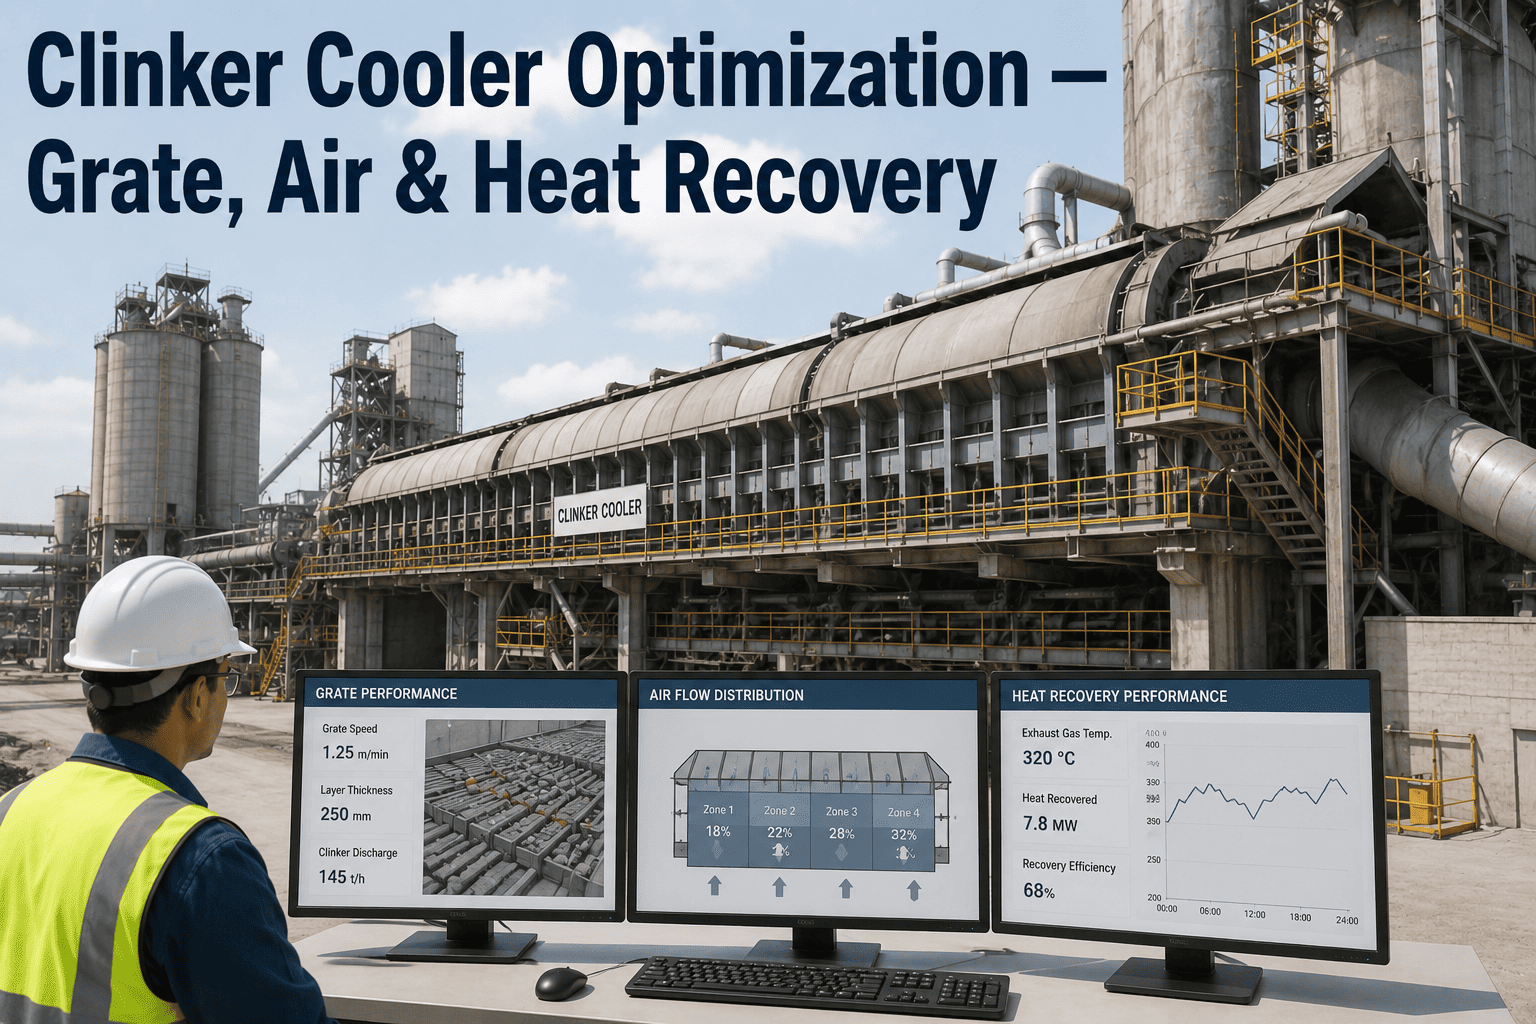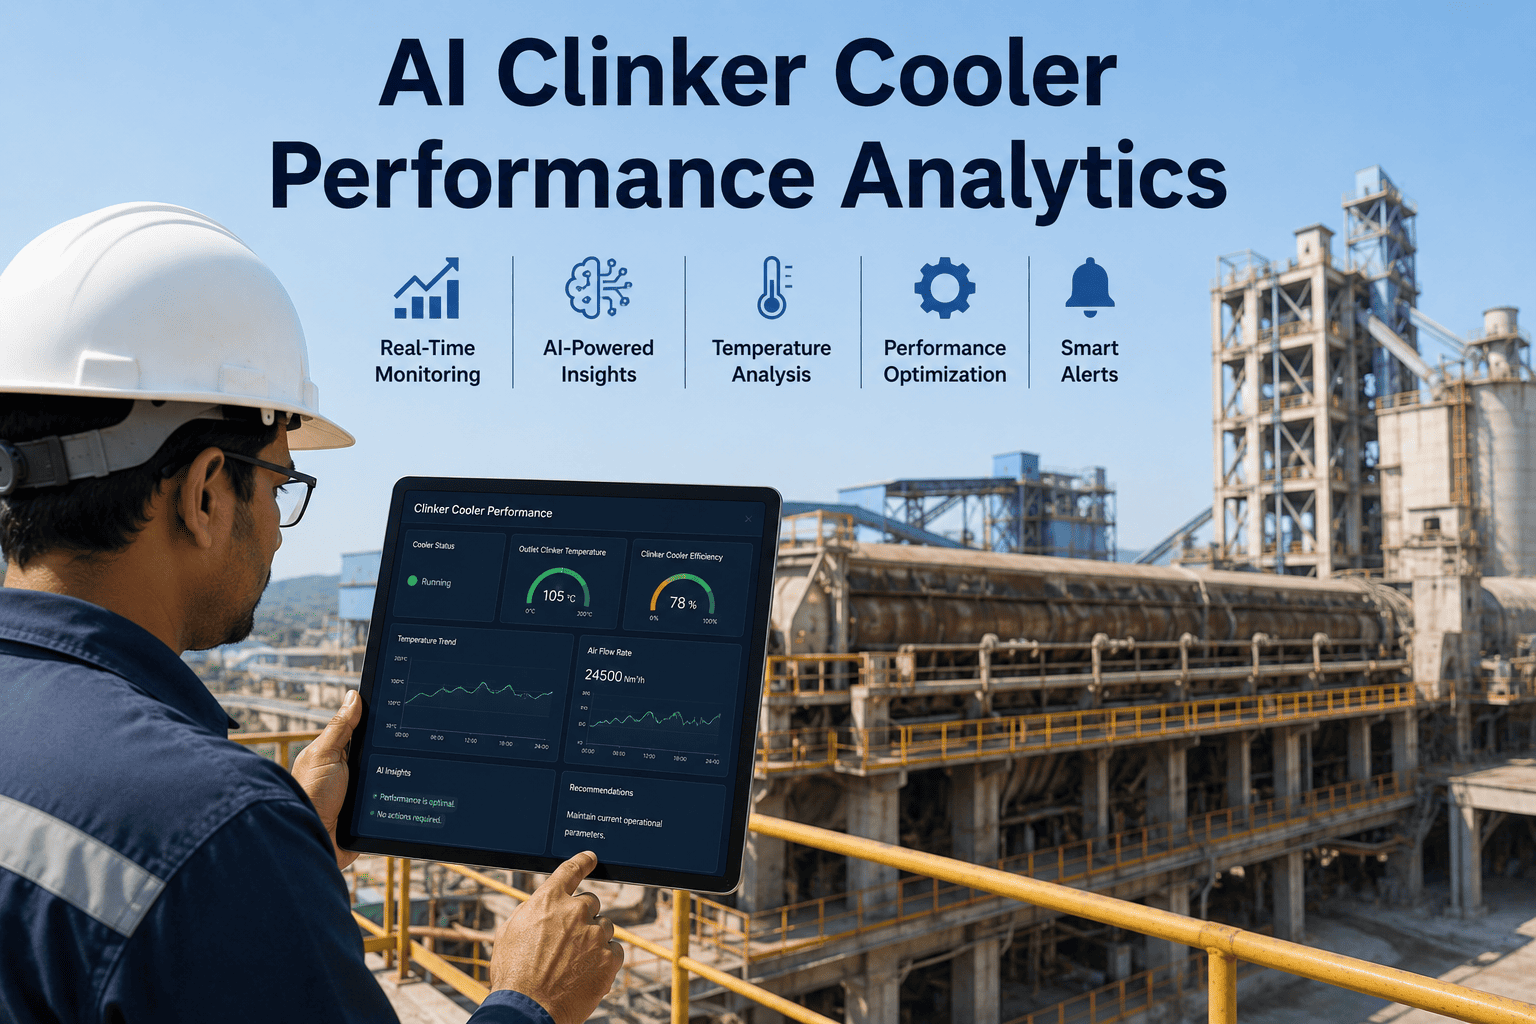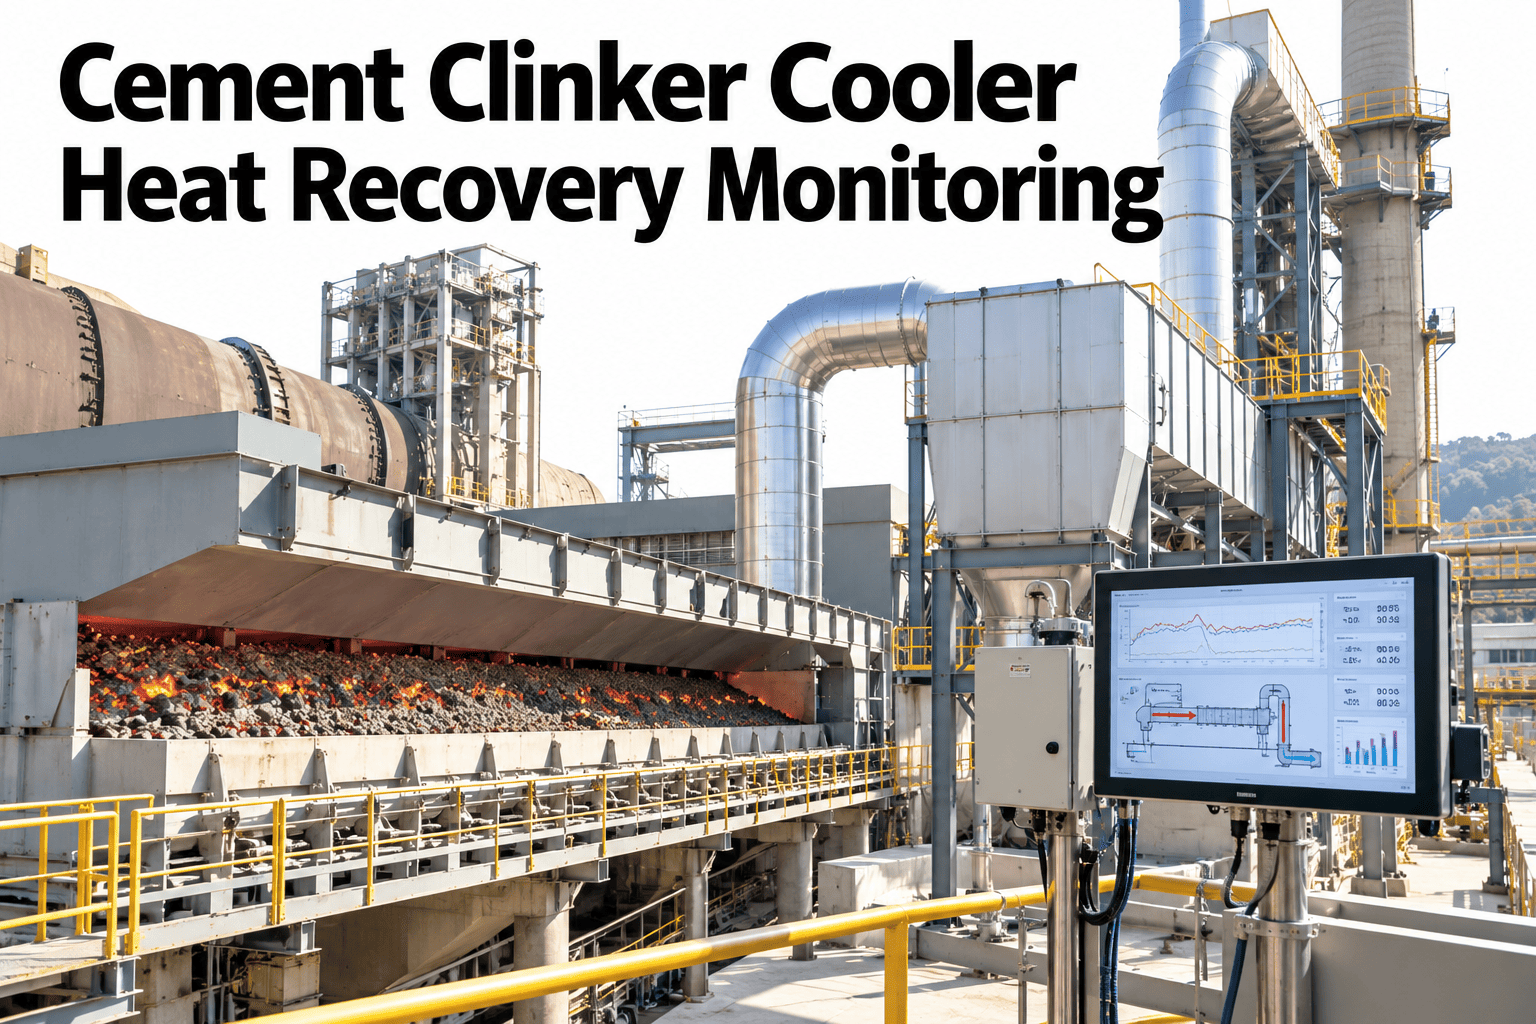
The clinker cooler sits at an awkward spot in most plants' monitoring setup, important enough that a major failure gets noticed immediately, but routine enough that gradual efficiency loss in fan performance or grate operation rarely gets the same attention as the kiln itself. A cooler losing a few percentage points of heat recovery efficiency doesn't trip an alarm, it just quietly sends more heat to atmosphere that could have preheated combustion air or fed a waste heat recovery system instead. Tracking cooler operating indicators and heat recovery metrics continuously, not just reviewing them during a scheduled inspection, is what catches that kind of drift early, and if you want to see this kind of tracking applied to your own cooler data, you can review a sample cooler performance trend with our team.
Catch Clinker Cooler Efficiency Loss Before It Becomes Routine
Continuous tracking of cooler operating indicators, heat recovery metrics, and fan and grate data, so a gradual efficiency drift gets caught instead of quietly becoming the new normal.
The Core Operating Indicators Behind Cooler Performance
A handful of continuously tracked indicators give a clear picture of whether the cooler is operating at its design potential or has started to drift.
Heat Recovery Metrics That Matter Most
Raw temperature readings alone don't tell you how efficiently heat is actually being recovered, which is why a few calculated metrics matter more than any single sensor value.
| Metric | What it measures | Typical warning sign |
|---|---|---|
| Heat recovery efficiency | Share of clinker heat recovered into secondary and tertiary air | Gradual decline at consistent throughput |
| Specific cooling air rate | Cooling air volume per unit of clinker produced | Rising trend suggesting declining fan or grate efficiency |
| Clinker temperature differential | Difference between kiln discharge and cooler outlet temperature | Narrowing differential indicating reduced cooling effectiveness |
| Red river frequency | How often hot clinker visibly passes through without adequate cooling | Increasing frequency pointing to grate or distribution issues |
Tracking these together, rather than any single reading in isolation, is what separates a genuine cooler performance issue from normal day-to-day operating variation.
Why Fan and Grate Data Deserve Their Own Dedicated View
Heat recovery efficiency can decline for reasons that trace specifically to either the fan system or the grate mechanism, and separating the two speeds up the investigation considerably.
Check Your Own Cooler's Recovery Trend
Share a recent period of cooler and fan data and we will show where your cooler's efficiency currently stands.
Watching Temperature Trends Over Time, Not Just Day to Day
A single day's reading rarely reveals much, but tracking the trend across weeks is where genuine cooler drift becomes visible against normal operating noise.
A gradual rise in outlet temperature like this one, spread across weeks rather than appearing suddenly, is exactly the kind of pattern a weekly trend view catches well before it would trigger any standard alarm threshold.
Building an Event Log That Supports Future Investigation
A structured event log turns every anomaly into a searchable record instead of institutional memory that fades once the shift ends.
What iFactory Cement and Energy Specialists See on Cooler Performance
iFactory cement and energy specialists who review clinker cooler data across multiple plants find that grate-related efficiency loss tends to develop more gradually and is more often missed than fan issues, since a struggling fan usually shows up in motor load data before it affects recovery efficiency noticeably.
They recommend reviewing the heat recovery efficiency trend weekly specifically because of this gradual pattern, since catching it within a few weeks typically means a smaller, planned maintenance fix rather than a larger intervention once the drift has compounded.
What Plant Teams Ask About Cooler Performance Monitoring
Bring Heat Recovery Monitoring to Your Clinker Cooler
Book a session with iFactory AI to track cooler operating indicators and heat recovery metrics against your own baseline.