The clinker cooler is where a cement plant either recovers most of its thermal energy or loses it permanently to the stack, and the difference between a well-tuned cooler and a poorly controlled one can swing kiln fuel consumption by 5 to 8 percent. Grate speed, cooling air distribution, and clinker bed depth all interact in ways that are difficult for operators to optimize manually, especially as clinker mineralogy shifts with raw mix changes or as grate plates wear unevenly over years of service. iFactory's AI Analytics module continuously models cooler thermal efficiency, recommends grate speed and air distribution adjustments in real time, and flags developing mechanical issues before they cause a cooler stoppage. Most plants running manual cooler control are leaving recoverable heat on the table every single day without a clear way to see it. Book a Demo to see your cooler's efficiency gap quantified.
CLINKER COOLER · THERMAL EFFICIENCY · AI OPTIMIZATION
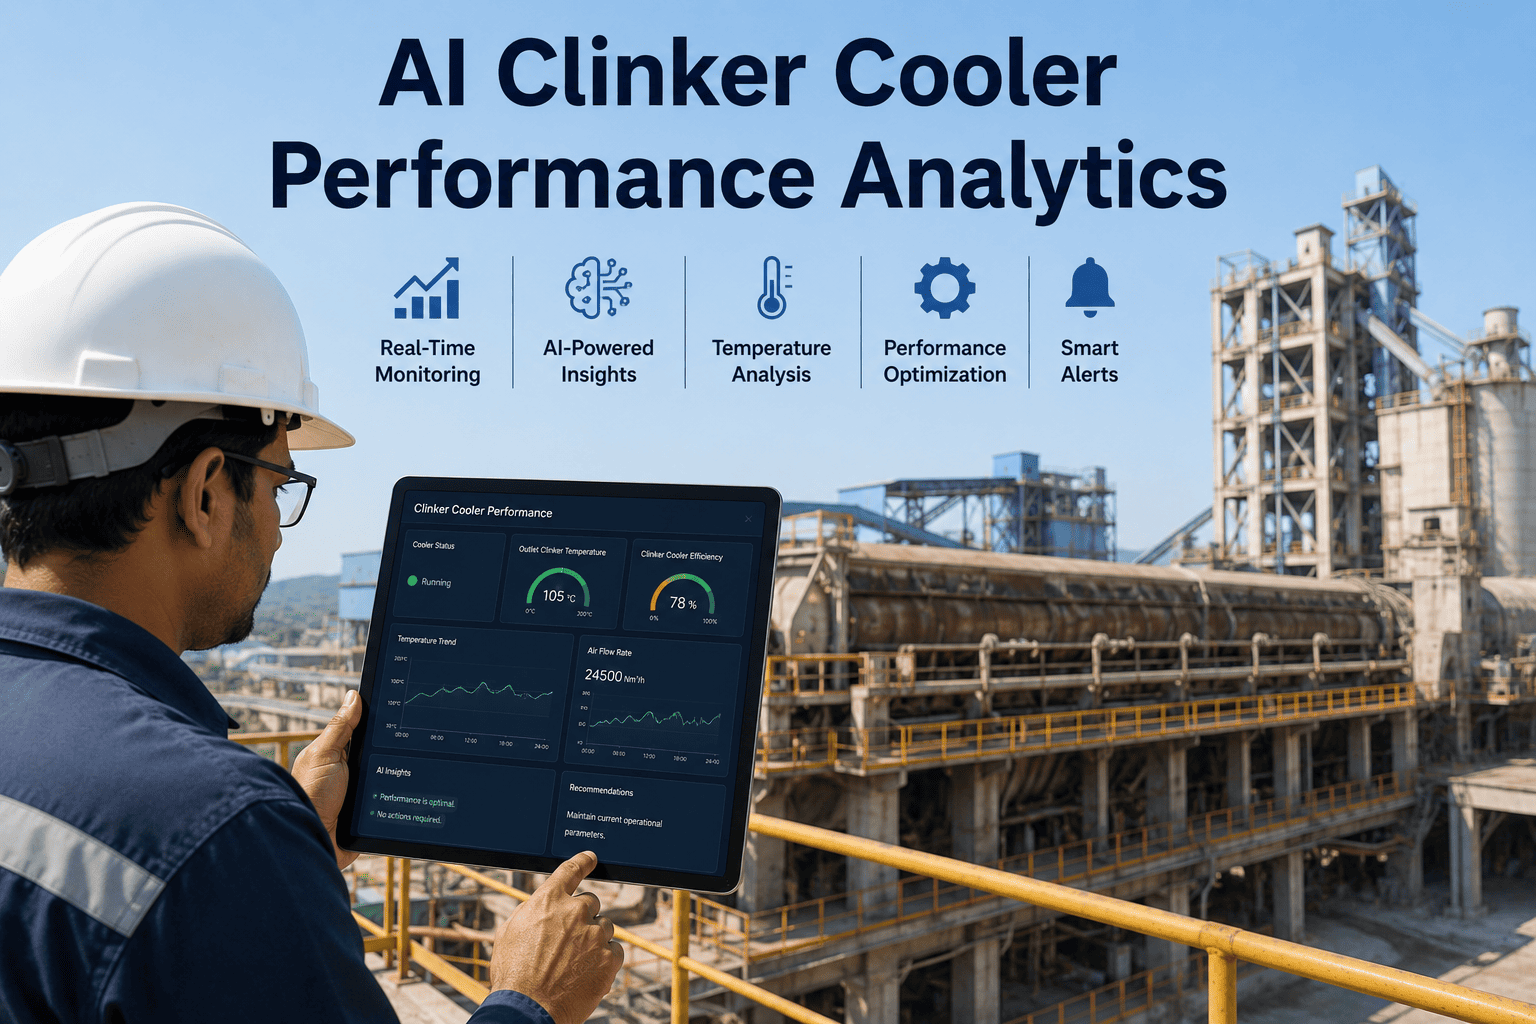
Recover the Heat Your Clinker Cooler Is Currently Losing
AI-driven clinker cooler analytics continuously optimize grate speed and cooling air distribution to reduce heat loss, stabilize secondary air temperature to the kiln, and extend grate plate life — all without changing your existing cooler hardware.
Live Cooler Efficiency Snapshot
Secondary Air Temp Stability
92%
Clinker Discharge Temp Control
88%
Cooling Air Distribution Balance
85%
Grate Plate Wear Prediction Accuracy
94%
Why Clinker Coolers Are Chronically Under-Optimized
Manual Grate Speed Adjustments Lag Real Conditions
Operators typically adjust grate speed reactively based on clinker bed appearance and discharge temperature readings, a process that responds only after inefficiency has already occurred rather than preventing it.
Cooling Air Distribution Is Rarely Rebalanced
As grate plates wear unevenly across cooler zones, air distribution drifts from its design intent, but rebalancing requires manual damper adjustments that are often deprioritized against other plant issues.
Secondary Air Temperature Swings Destabilize the Kiln
Unstable secondary air temperature entering the kiln forces burner and fuel adjustments elsewhere in the process, creating a ripple effect of instability that traces back to cooler control quality.
Grate Plate Wear Goes Undetected Until Failure
Grate plate cracking and wear typically surface only during a planned shutdown inspection, meaning a plant can run for months with degraded cooling performance before the root cause is identified.
What Is Your Cooler's Efficiency Gap Costing You?
A short review of your cooler's operating data against AI-optimized benchmarks shows the fuel savings and grate plate life extension available without hardware changes.
Core Capabilities of the AI Clinker Cooler Analytics Module
Capability 1
Real-Time Grate Speed Optimization
AI continuously recommends grate speed adjustments based on clinker bed depth estimation, discharge temperature trends, and kiln production rate, maintaining optimal bed depth across all grate zones.
Cooling Air Distribution Modeling
Capability 2
A thermal model of the cooler identifies zones receiving excess or insufficient cooling air, recommending damper adjustments that rebalance airflow and reduce localized overheating.
Capability 3
Secondary Air Temperature Stabilization
Predictive control coordinates cooler operation with kiln firing conditions to stabilize secondary air temperature, reducing downstream burner adjustments and fuel consumption variability.
Capability 4
Grate Plate Wear Prediction
Machine learning models trained on temperature patterns, air pressure differentials, and maintenance history predict grate plate wear progression, enabling planned replacement during scheduled outages.
Capability 5
Heat Recovery and Fuel Impact Reporting
Continuous calculation of recovered heat contribution to kiln fuel savings, with daily and monthly reporting that ties cooler performance directly to fuel cost outcomes.
Capability 6
Cooler Stoppage Risk Alerts
Anomaly detection on grate drive load, undergrate pressure, and clinker flow identifies conditions that historically preceded cooler stoppages, giving operators time to intervene proactively.
Manual Cooler Control vs. AI-Optimized Cooler Control
Implementation Path
Step 1
Sensor and Historian Integration
Connect existing cooler temperature, pressure, and grate speed sensors along with the plant historian. Typically 2 to 3 weeks.
Step 2
Thermal Model Calibration
Build and validate the cooler-specific thermal model against 6 to 12 months of historical operating data. Typically 3 to 4 weeks.
Step 3
Advisory Mode Go-Live
Operators receive AI grate speed and air distribution recommendations on the control room console during a supervised parallel run.
Step 4
Continuous Model Refinement
Models retrain on new operating data monthly, adapting to seasonal conditions, raw mix changes, and grate plate wear progression.
Quantify Your Cooler's Recoverable Heat
iFactory's AI Analytics module connects to your existing cooler instrumentation with no hardware changes required. Book a demo to see the platform modeled against your own cooler's operating history.
Built for Every Cooler Configuration
Clinker cooler design varies significantly across plants built in different eras, and the AI thermal model is calibrated to the specific mechanical behavior of each configuration rather than applying a generic optimization.
Reciprocating Grate Coolers
The most common modern configuration, where the model optimizes stroke frequency and undergrate air distribution across each grate zone independently.
Walking Floor Coolers
Bed movement dynamics differ from reciprocating grates, and the thermal model accounts for the distinct clinker transport pattern these coolers produce.
Rotary and Satellite Coolers
Older plants running rotary or satellite coolers benefit from air distribution and rotation speed recommendations tuned to these legacy mechanical designs.
Multi-Zone High-Efficiency Coolers
Newer high-efficiency coolers with multiple independently controlled cooling zones see the largest optimization gains, since the AI can coordinate zone-level adjustments that are impractical to manage manually.
Frequently Asked Questions
How does AI improve clinker cooler efficiency without changing hardware?
The AI model analyzes existing sensor data — grate speed, undergrate pressure, discharge temperature, and cooling fan flow — to identify the optimal combination of settings for current operating conditions, then delivers those recommendations to the control room console. Because the optimization works within the cooler's existing mechanical capabilities, no new dampers, grates, or fans are required. The gains come from consistently operating closer to the cooler's theoretical efficiency limit rather than the wider variability typical of manual control.
Book a demo to see this applied to your cooler configuration.
Can this platform predict grate plate failures before they happen?
Yes, the platform's wear prediction model uses temperature distribution patterns, air pressure differentials across grate zones, and historical maintenance records to estimate grate plate wear progression over time. This allows maintenance planning to schedule grate plate replacement during a planned outage rather than reacting to an unplanned failure that halts cooler operation and forces a kiln stoppage.
How does cooler performance affect kiln fuel consumption specifically?
The clinker cooler recovers hot air from the cooling clinker bed and returns it to the kiln as secondary and tertiary combustion air. When the cooler runs inefficiently, less heat is recovered, forcing the kiln to burn additional fuel to reach the same clinkering temperature. Stabilizing secondary air temperature through AI-optimized grate speed and air distribution directly reduces this fuel penalty, which is why cooler optimization is one of the highest-leverage efficiency improvements available in the pyroprocessing system.
What data does the platform need from our plant to get started?
The platform requires read-only access to existing cooler instrumentation including grate speed signals, undergrate pressure sensors, clinker discharge and secondary air temperature readings, and cooling fan data, typically pulled from the plant historian or DCS. Six to twelve months of historical data is used to calibrate the thermal model before advisory recommendations go live.
Contact support to review what's available at your plant.
What kind of fuel savings can we realistically expect?
Documented outcomes from comparable cooler optimization deployments show kiln fuel consumption reductions in the range of 3 to 5 percent, driven primarily by more stable secondary air temperature and reduced heat loss through the cooler stack. The exact savings depend on the plant's current cooler control maturity, clinker mineralogy variability, and grate plate condition, which is why an initial data review is used to set realistic, plant-specific expectations before deployment.