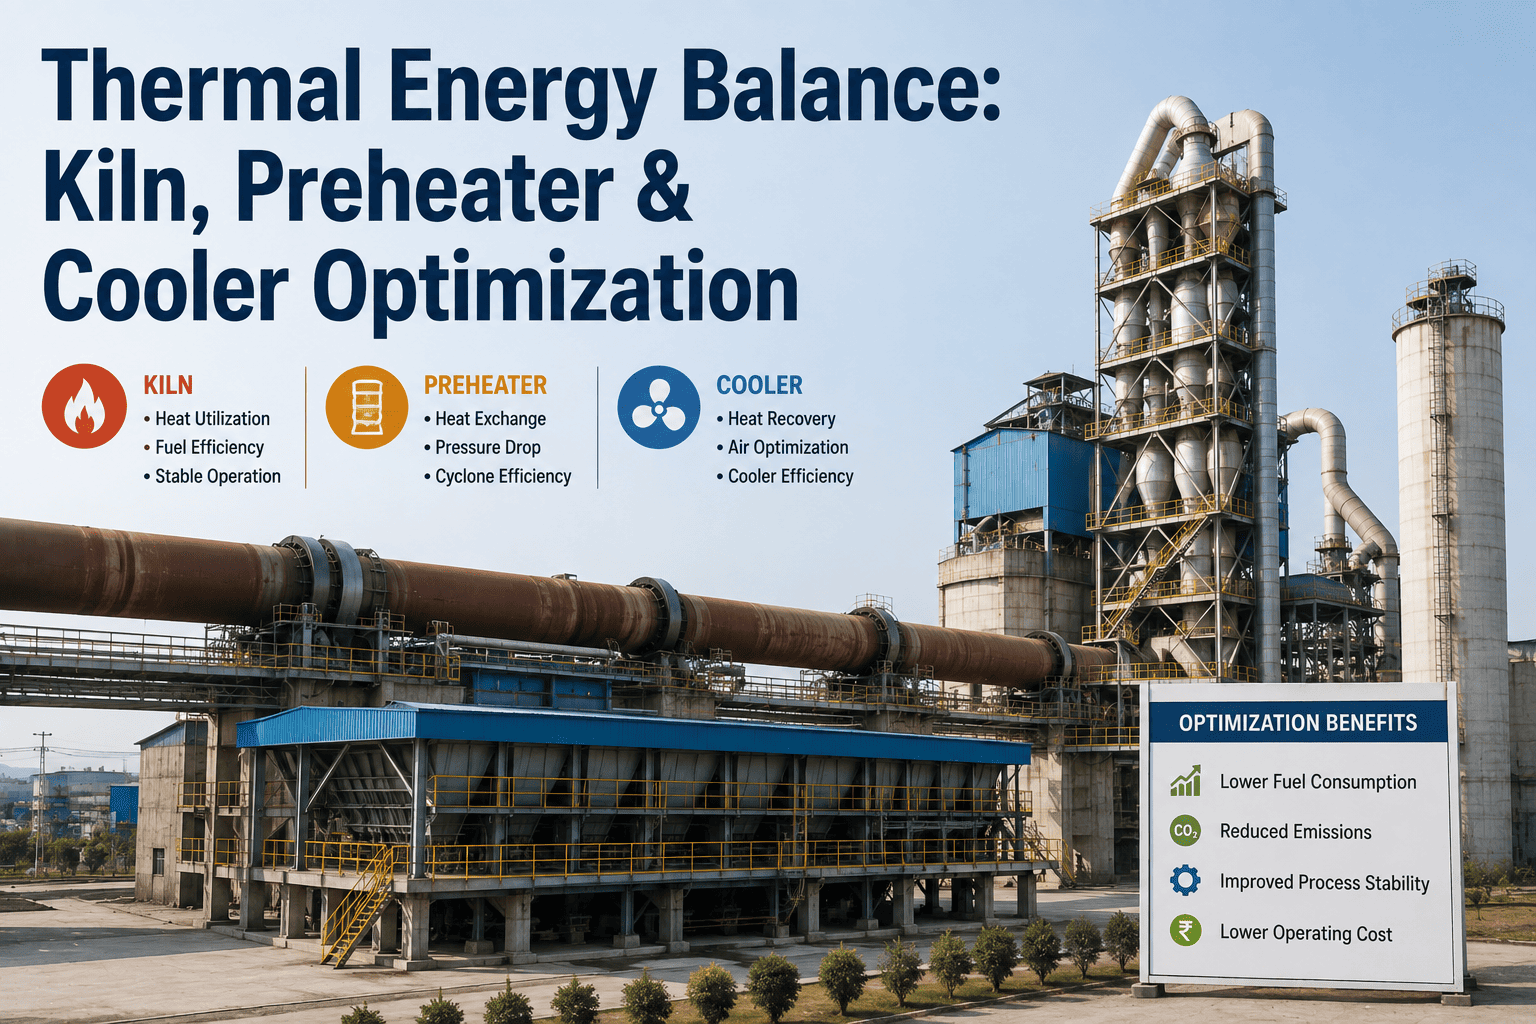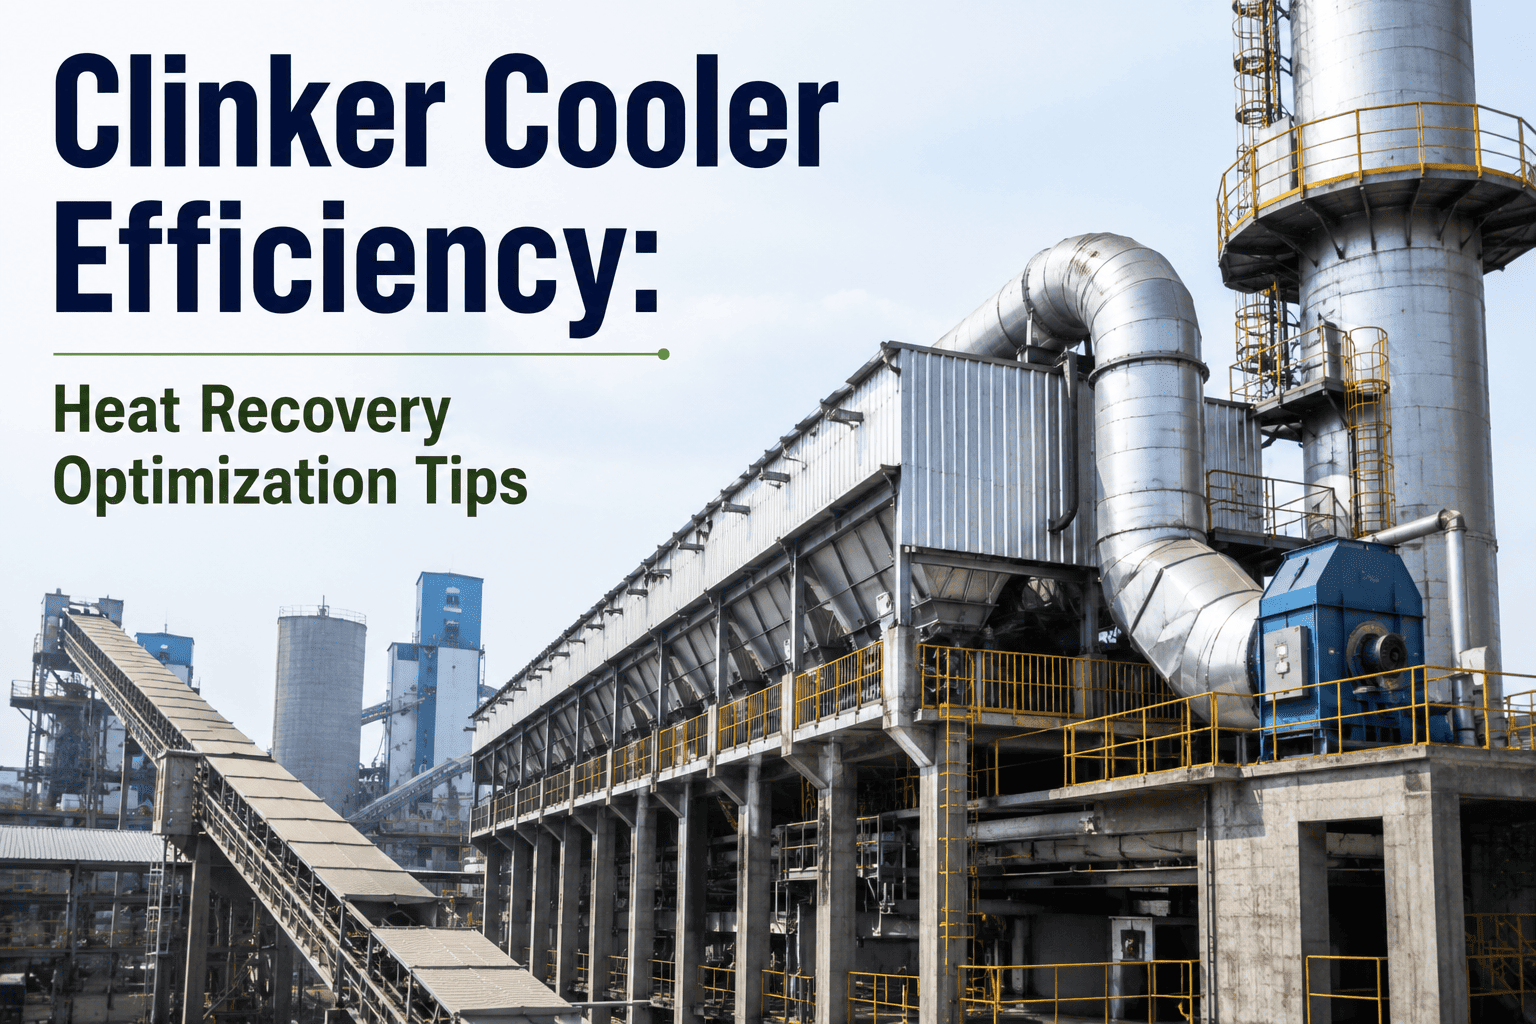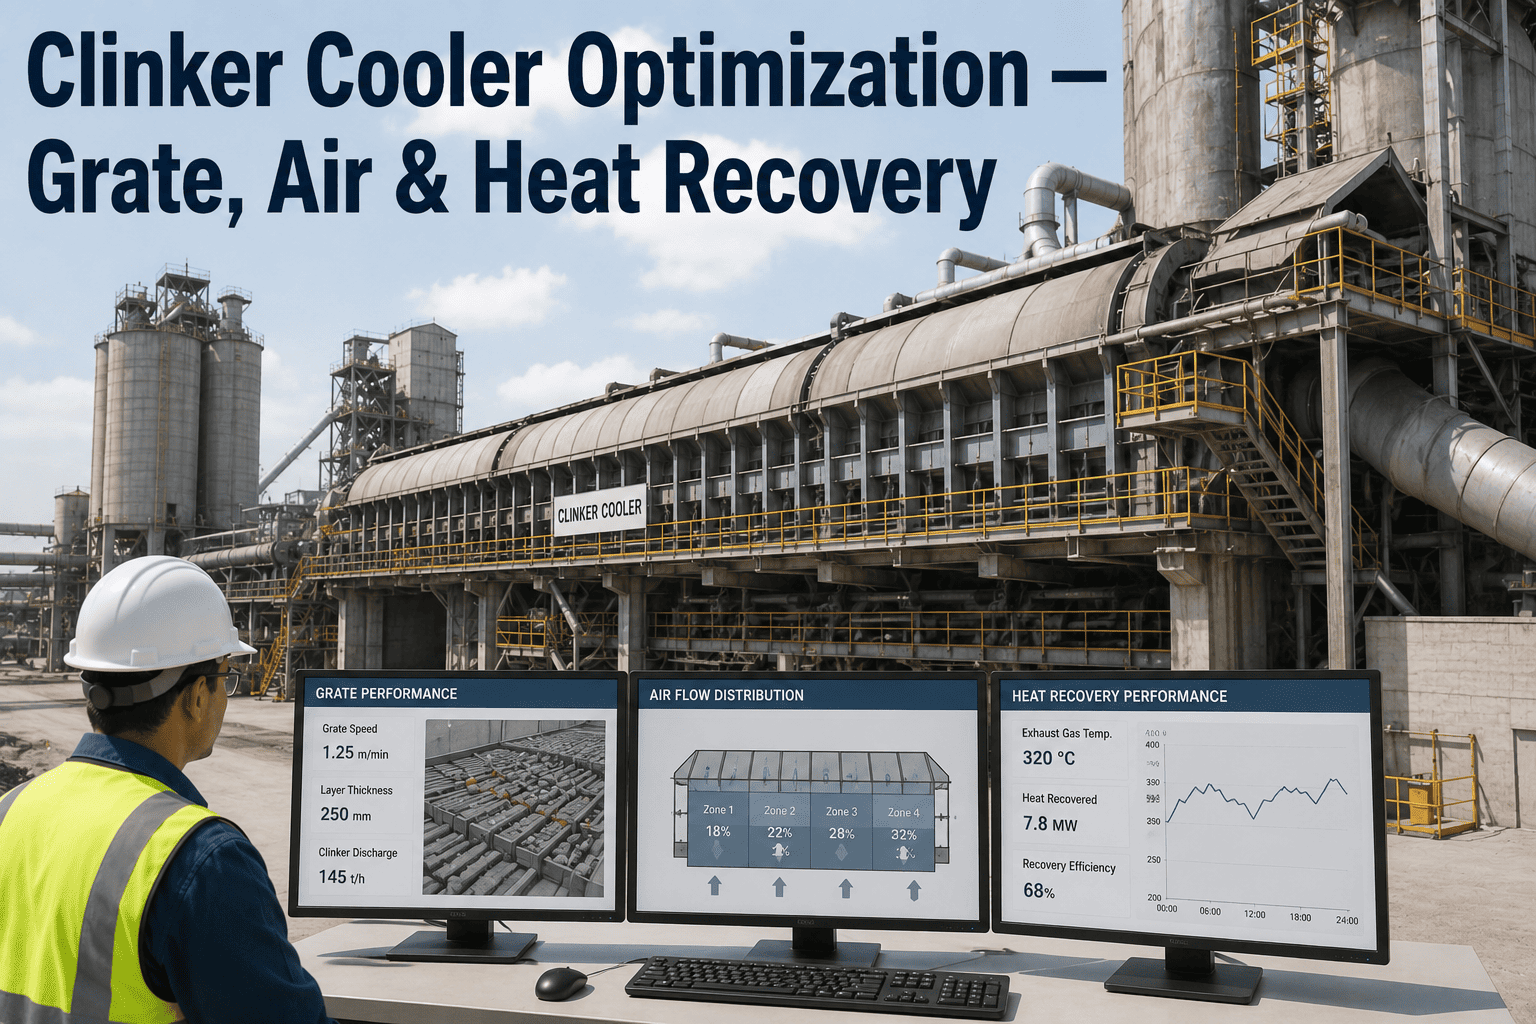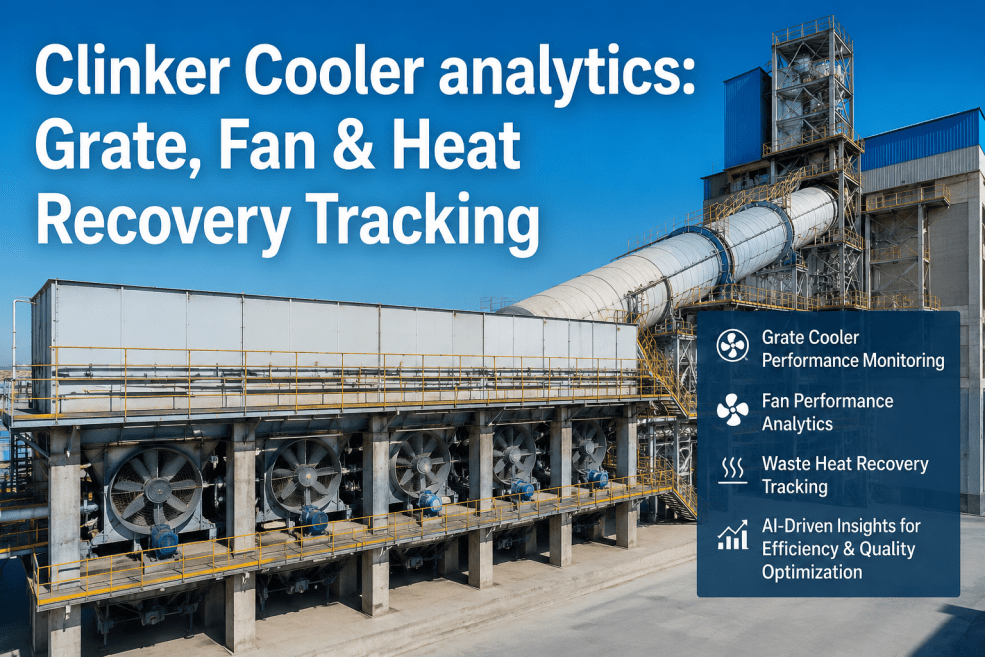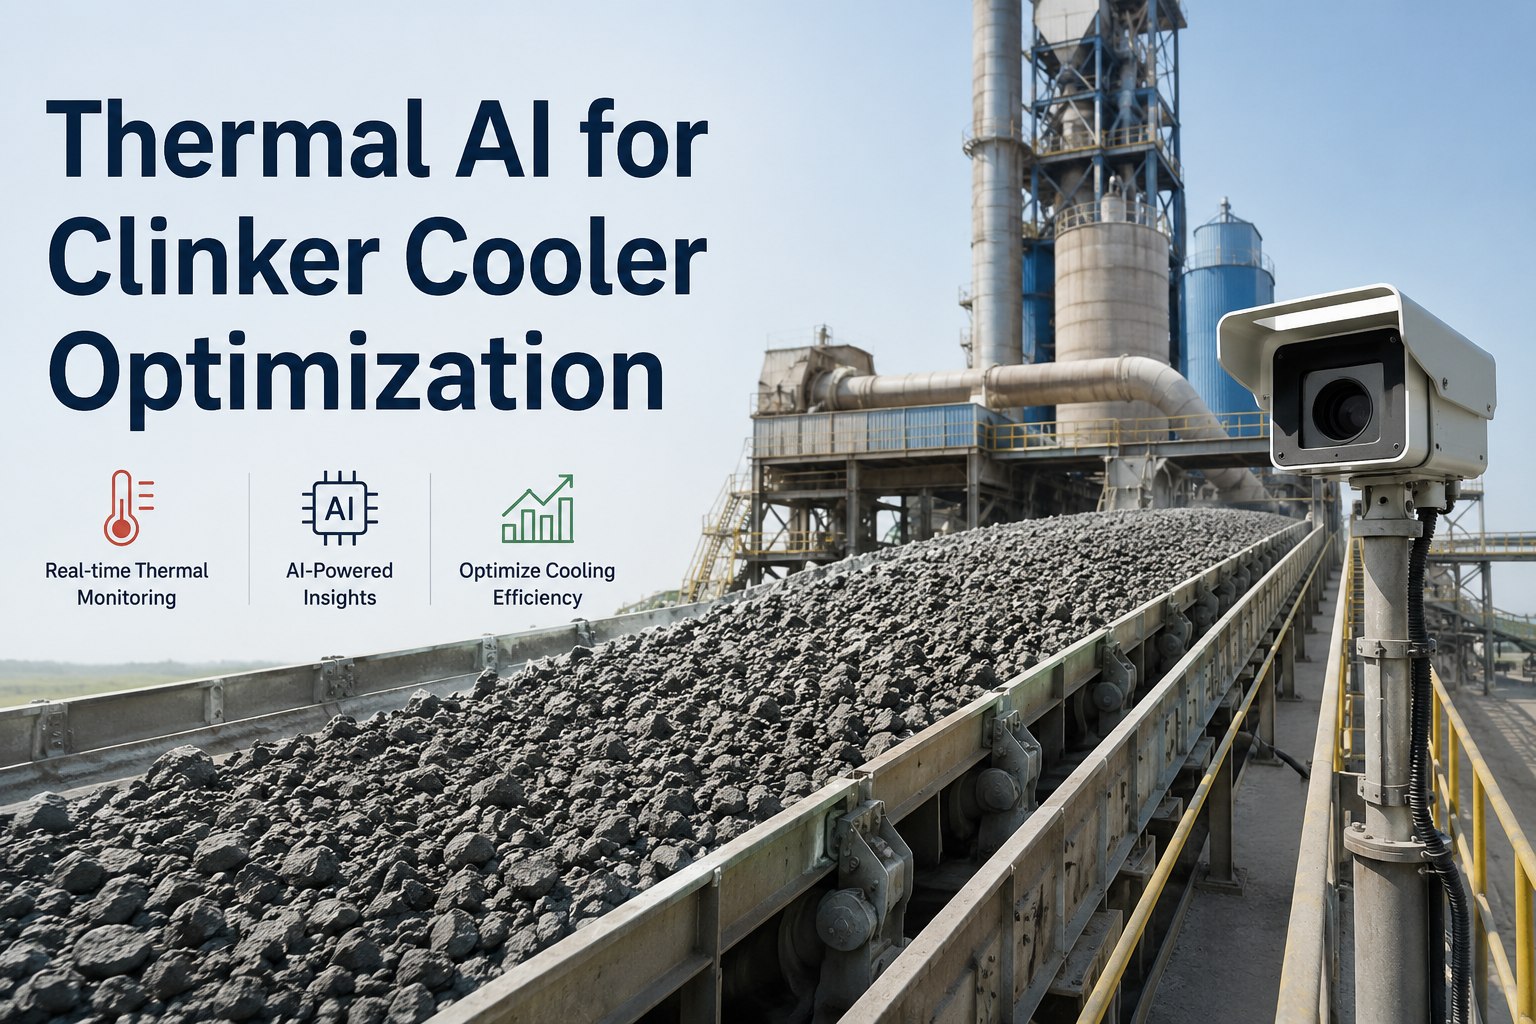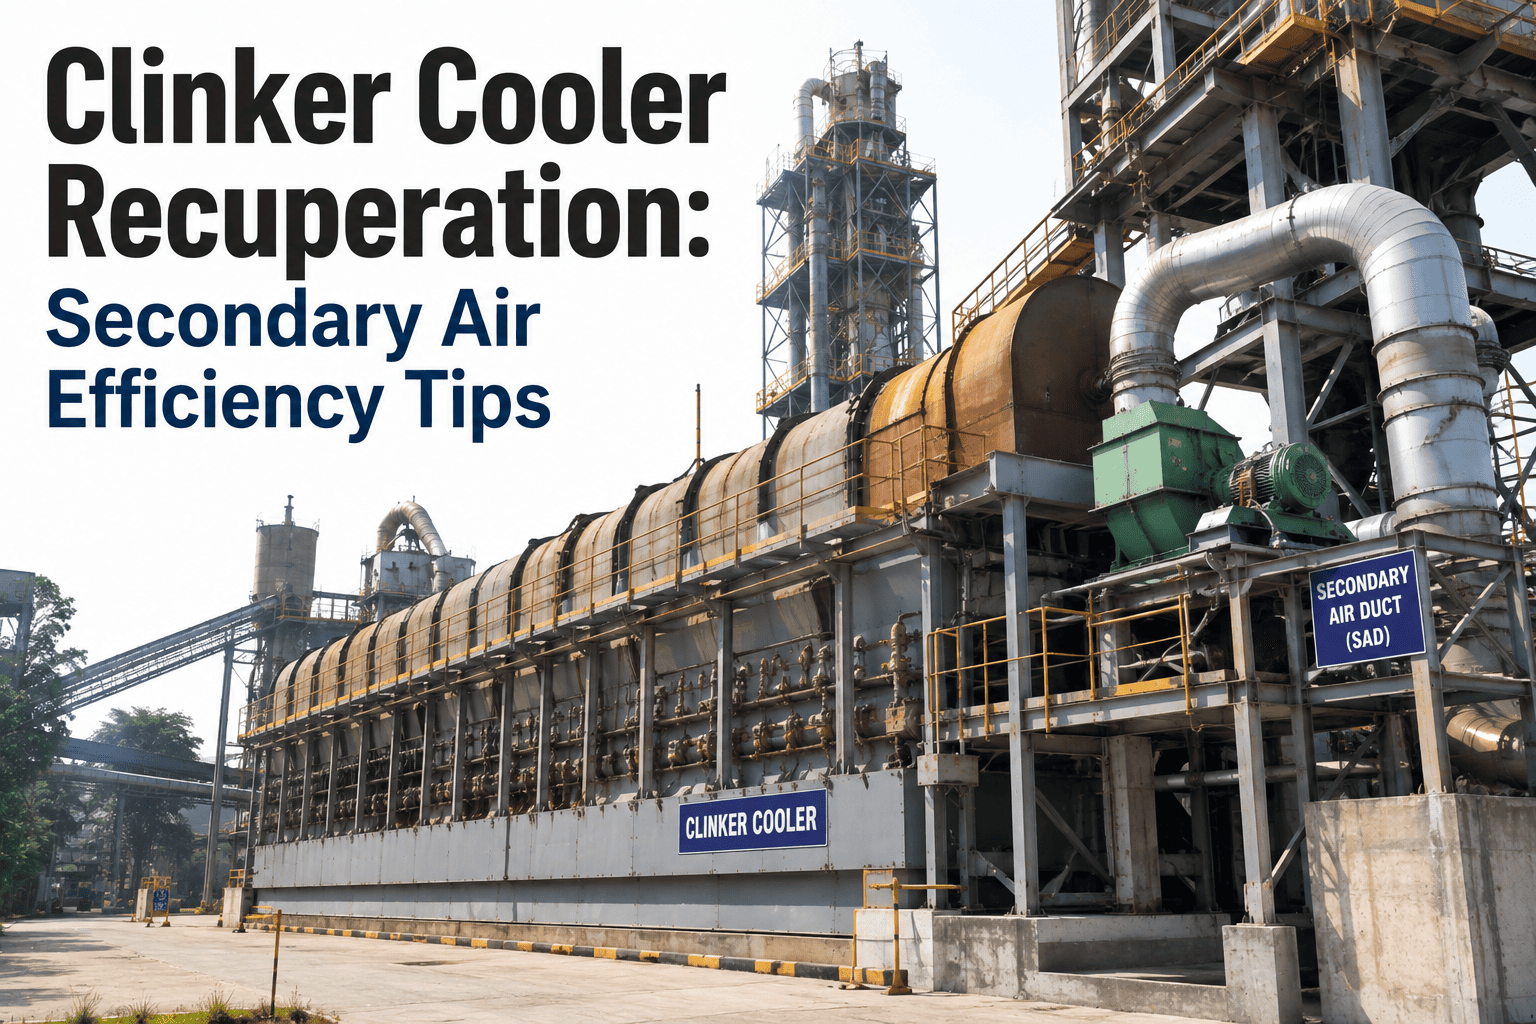
A clinker cooler that is running "fine" and a clinker cooler that is actually recovering the heat it should are two very different machines, and most plants only discover the gap between them after a kiln audit flags fuel consumption that never quite matches the numbers on paper. Secondary air temperature is the single clearest signal of that gap, because every degree lost at the cooler is a degree the kiln has to make up for with additional fuel, yet grate speed, cooling air distribution, and under-grate pressure are usually tuned once at commissioning and rarely revisited unless something breaks. Recuperation efficiency is not a fixed property of the cooler design, it is a moving target shaped by clinker bed depth, ambient air conditions, and how consistently the grate is operated shift after shift. See how a live recuperation view changes that at ifactory support.
Every Lost Degree of Secondary Air Is Fuel You Already Paid For
See recuperation efficiency, grate operation, and under-grate pressure as one connected picture instead of three separate readings, and catch the drift before it shows up as a fuel bill.
Why Recuperation Efficiency Slides Without Anyone Noticing
A grate cooler's entire job is to hand as much heat as possible back to the kiln as secondary and tertiary air, while cooling the clinker enough to protect downstream conveyors and the cement mill. When that handoff works well, the kiln burns less fuel to hit the same burning zone temperature. When it degrades, the kiln compensates automatically, and because that compensation happens gradually, it rarely triggers an alarm. The result is a plant that appears stable on every screen while quietly spending more fuel per tonne of clinker than it did a year earlier.
The three variables operators actually control are grate speed, cooling air distribution across the grate zones, and under-grate pressure in each compartment. None of these are set-and-forget. Grate speed that was correct for one clinker bed depth becomes wrong the moment production rate shifts, cooling air distribution that was balanced for one fan configuration drifts as fans wear or dampers stick, and under-grate pressure swings with ambient temperature and humidity in ways that are easy to miss on a static setpoint.
How the Three Variables Interact in Practice
None of these variables move independently on a running cooler, which is exactly why manual tuning based on a single reading tends to fix one symptom while creating another. Slowing the grate to raise secondary air temperature increases bed depth, which raises under-grate pressure, which then requires more fan power to maintain the same air distribution, which changes the temperature profile across the grate again. A change that looks correct on the secondary air temperature trend can quietly be costing compressed air or fan energy that never shows up on the same screen.
| Adjustment Made | Immediate Effect | Secondary Effect | Risk If Left Unchecked |
|---|---|---|---|
| Grate speed reduced | Bed depth increases | Under-grate pressure rises | Fan power increases without a matching gain in secondary air temperature |
| Cooling air increased at zone one | Faster surface cooling of clinker | Less heat available for tertiary air downstream | Recuperation efficiency drops even as clinker temperature looks better |
| Under-grate pressure setpoint raised | Air forced through denser bed sections | Red river channeling reduced in that zone | Other zones starved of air if total fan capacity is not rebalanced |
A Practical Diagnostic Sequence for a Cooler That Has Drifted
Most coolers that have lost recuperation efficiency were never diagnosed with a structured sequence, they were adjusted reactively whenever clinker temperature at the discharge crossed an alarm limit. A structured approach looks very different and tends to find the real cause faster.
Find Out Where Your Recuperation Efficiency Is Actually Leaking
Bring your last three months of secondary air temperature and fuel rate data to the call. We will walk through where the drift started and which variable is driving it.
Why Ambient Conditions Complicate the Picture Further
Beyond the three variables an operator directly controls, ambient temperature and humidity also shift how much heat cooling air can absorb before it reaches its own saturation point, which means the same grate speed and air distribution setpoints can produce different secondary air temperatures depending on the season. A cooler tuned during a cooler, drier period of the year may appear to lose recuperation efficiency during a hot, humid stretch even though nothing on the equipment itself has changed, simply because the incoming air starts from a different baseline.
This is one of the more common reasons a plant dismisses a real drift as seasonal noise, or conversely chases a seasonal effect as if it were a genuine equipment problem. Separating the two requires comparing performance against the same ambient conditions historically, not just against last month, which is difficult to do consistently with manual log review but becomes straightforward once temperature, humidity, and cooler performance are tracked together on the same timeline.
What Changes Once the Three Variables Are Watched Together
The practical difference between reactive tuning and a connected view is not a new piece of equipment, it is the ability to see grate speed, air distribution, and under-grate pressure on the same timeline as secondary air temperature and fuel rate, so a change in one is never interpreted in isolation. Operators stop chasing a single alarm and start recognizing the pattern that precedes it, which is usually visible hours or even a full shift before clinker discharge temperature would have flagged a problem on its own.
What This Looks Like on a Cooler That Has Never Been Re-Tuned
Many coolers running today were commissioned with a single tuning pass years ago, based on the clinker size distribution and production rate that existed at startup. Since then, quarry material has changed, kiln production rate has likely increased or shifted with market demand, and fan or damper wear has accumulated gradually enough that no single event ever triggered a review. The cooler still runs, clinker still discharges within an acceptable temperature range, and nobody has a clear reason to question the setpoints, yet the recuperation efficiency achieved today may be meaningfully below what the same equipment delivered at commissioning.
The cost of that gap rarely appears as a single number anyone reviews directly. It shows up distributed across the plant's fuel purchasing line, the kiln's specific heat consumption trend, and occasionally in a maintenance conversation about why a particular fan seems to run harder than expected for its rated duty. Because none of these individually points back to the cooler, the connection is easy to miss unless someone is actively looking for it, which is exactly the gap a continuous recuperation view is built to close.
Signs Worth Checking Before the Next Scheduled Inspection
Waiting for an annual shutdown inspection to evaluate cooler performance means an entire year can pass with recuperation efficiency quietly below what the equipment is capable of delivering. A few practical checks, run more frequently than a full turnaround, tend to surface the same issues an inspection would eventually find, just months sooner and while the cooler is still running.
None of these checks require new instrumentation beyond what most coolers already have installed, they simply require looking at existing readings together and over a long enough window to see the trend rather than the daily noise. The plants that catch recuperation efficiency loss early tend to be the ones that have made this comparison a routine habit rather than a once-a-year exercise tied to a shutdown calendar.
Frequently Asked Questions
See Grate Speed, Air Distribution, and Pressure as One Picture
Bring your cooler's recent trend data to the call. We will show how a connected view of secondary air temperature and fuel rate would have flagged your last drift before it became a fuel cost.