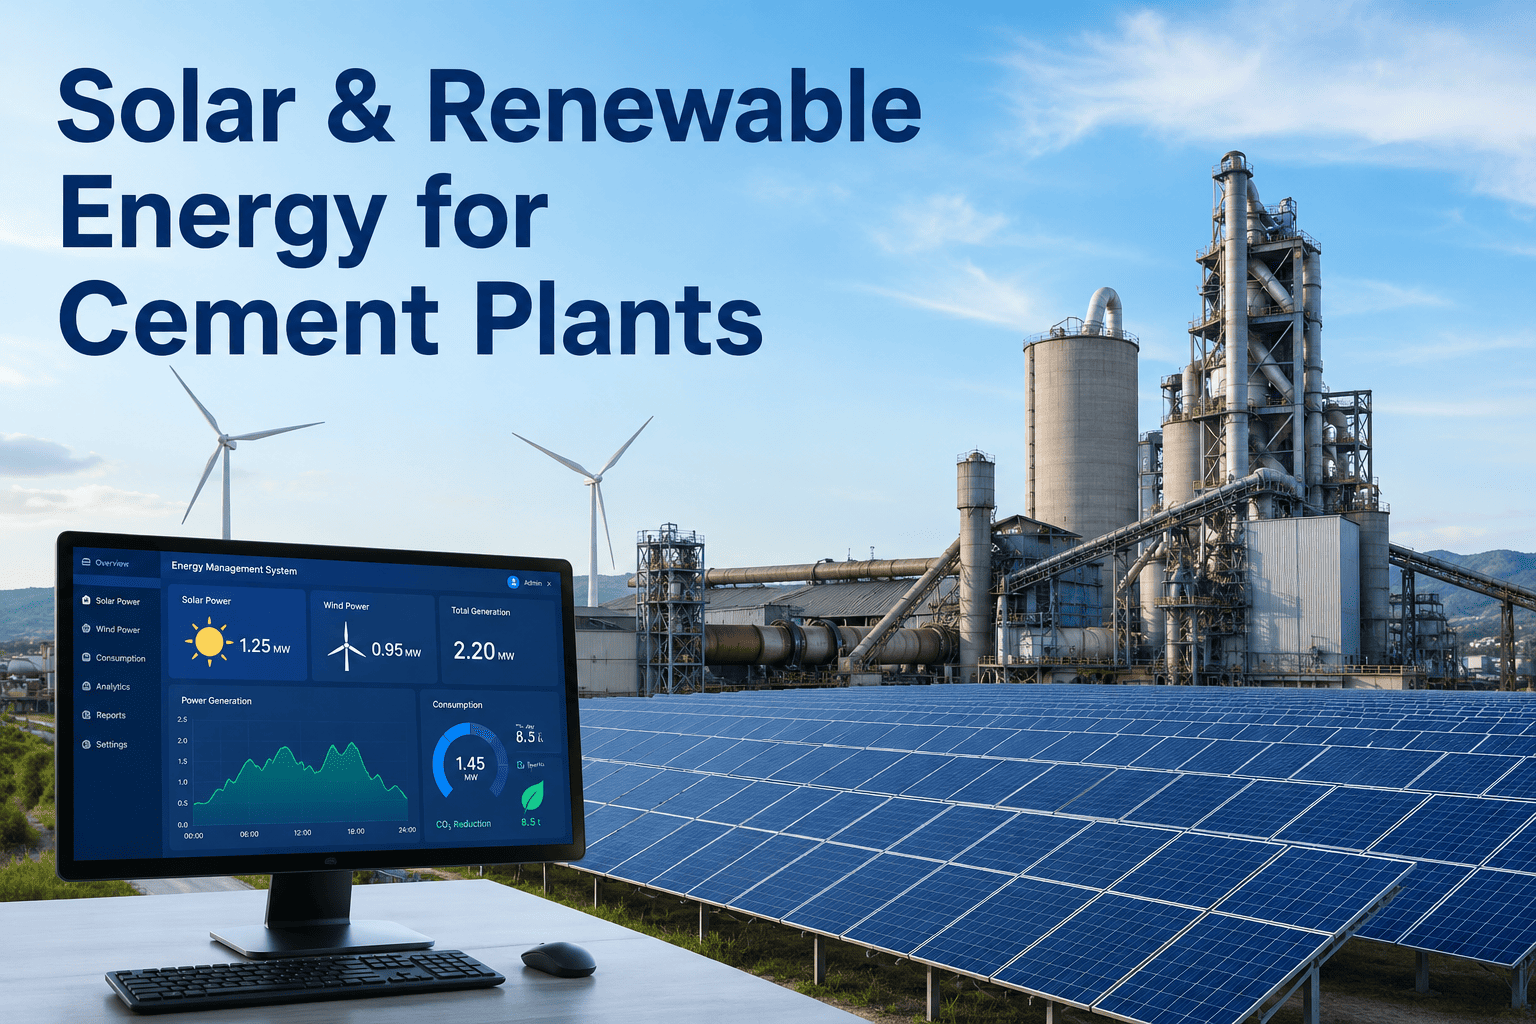
Cement plants are unusually good candidates for captive renewable power, and most energy managers already suspect this without having run the actual numbers. Large flat rooftop and yard areas suit solar deployment, auxiliary and utility loads run predictably around the clock in a way that matches well against a renewable generation profile, and grid power costs for large industrial consumers have been rising steadily in most markets, which shortens payback periods every year a decision gets delayed. The gap between suspecting solar makes sense and actually deploying it usually comes down to sizing the system correctly, projecting ROI with real numbers instead of vendor generalities, and navigating grid interconnection without surprises. Book a demo to see how plants are modeling captive renewable ROI against their actual load data.
Why Cement Plants Fit the Captive Renewable Model Well
Cement manufacturing carries an unusually high electrical load intensity for auxiliary systems — mills, fans, conveyors, and dust collection equipment run continuously across most production hours, creating a steady baseline demand that a captive renewable system can offset reliably rather than serving an intermittent or highly variable load profile where the economics are harder to model. Many cement facilities also sit on large industrial land parcels with substantial rooftop area on process buildings, warehouses, and packing facilities, plus often unused adjacent land that can support ground-mount solar without competing with core production space.
The other factor working in cement's favor is exposure to rising grid electricity costs. Large industrial power tariffs have trended upward across most markets over the past several years, driven by a combination of infrastructure investment recovery, renewable integration costs passed through to consumers, and demand charge structures that penalize exactly the kind of high, steady load profile a cement plant represents. Every year grid rates rise while a captive renewable system's generation cost stays essentially fixed after the initial investment, the payback period on a proposed system shortens for any plant that has not yet made the decision to move forward.
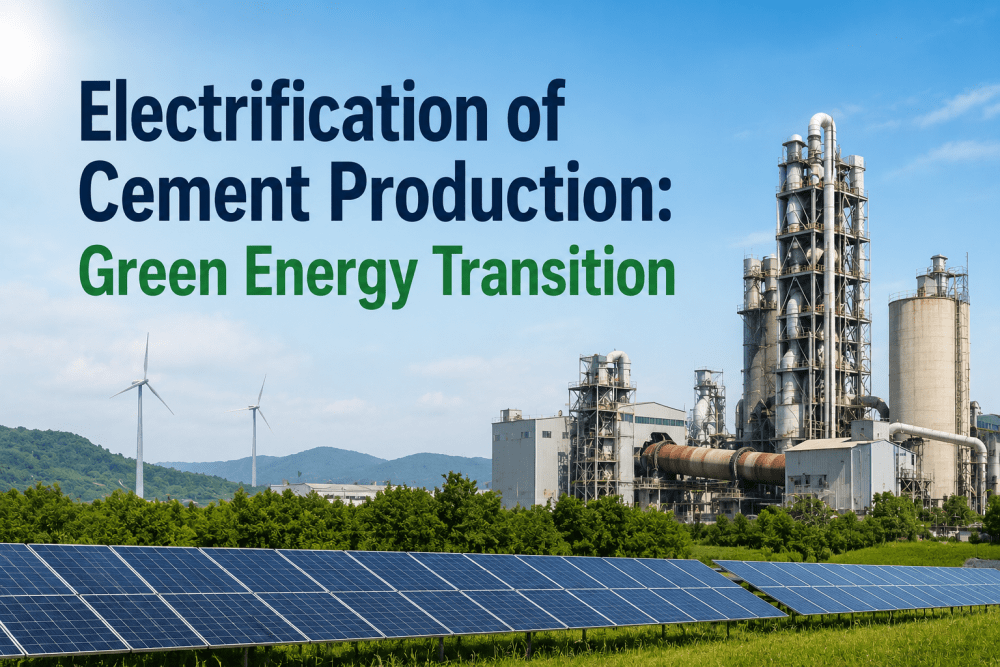
There is also a sustainability and reporting dimension that increasingly factors into the decision alongside pure economics. Cement manufacturing carries a substantial carbon footprint from both the calcination process itself and the fuel used to reach kiln process temperatures, and captive renewable electricity generation is one of the more straightforward levers available to reduce a plant's overall emissions profile without touching the core cement chemistry. As customers, lenders, and regulators increasingly expect documented emissions reduction plans from industrial manufacturers, a captive renewable installation delivers a concrete, measurable data point that supports broader sustainability reporting obligations in addition to its direct energy cost savings.
Sizing a System That Matches Your Actual Load
The single biggest mistake in captive renewable planning is sizing the system against nameplate connected load rather than actual measured consumption, which almost always results in an oversized system that cannot fully utilize its own generation during low-demand periods, or an undersized system that leaves easily justified capacity on the table. Accurate sizing starts with interval load data, ideally at fifteen-minute or hourly resolution over a full year, capturing the seasonal and production-cycle variation that a single-point demand figure would miss entirely.
Production scheduling patterns matter as much as raw demand magnitude when working through this analysis. A plant that runs continuous three-shift production has a fundamentally different load curve to match against solar generation than a plant that concentrates production into two shifts and runs lighter overnight, and a system sized correctly for the first pattern would be oversized relative to actual same-hour consumption for the second. Planned maintenance shutdowns, seasonal demand fluctuations tied to construction industry cycles in many markets, and any anticipated future production expansion should all factor into the load model used for sizing, since a system sized against today's load alone may leave easily justified additional capacity unbuilt if expansion is already on the near-term roadmap.
Projecting ROI: What the Numbers Actually Depend On
Return on investment for a captive renewable system depends on a smaller set of variables than most vendor proposals make it appear, and understanding each one independently helps a plant evaluate competing proposals on consistent terms rather than comparing headline payback numbers built on different assumptions. System capital cost, expected annual generation based on site solar resource and system efficiency, the avoided grid electricity rate the generation offsets, ongoing operations and maintenance cost, and the financing structure chosen all combine to determine the effective payback period and lifetime return.
| Financing Structure | Upfront Capital | Ownership of Savings | Best Fit |
|---|---|---|---|
| Direct ownership | Full system cost | 100% of avoided cost | Plants with available capital and long planning horizon |
| Power purchase agreement | None or minimal | Discounted rate vs grid, no ownership | Plants prioritizing zero capital outlay |
| Lease structure | Low fixed payment | Fixed cost predictability | Plants wanting budget certainty over savings maximization |
| Hybrid co-investment | Partial capital | Shared savings proportional to investment | Plants balancing capital constraints against long-term returns |
Direct ownership typically delivers the highest lifetime savings since the plant captures the full value of avoided grid electricity cost once the system is paid off, but it requires the largest upfront capital commitment and the longest patience for full payback realization. Power purchase agreements shift that capital burden to a third-party developer in exchange for a discounted but ongoing electricity rate, which suits plants prioritizing immediate cost reduction without capital deployment over maximizing total lifetime value. The right structure depends heavily on a plant's capital availability, planning horizon, and how the finance team weighs guaranteed near-term savings against larger but more distant total returns.
Local incentive programs can meaningfully shift the comparison between these structures and should be factored in before finalizing a financing decision rather than treated as an afterthought. Accelerated depreciation schedules, investment tax credits, and state or regional renewable energy incentive programs vary significantly by jurisdiction and can change the effective payback period by a substantial margin depending on which structure is used to capture them, since direct ownership is typically required to claim tax-based incentives while a third-party-owned power purchase agreement structure passes those benefits through the developer's pricing instead. Running the ROI comparison with and without applicable incentives, under each financing structure being considered, gives a much clearer picture of the true relative economics than comparing headline payback figures that may or may not have incentive value baked in consistently across the proposals being evaluated.
Navigating Grid Interconnection Without Delays
Grid interconnection is where captive renewable projects most commonly experience delays that were not anticipated during initial project planning. Utility interconnection studies, protection equipment requirements, and net metering or captive consumption agreement terms vary significantly by jurisdiction and utility, and starting the interconnection application process late in the project timeline is one of the most common reasons a system sits fully installed but unable to generate revenue-offsetting power for months after physical completion.
Engaging with the local utility or grid operator early, ideally during the site assessment phase rather than after system design is finalized, surfaces interconnection capacity constraints, required protection equipment, and approval timelines while there is still flexibility to adjust system size or design to match what the grid connection can actually support. Plants that treat interconnection as a late-stage administrative step rather than an early planning input consistently experience the longest gap between installation completion and full commercial operation.
Protection equipment requirements deserve particular attention during early utility engagement, since they represent both a cost variable and a timeline variable that is easy to underestimate. Utilities generally require specific relay protection, disconnect, and anti-islanding equipment to ensure a captive generation system does not create a safety hazard for grid workers or destabilize the local distribution network during a fault condition. The exact equipment required varies by system size, connection voltage level, and local utility standards, and procurement lead time for this protection equipment can, in some cases, exceed the lead time for the solar modules and inverters themselves, making it a genuine schedule-critical path item rather than a minor add-on.
Common Pitfalls That Derail Otherwise Strong Projects
Even well-justified captive renewable projects run into avoidable delays and cost overruns often enough that it is worth naming the most common pitfalls directly. Underestimating structural assessment needs for rooftop installations is one of the most frequent: older process buildings were rarely designed with solar panel loading in mind, and a structural engineering assessment that comes back requiring reinforcement can add unplanned cost and schedule delay if it was not anticipated during initial feasibility screening. Skipping a proper shading analysis is another common miss, since equipment like elevated conveyors, stacks, and adjacent buildings can cast partial shade across a rooftop array in ways that are not obvious from a simple site walk and that meaningfully reduce actual generation below initial projections if not modeled correctly.
Underestimating ongoing operations and maintenance requirements is a third recurring issue, particularly the impact of cement dust accumulation on panel surfaces, which reduces generation efficiency faster in a cement plant environment than in a typical clean industrial or commercial setting. A cleaning and maintenance plan appropriate to the site's actual dust exposure, rather than a generic maintenance schedule borrowed from a non-dusty environment, protects the generation projections that the ROI case was originally built on.
Getting system sizing, ROI modeling, and interconnection planning right from the start is what separates a captive renewable project with a clean two-to-four-year payback from one that stalls in permitting. Book a demo and we will walk through the planning sequence against your site specifics.