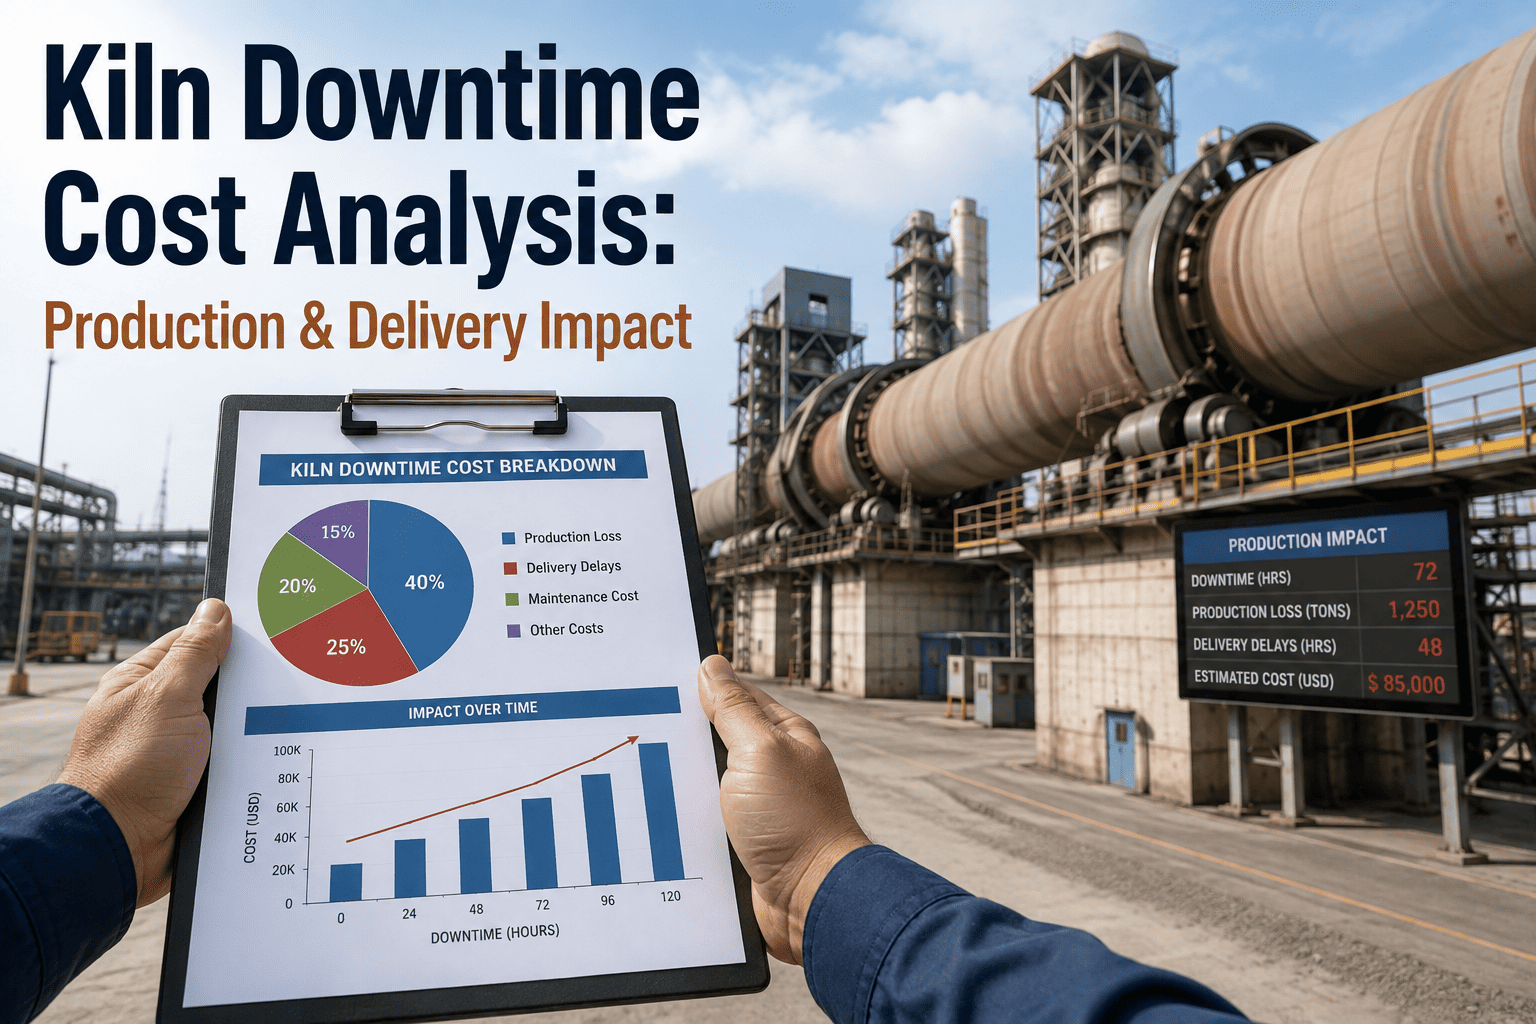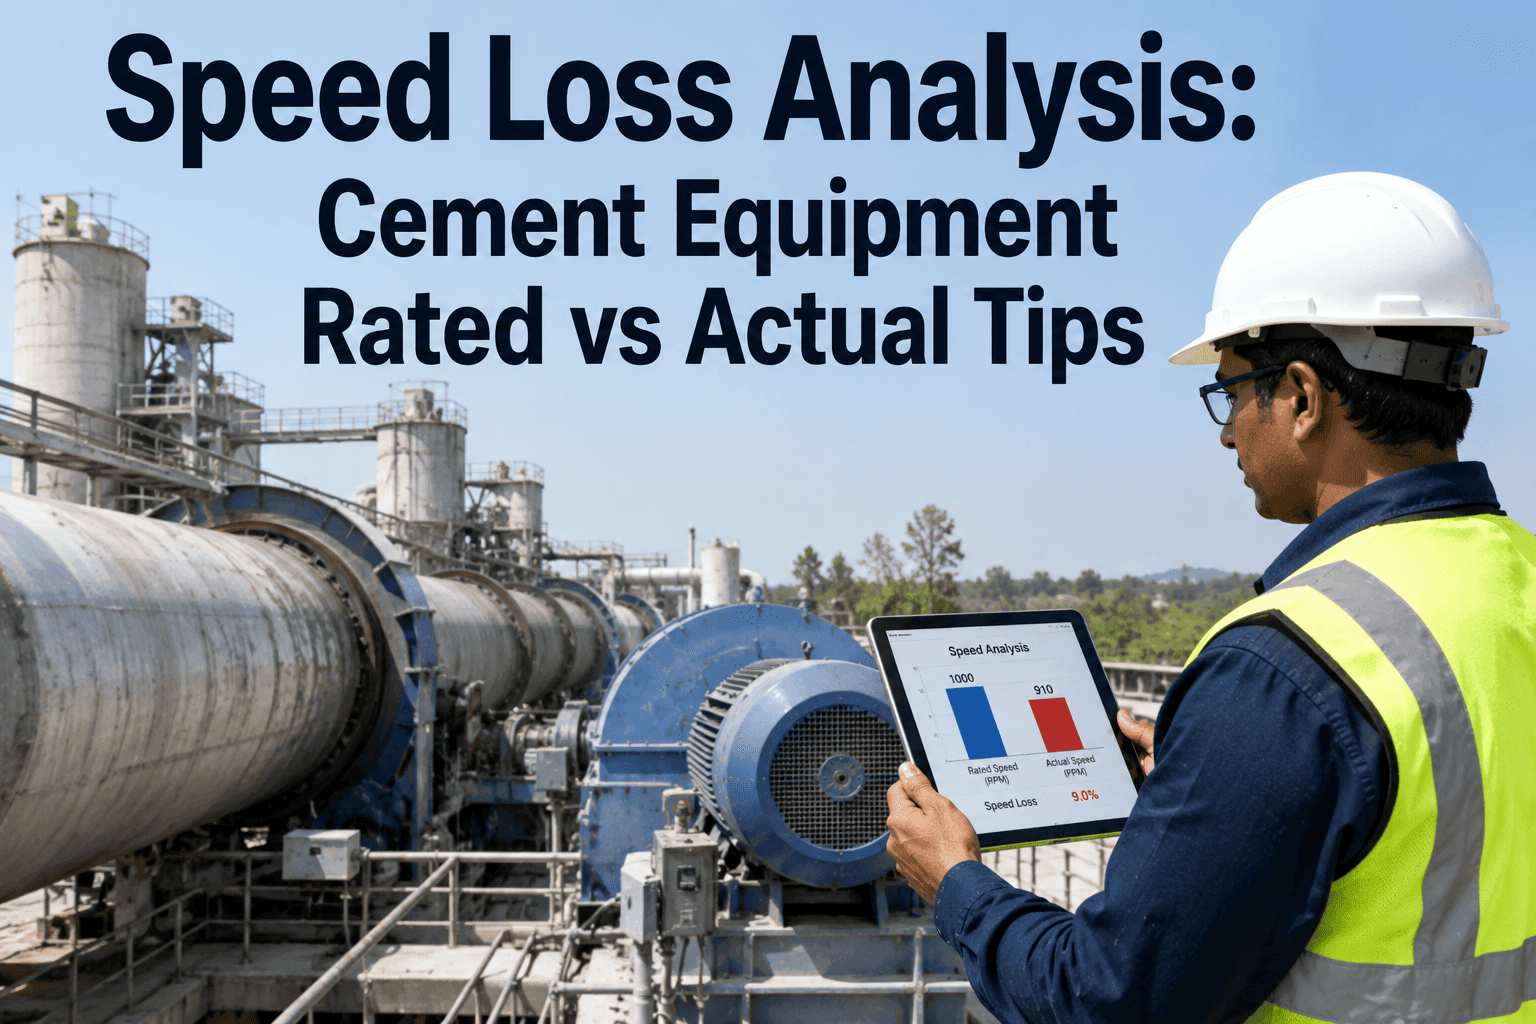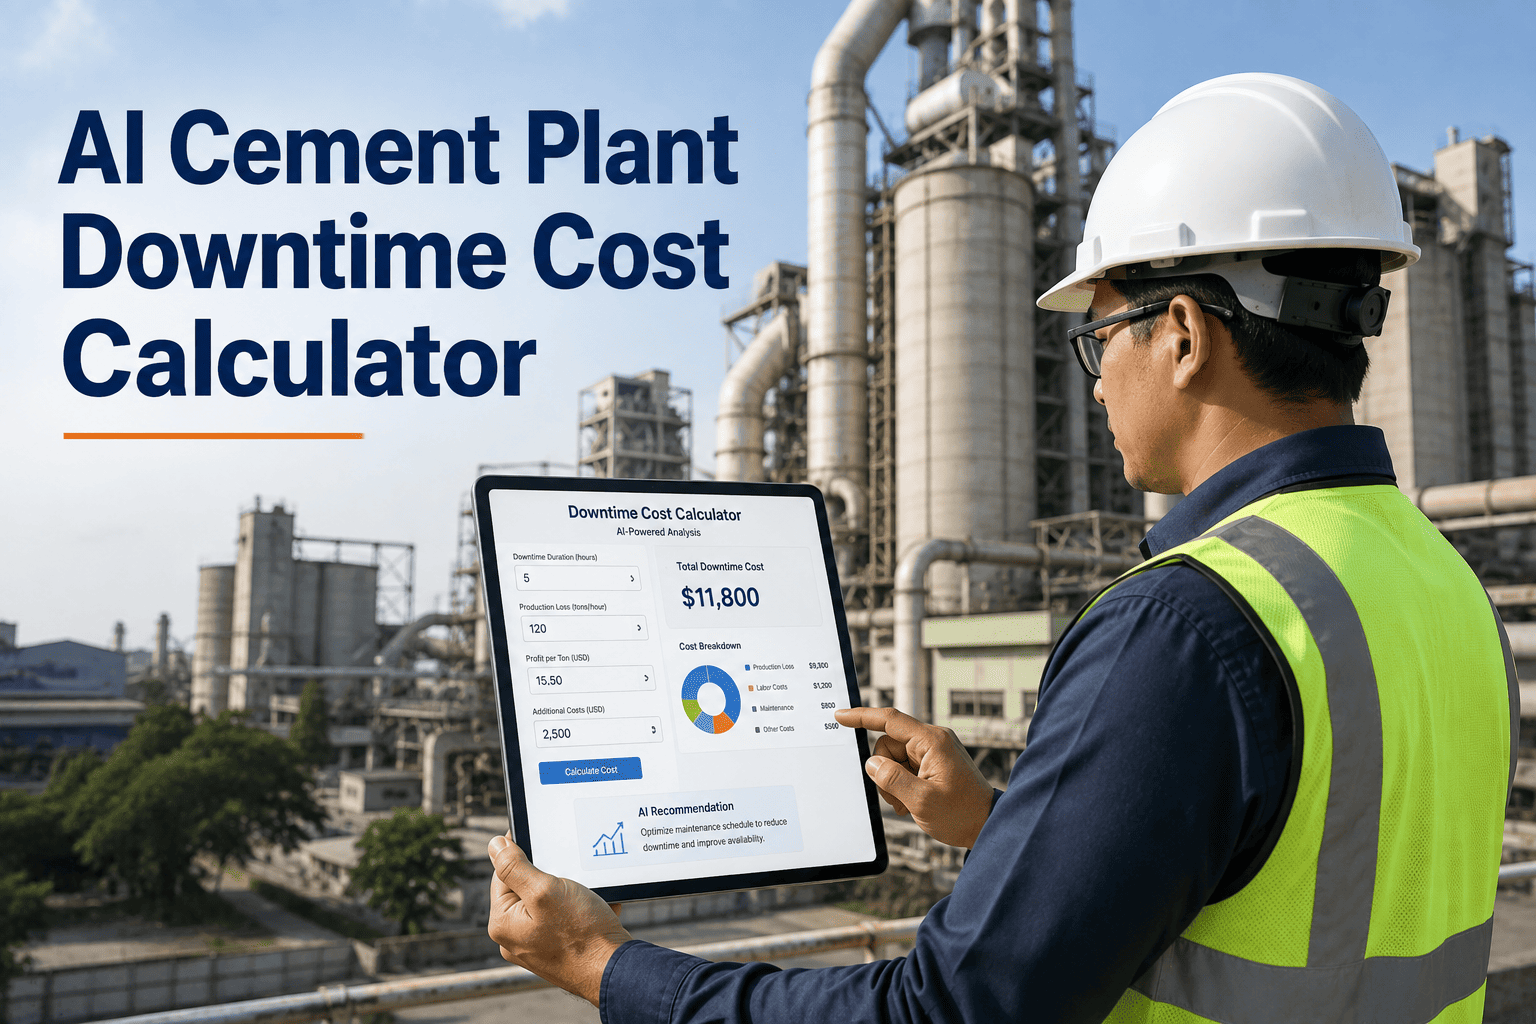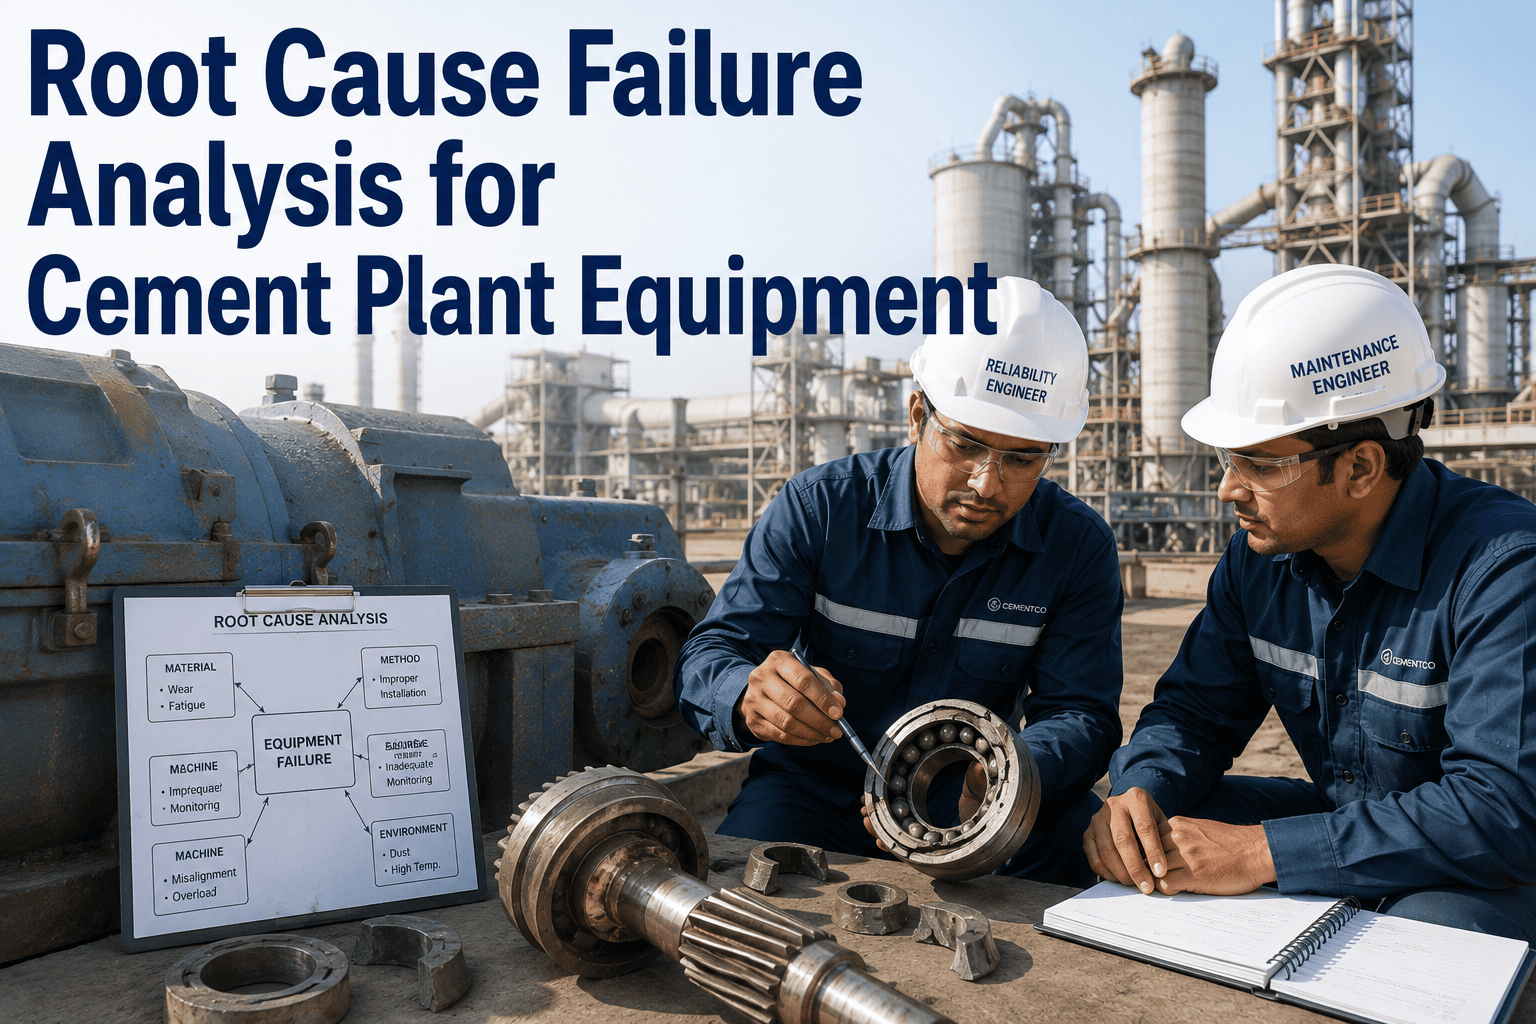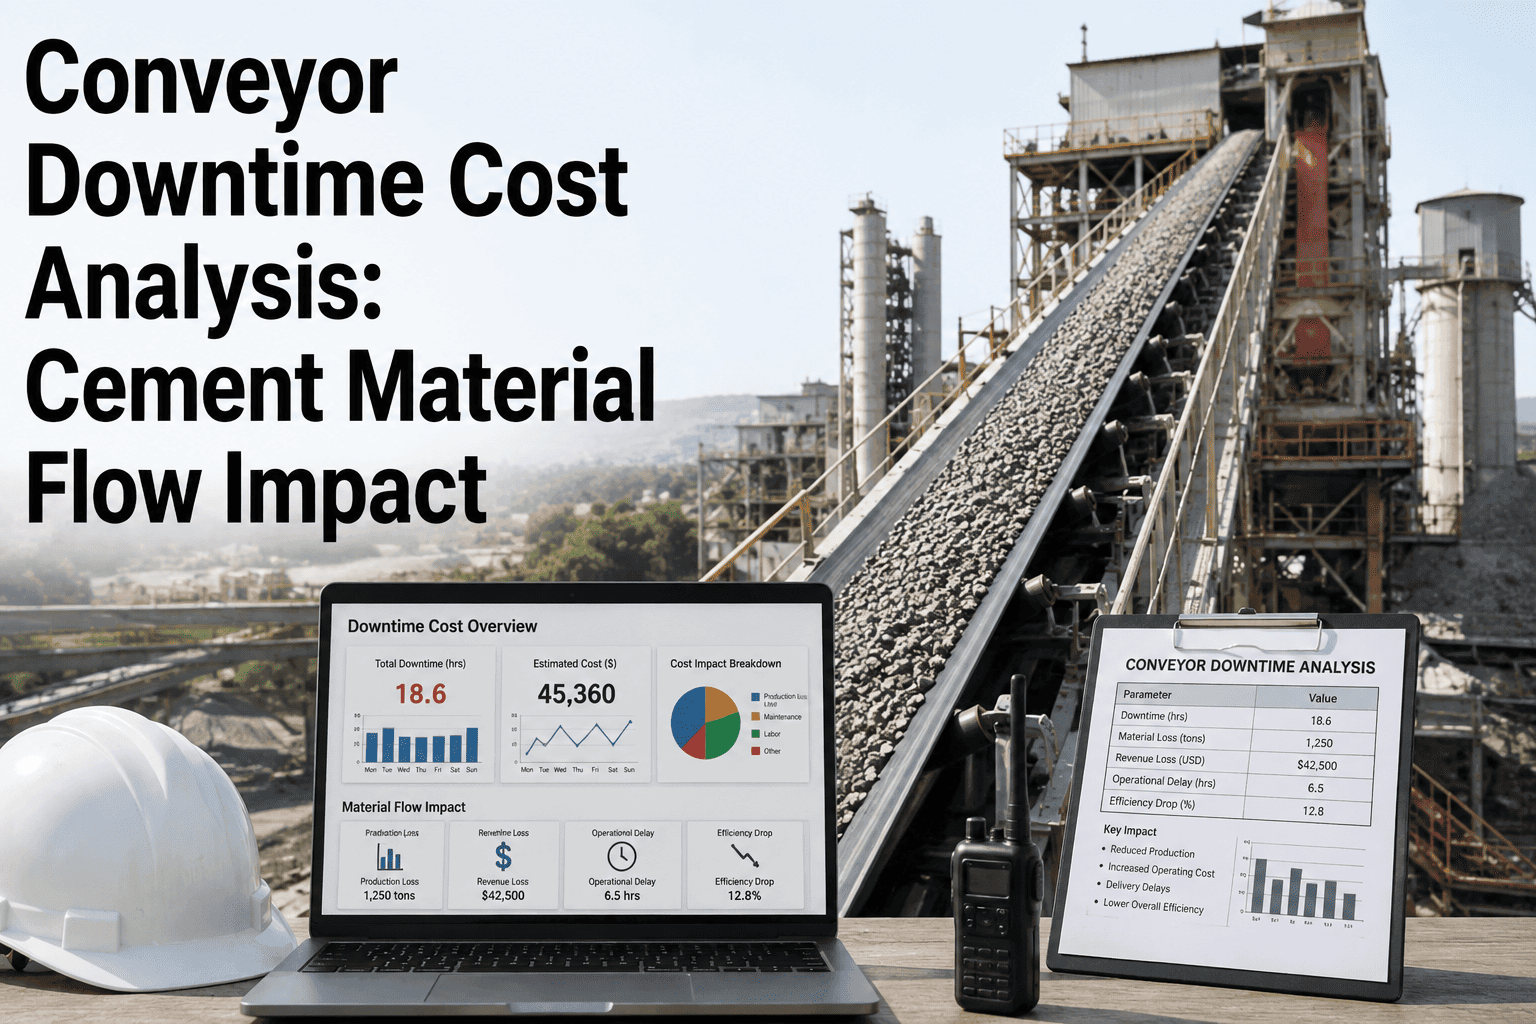
A single idle conveyor rarely shows up on a P&L line by itself. What shows up is a kiln running below capacity because raw meal isn't reaching the preheater, a cement mill sitting empty while clinker backs up at the crusher, and a shift's worth of labor reassigned to manual workarounds nobody budgeted for. Conveyor downtime cost is almost never just the conveyor — it's everything downstream that depended on the material it was supposed to be moving. iFactory's conveyor monitoring platform is built to quantify that full cascade, not just the repair ticket.
The Real Cost of Conveyor Downtime Is Rarely the Number on the Work Order
A belt splice repair might cost a few thousand dollars in parts and labor. The production it stops, the downstream equipment it idles, and the material handling workarounds it forces can cost ten to twenty times that — and most plants never calculate the full number.
Why the Repair Invoice Is the Smallest Number in This Story
When a conveyor goes down, the maintenance team's first instinct is to look at what it will cost to fix — a belt splice, a replaced idler, a motor swap. That number is real, but it's also the easiest part of the total cost to see, which is exactly why it's the number that ends up in the maintenance budget conversation while the much larger production and cascade costs go untracked. A cement plant's material flow is a series of dependent steps: quarry to crusher, crusher to raw mill, raw mill to blending silo, kiln feed, clinker cooler, cement mill, and finished product storage. A conveyor is very often the single connective link between two of those stages, which means a conveyor failure doesn't just stop material moving — it stops production at every stage downstream of it until the material starts flowing again.
The Full Cost Stack: Direct vs. Cascade
Total downtime cost breaks into two very different categories, and separating them is the first step toward an accurate number. Direct costs are what shows up on the work order. Cascade costs are what happens to every process stage that depended on the material the conveyor was moving — and they compound the longer the stoppage lasts.
How One Conveyor Stoppage Cascades Through the Plant
The further downstream a conveyor sits in the process — closer to the kiln, closer to finished product — the more expensive its failure becomes, because more capital-intensive equipment ends up idle waiting on material. A raw-material feed conveyor failure is expensive. A kiln-feed or clinker-transport conveyor failure is often the single most costly point of failure in the entire plant.
Conveyor stops
A belt tear, blocked chute, or bearing seizure halts material transfer at the point of failure — the first and smallest cost in the chain.
Immediate downstream stage runs dry
Whatever process sits directly after the failed conveyor — a mill, a kiln feed system, a silo — exhausts its buffer inventory and slows or stops within minutes to a few hours depending on buffer capacity.
Upstream stages back up
Material still arriving from earlier stages has nowhere to go, forcing upstream equipment to slow, stop, or divert to emergency storage — assuming that capacity exists at all.
Kiln operation destabilizes
If the stoppage reaches the kiln feed system, the kiln itself is affected — and a kiln that has to slow or trip carries its own restart cost and stabilization period measured in hours, not minutes.
Full-rate restart takes longer than the repair itself
Once the conveyor is physically repaired, every downstream stage still has to ramp back to full rate — often taking longer than the mechanical fix, and producing off-spec material along the way.
Most Plants Can Quote Their Repair Costs. Few Can Quote Their Cascade Costs.
iFactory helps plants build a true downtime cost model — direct repair plus cascade impact — so the maintenance investment case is based on the real number, not the invoice.
Building Your Own Downtime Cost Number
A defensible downtime cost figure combines a handful of inputs most plants already have somewhere in their financial and production systems — the gap is usually that nobody has assembled them into a single calculation tied specifically to conveyor failures.
| Input | Typical Source | Why It's Often Missed |
|---|---|---|
| Downstream idle hours | Production logs, DCS event history | Logged as a production event, rarely traced back to the originating conveyor failure |
| Lost production value per hour | Finance / production planning | Available at the plant level but rarely broken down to the specific idled process stage |
| Kiln or mill restart stabilization time | Operations/process engineering | Treated as a normal operating variance rather than attributed to the triggering failure |
| Off-spec product during ramp-up | Quality lab records | Recorded as a quality event, not connected back to the mechanical failure that caused it |
Reactive vs. Monitored: How the Cost Trajectory Changes
The single biggest lever on total downtime cost isn't the repair itself — it's how much of the cascade gets triggered before the failure is caught. A conveyor issue detected early, while it's still a developing problem, can often be scheduled into a planned window with little or no downstream impact. The same issue caught only when it fails outright triggers the full cascade.
| Stage | Reactive (Failure-Triggered) | Monitored (Early-Detected) |
|---|---|---|
| Detection point | Belt stops, alarm triggers, or visual discovery during rounds | Trend deviation flagged days to weeks before failure |
| Repair scheduling | Unplanned, often requiring overtime or rush parts | Scheduled into existing planned maintenance window |
| Downstream impact | Full cascade — idle kiln/mill time, restart cost, off-spec product | Minimal to none — buffer capacity absorbs a planned, brief stoppage |
| Total realistic cost range | Direct repair plus a multiple of that in cascade cost | Close to direct repair cost alone |
A Composite Scenario: The Same Failure, Two Different Bills
Consider a kiln-feed conveyor at a mid-size cement plant, developing a slow idler bearing failure. In the reactive version of this scenario, the bearing seizes without warning during a night shift. The belt tracks off center, trips the safety switch, and the kiln feed system runs dry within the hour. The kiln itself has to be slowed to protect refractory and burner conditions, and full-rate restart — including the several hours it takes to re-stabilize feed rate, burning zone temperature, and product chemistry — doesn't happen until well into the following shift. The maintenance invoice for the bearing and belt tracking repair is modest. The production loss, off-spec clinker during ramp-up, and overtime labor to manage the emergency response add up to a total cost many times larger than that invoice, and none of it appears on the maintenance ledger.
In the monitored version of the same failure, the developing bearing wear shows up as a gradual vibration and temperature trend over the preceding two weeks. Maintenance schedules the bearing replacement into the next planned stoppage window, when the kiln feed buffer already provides coverage for the short interruption. The repair costs roughly the same in parts and labor. The cascade cost — the number that dominated the reactive scenario — is close to zero, because the kiln, the mill, and every downstream stage never noticed the conveyor was touched.
Building the Investment Case for Conveyor Monitoring
Once the cascade cost is quantified rather than assumed, the investment case for conveyor monitoring shifts from a maintenance-budget conversation to a production-protection conversation — and the numbers involved are usually large enough to change how the request gets prioritized.
Compare Against Annualized Cascade Cost
Multiply the average cascade cost per unplanned conveyor failure by the number of unplanned failures per year — that annualized figure, not the monitoring system's price tag alone, is the number that belongs in the ROI conversation.
Prioritize the Highest-Cascade Conveyors First
Not every conveyor carries equal downtime risk — a kiln-feed or clinker-transport conveyor with no redundant path deserves monitoring investment well ahead of a conveyor with buffer capacity or a parallel line on either side.
Include Restart and Off-Spec Cost, Not Just Downtime
A monitoring investment case that only counts idle hours understates its own return — restart stabilization time and off-spec product during ramp-up are real, recurring costs worth including explicitly.
Track Avoided Cascade Events, Not Just Uptime
Once monitoring is in place, the clearest ongoing proof of value is a running log of issues caught and scheduled before they triggered a downstream cascade — a metric most reactive maintenance programs have no way to measure.
What to Bring to a Downtime Cost Analysis Session
None of these numbers need to be perfectly precise to be useful — even a directional cost model, built from the data a plant already has, is usually enough to show that the cascade cost dwarfs the repair cost. The plants that eventually invest in continuous conveyor monitoring are almost always the ones that ran this calculation once and didn't like what the honest number looked like.
Frequently Asked Questions
How do we estimate lost production value per hour if finance hasn't broken it down by process stage?
A reasonable starting estimate can be built from total plant output value divided across the process stages a given conveyor feeds, weighted by that stage's contribution to final product. It won't be perfectly precise on the first pass, but it's accurate enough to demonstrate the scale of cascade cost relative to direct repair cost, which is usually the point that needs making first. Visit support for a worked example relevant to your plant configuration.
Does every conveyor in the plant need the same level of monitoring investment?
No — cascade risk varies enormously by position in the process. A conveyor feeding a well-buffered stockpile carries far less downtime risk than one feeding the kiln directly with no buffer capacity behind it. Prioritizing monitoring investment by cascade exposure, rather than applying it uniformly, typically produces a stronger return on the same budget.
How quickly does early detection actually translate into avoided cascade cost?
The value shows up the first time a developing issue — a tracking drift, a bearing trend, a splice weakening — gets caught early enough to schedule into a planned window instead of triggering an unplanned stoppage. Plants that track this consistently typically see the avoided-cascade log start filling in within the first few months of monitoring being in place.
Can this cost model help justify monitoring to finance, not just maintenance leadership?
Yes — that's often the exact purpose it serves. A cost model built around cascade impact, not just repair spend, translates a maintenance request into production-protection language that finance stakeholders evaluate more readily. Book a demo to see how the cost analysis is typically framed for a capital or budget review.
What if we don't have historical data on past conveyor failures and their downstream impact?
Incomplete historical data is the norm, not the exception — most plants log the mechanical repair but not the downstream production impact tied to it. Starting the cost model from a handful of recent, well-remembered incidents is usually enough to establish the general cost ratio between direct repair and cascade impact, which can then be refined as monitoring data accumulates going forward.
Know the Real Number Before the Next Unplanned Stoppage Sets It For You
iFactory helps cement plants quantify true conveyor downtime cost and catch developing failures before they trigger the cascade. See what your highest-risk conveyors are actually costing you.