Most cement plants can tell you their maintenance budget down to the dollar, but ask what a single unplanned kiln stop actually costs once lost production, emergency labor, spoiled raw meal, and the multi-hour restart cycle are added together, and the answer is usually a guess. That gap between budgeted maintenance spend and the real cost of downtime is exactly where maintenance investment decisions go wrong, because a plant that cannot price its own downtime cannot reliably justify the AI monitoring, sensors, or CMMS spend that would prevent it. Book a demo to see your own downtime cost calculated against your plant's actual asset and production data.
How Much Is an Hour of Downtime Actually Costing Your Cement Plant?
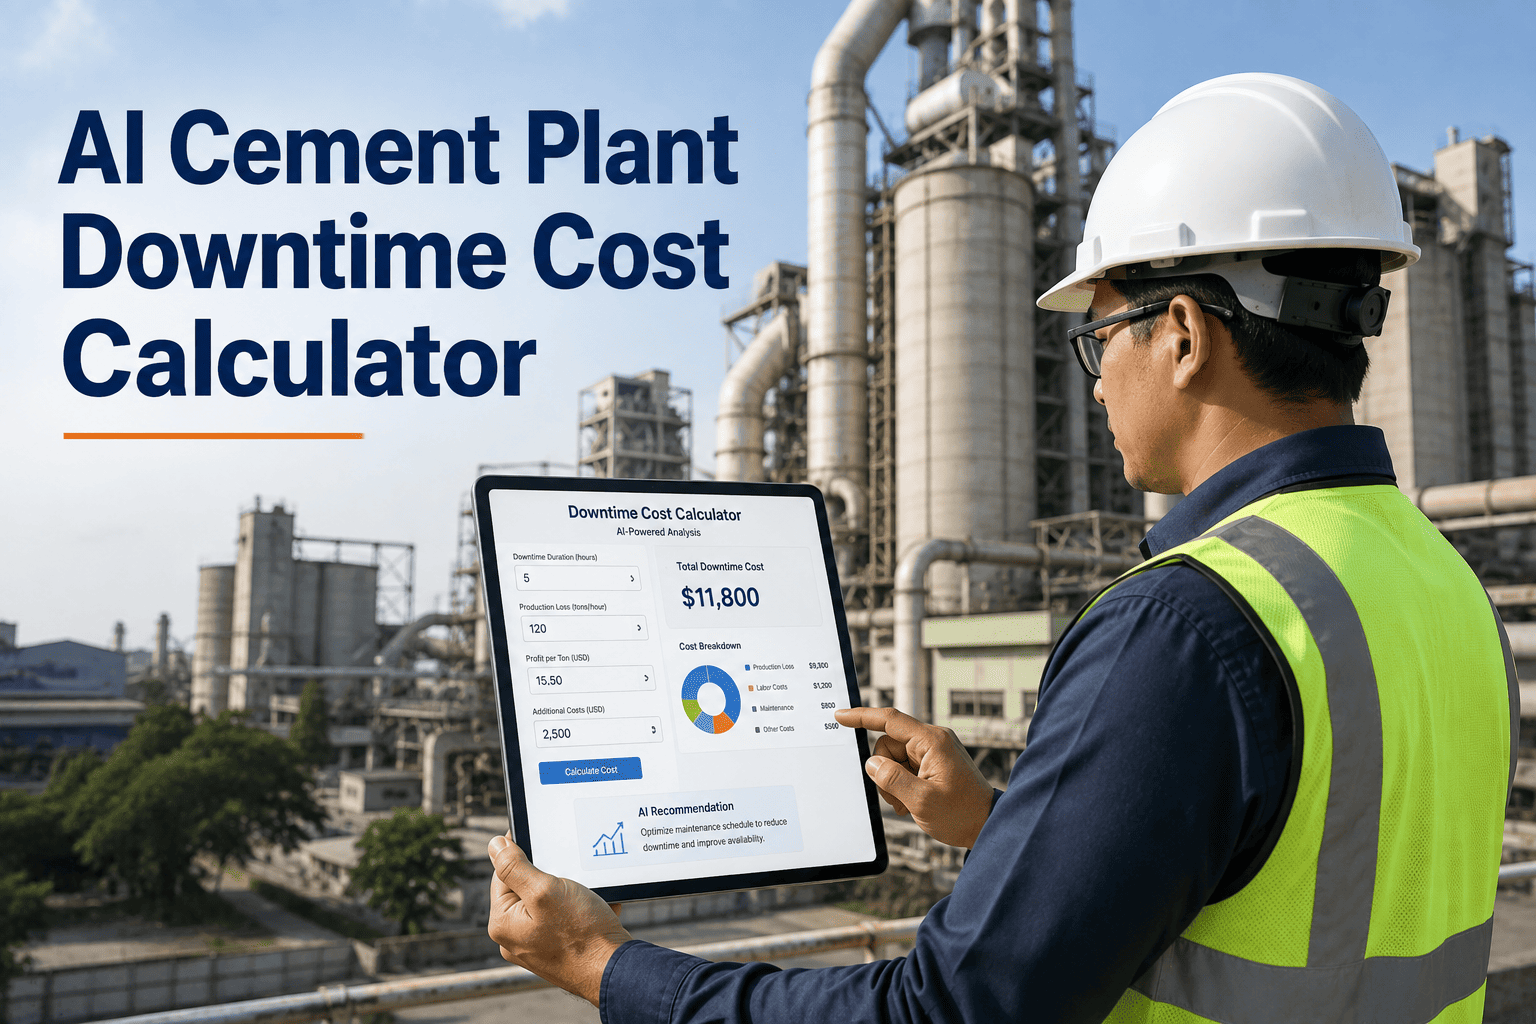
Unplanned kiln, mill, and crusher stoppages routinely cost cement plants anywhere from $8,000 to over $100,000 per hour once every cost driver is counted, yet most maintenance budgets are built without ever calculating that number precisely. iFactory's AI Analytics turns your actual production, energy, and maintenance data into a real downtime cost figure, then shows exactly which assets deserve monitoring investment first.
What Actually Goes Into a Real Downtime Cost Number
Most informal downtime estimates stop at lost production volume multiplied by margin per ton, which understates the real number significantly. A defensible downtime cost calculation has to account for five distinct cost layers, each of which behaves differently depending on which asset failed and how long the stoppage lasted.
What This Looks Like on a Real Kiln Stoppage
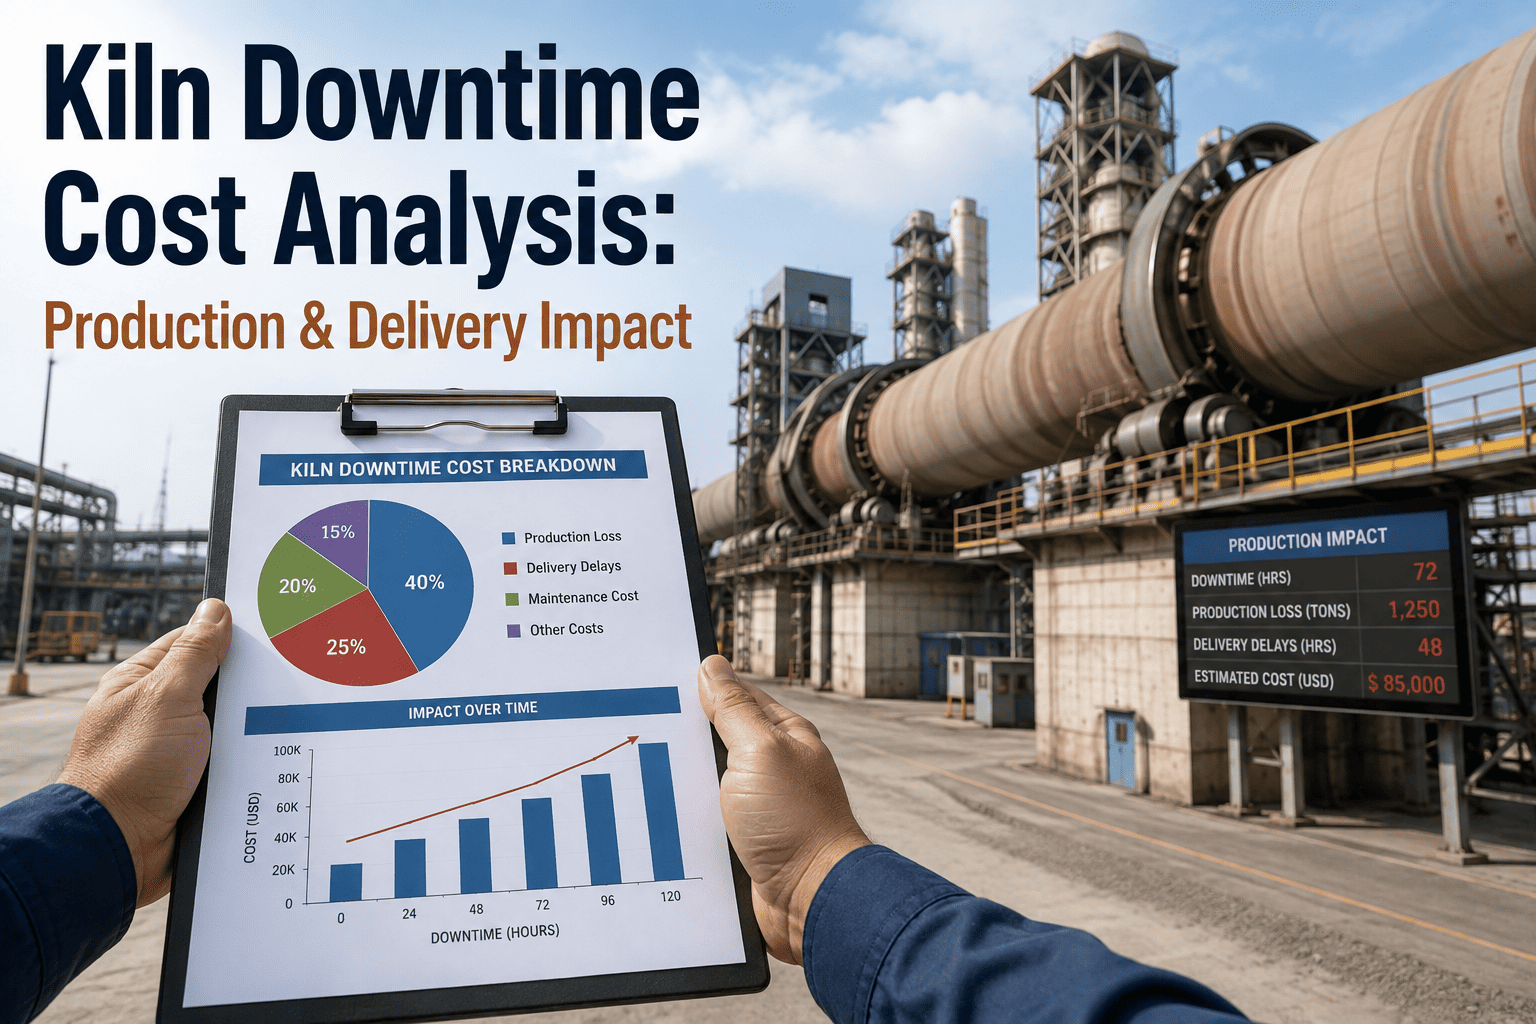
The example below reflects a commonly cited scenario for a mid-size kiln line experiencing an unplanned stop, built from the five cost layers above rather than production loss alone.
A single documented case of a cement plant deploying AI-based condition monitoring across 28 critical assets reported $1.8 million in annual savings against a Year 1 investment of $155,000 to $245,000, a return of roughly ten to one with payback reached within about four months, driven mainly by eliminated emergency repairs and avoided production loss of this kind.
Stop Estimating Your Downtime Cost. Calculate It Against Your Own Data
iFactory's AI Analytics pulls your actual production rates, margins, energy costs, and maintenance history to build a downtime cost model specific to your plant, then ranks your assets by which ones are costing you the most when they fail.
What Most Plants Leave Out of Their Downtime Math
Downtime Cost Ranges by Critical Asset Type
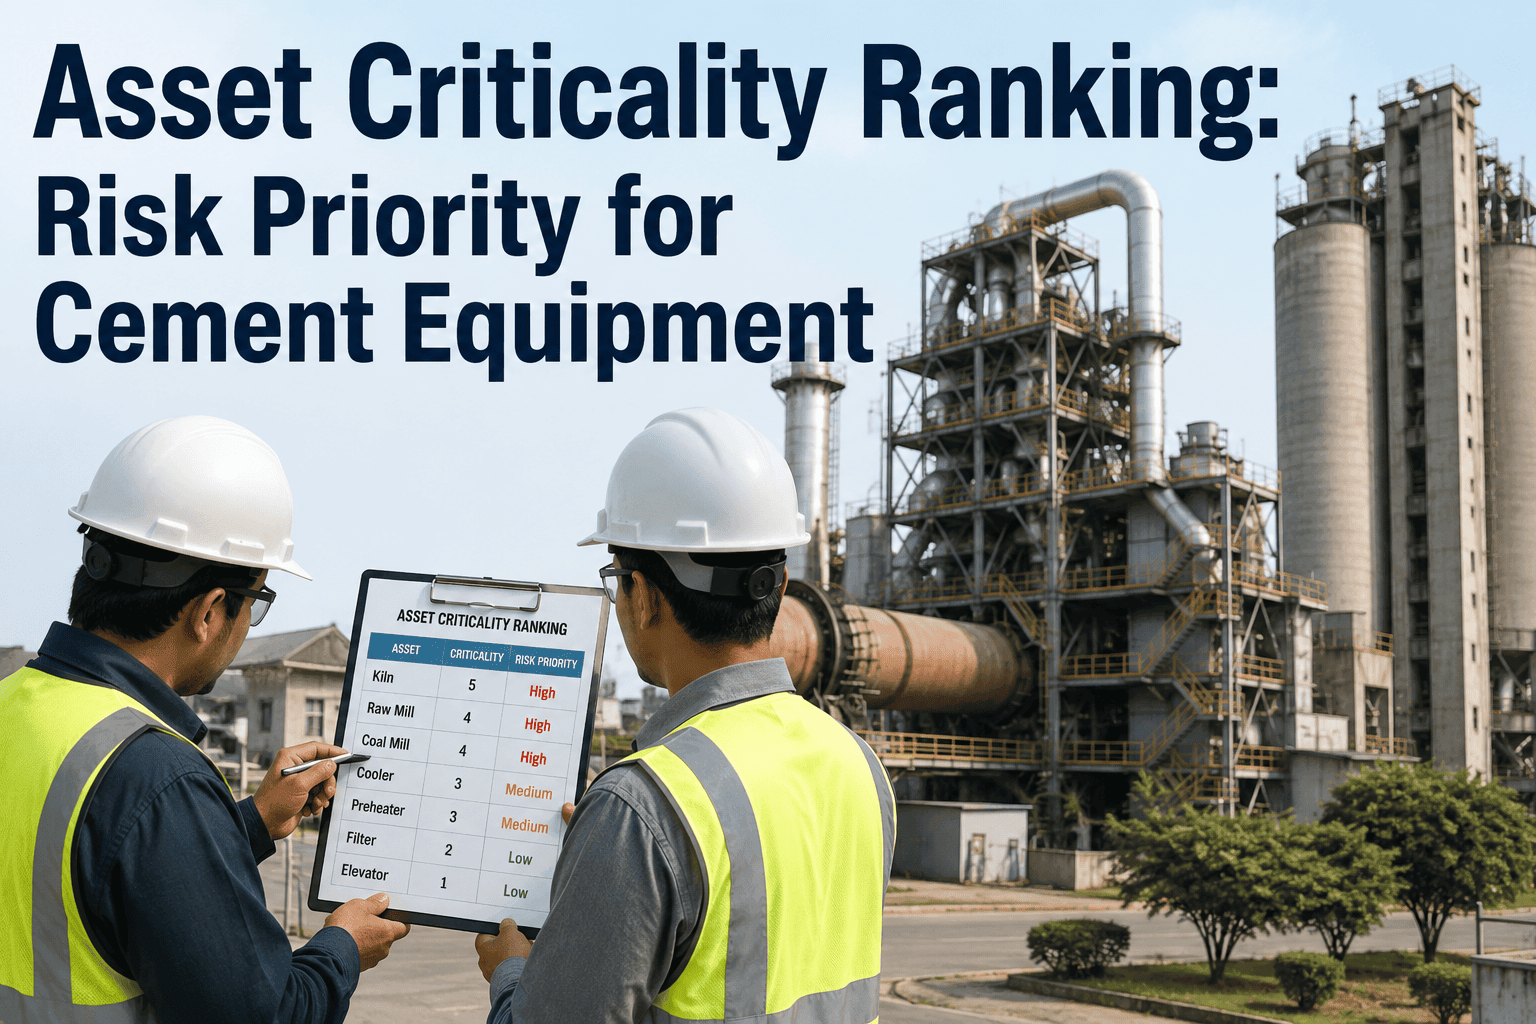
Published industry figures vary by plant capacity, fuel mix, and region, but the relative pattern across asset types is consistent enough to guide where monitoring investment typically pays back fastest.
| Asset | Typical Cost Per Hour Down | Priority for Monitoring |
|---|---|---|
| Rotary kiln and drive system | $8,000 - $100,000+ | Highest, longest restart penalty |
| Preheater and ID fans | $5,000 - $30,000 | High, cascades to full line stop |
| Ball mill / finish mill | $3,000 - $15,000 | High, direct throughput impact |
| Clinker cooler | $2,500 - $12,000 | Medium-high, downstream dependency |
| Raw mill and coal mill | $2,000 - $10,000 | Medium, buffer capacity often exists |
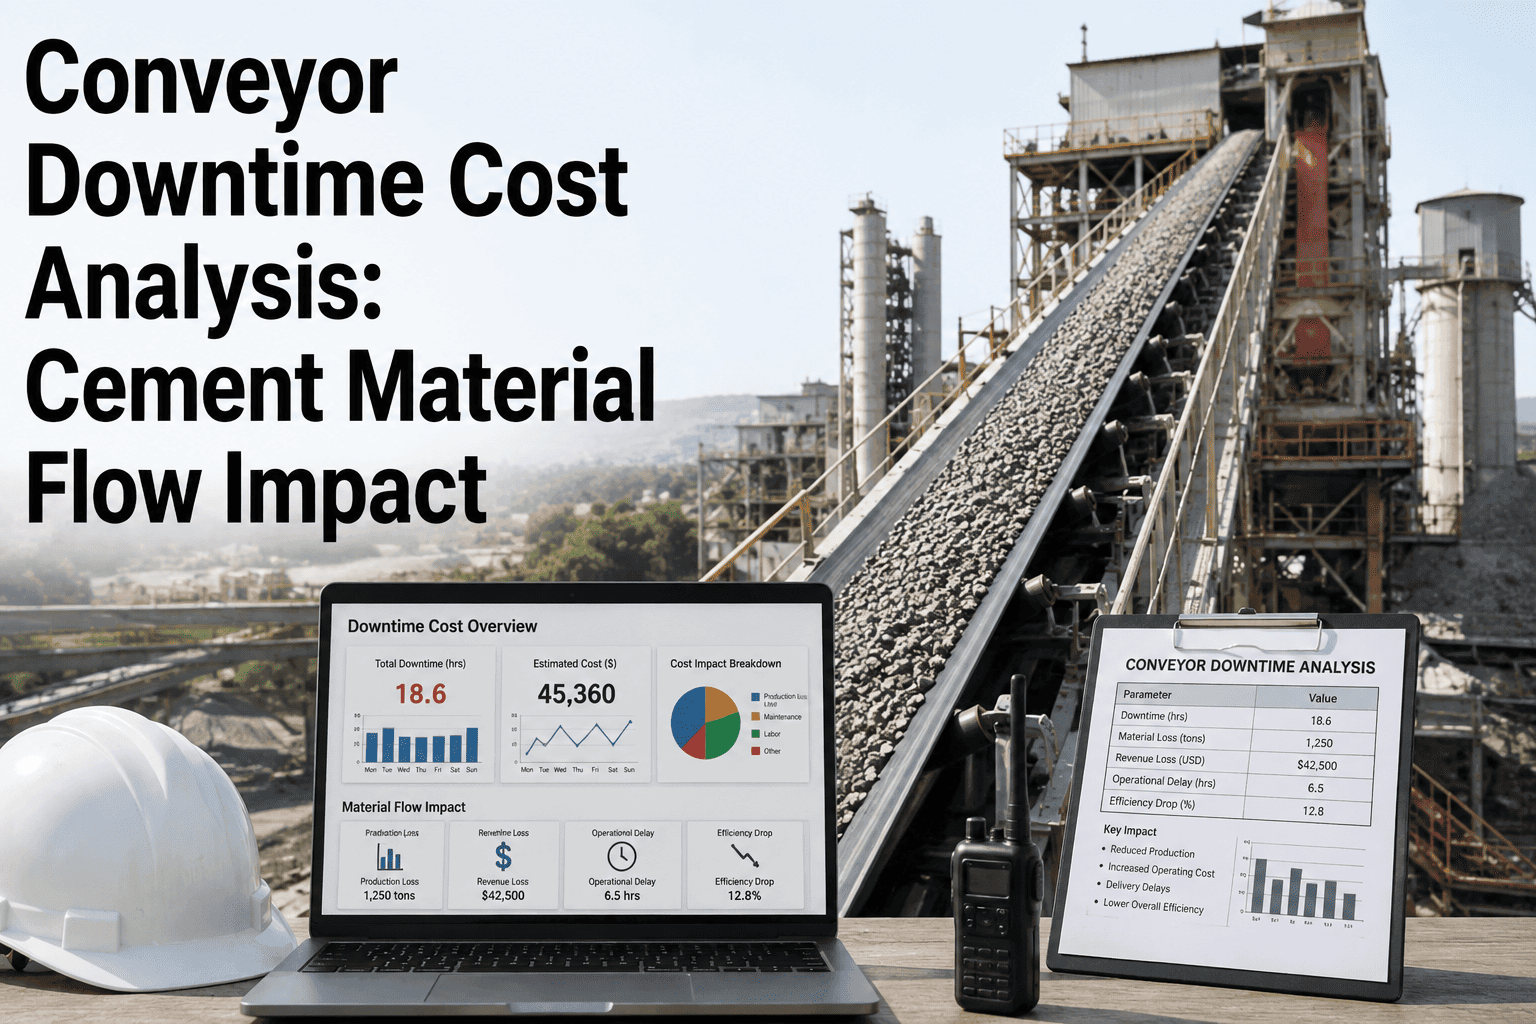
| Conveyors and material handling | $1,000 - $6,000 | Medium, varies by buffer and redundancy |
What Happens After You Know the Real Number
What Plants Running This Model See
Common Questions About Downtime Cost Calculation
What information does a plant need to calculate its own downtime cost accurately?
An accurate calculation needs production rate and margin per ton for the specific line affected, historical restart duration and fuel consumption for that asset, typical emergency repair and overtime labor cost from past incidents, and any contractual delivery penalties tied to missed shipments. Most of this data already exists somewhere in production, finance, and maintenance records, but it is rarely assembled in one place, which is exactly why the informal estimate most plants use tends to understate the real cost significantly. Book a demo to see this calculation built from your plant's own data rather than industry averages.
Why does the same type of failure sometimes cost so much more at one plant than another?
Downtime cost varies significantly based on plant capacity, margin structure, buffer capacity between process stages, and how quickly a spare part or repair crew can be mobilized, particularly for remote plant locations facing longer emergency response times. A high-capacity kiln with thin buffer storage downstream will see a failure cascade into the mill and finishing circuits almost immediately, while a plant with more intermediate storage can absorb a short stoppage with far less downstream disruption, which is why generic industry benchmarks should be treated as a starting reference rather than a precise figure for any specific site.
How does AI Analytics actually reduce downtime cost rather than just measuring it after the fact?
Measuring downtime cost accurately is the starting point, not the end goal, since knowing which assets are most expensive when they fail tells a maintenance team exactly where to focus limited monitoring budget for the fastest return. From there, AI Analytics applies continuous condition monitoring, vibration analysis, and failure pattern recognition to those prioritized assets, converting what would have been an unplanned multi-hour breakdown into a planned repair scheduled during normal maintenance windows, which is where the actual cost avoidance comes from. Contact support for detail on how condition monitoring integrates with your existing CMMS.
Is this kind of downtime cost analysis only useful for large, high-capacity cement plants?
Smaller plants often have the most to gain from a precise downtime cost calculation, not the least, because thinner margins and tighter cash flow make an unplanned six-figure repair bill proportionally more damaging than at a large-capacity operation with more financial cushion. The calculation methodology itself scales down cleanly, using the same five cost layers against the plant's actual production rate and margin structure, and prioritizing monitoring investment on the two or three assets with the highest financial exposure often delivers a meaningful return even on a modest initial budget. Book a demo to discuss a right-sized monitoring rollout for your plant's capacity.
How long does it typically take to see a return after starting to track and act on downtime cost data?
Based on documented deployments, plants prioritizing monitoring investment by actual downtime cost exposure rather than a generic asset list have reached payback within roughly four to eight months, with the fastest returns coming from preventing even a single major failure on a high-cost asset like a kiln drive or main ID fan. Full return timelines vary based on how many assets are brought under monitoring and how severe the plant's existing unplanned downtime rate is beforehand, with plants carrying significant deferred maintenance or frequent breakdowns often seeing faster returns since the baseline cost being avoided is larger.
Know the Real Number Before the Next Kiln Stop Teaches It to You
iFactory calculates your actual downtime cost per asset, ranks where monitoring investment pays back fastest, and tracks the savings as they happen. See what your plant's number looks like.