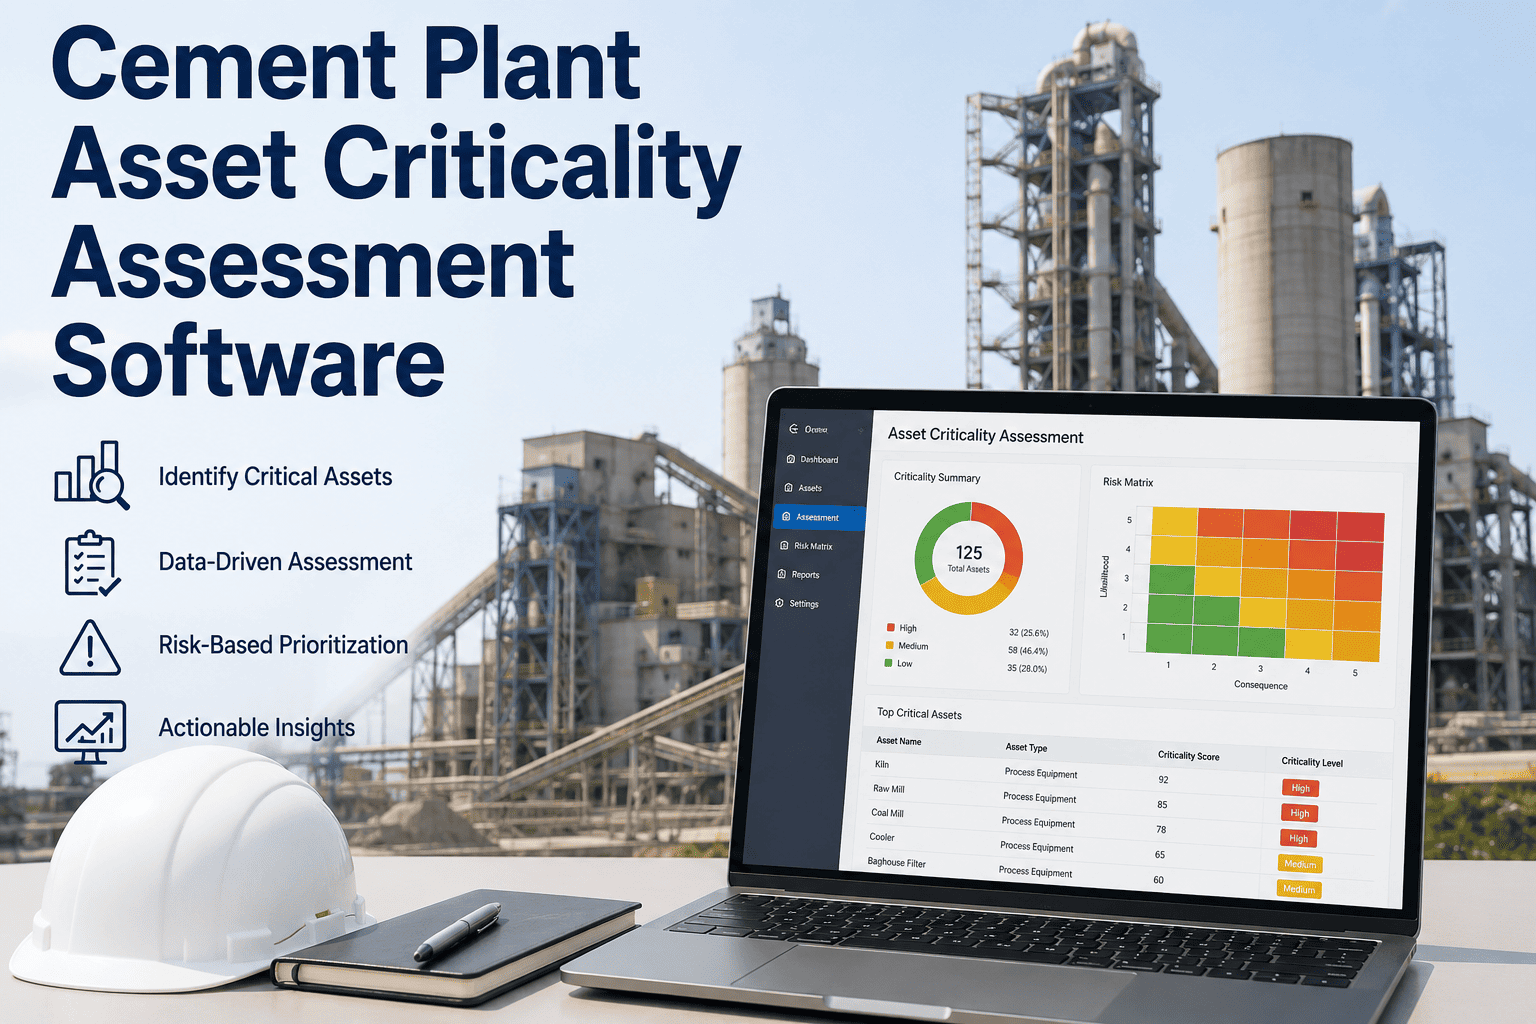
Most cement plants maintain all 2,000-plus assets the same way — identical PM frequency, identical spares buffer, identical engineering attention — whether a failure stops the kiln or just scuffs a guard rail. Asset criticality ranking replaces that flat approach with a scored, defensible priority list built from production impact, safety and environmental consequence, and failure probability. Plants that build a working criticality matrix typically cut unplanned outage hours by 30 to 50% within the first year, simply by pointing existing maintenance budget at the equipment actually responsible for the downtime. This article walks through the scoring model, the bands it produces, and where most plants lose the discipline within eighteen months — plus how a criticality engine wired directly into work-order priority can book a demo for your plant.
ARTICLE · ASSET PERFORMANCE MANAGEMENT
Asset Criticality Ranking: Turning 2,200 Assets Into a Priority List
A composite score built from production impact, safety and environmental consequence, and failure probability sorts every asset in the plant into a criticality band — and that band, not tradition or habit, decides PM frequency, spares stocking, and how much engineering attention each machine actually earns.
~2,200
Maintainable assets in an average cement plant
30–50%
Unplanned outage hour reduction, year one
22–35%
PM spend avoided on non-critical assets
$4M–$12M
Annual maintenance cost reduction, comparable plants
Why Flat Maintenance Fails at Plant Scale
A mid-size 1.8 MTPA kiln line carries somewhere between 150 and 300 assets tracked in the CMMS, and a full plant population usually runs closer to 2,200 once you count instrumentation, valves, and auxiliary drives. Treating that entire population as equally important is the fastest way to overspend on the wrong equipment while the machine that actually takes the plant down sits on a generic six-month PM cycle. The four patterns below repeat across almost every plant that has never formalized a criticality score.
01
Same PM Frequency Everywhere
A raw mill drive gearbox and a secondary conveyor gearbox often sit on the identical quarterly PM interval because both are classified simply as "drives" in the CMMS. One failure stops the whole line; the other has a redundant path. The interval was set by asset class, not by consequence.
02
Spares Budget Spread Thin
Without a ranked list, spares stocking decisions default to purchase price and lead time rather than failure consequence. Plants end up carrying safety stock for low-impact pumps while a single-point-of-failure kiln drive bearing has a six-week lead time and zero stock on the shelf.
03
Engineering Attention Misallocated
Reliability engineers spend equal review time across every asset class instead of concentrating FMEA and vibration analysis on the 15 to 20% of assets that cause roughly 80% of unplanned downtime. The analysis effort never matches where the actual production risk lives.
04
No Defensible Basis for Capex
When a reliability engineer asks for budget to replace an aging kiln support roller, the request competes on gut feel against every other capital ask in the plant. A documented criticality score turns that request into a number a plant manager can defend to corporate finance.
The Three-Factor Scoring Model
Every established criticality methodology — ISO 14224, SAE JA1011, IEC 60812 — reduces to the same three inputs scored on a 1-to-5 scale and combined into a single weighted composite. The weighting below reflects how most cement plants balance the three factors, though the exact split should follow your own risk tolerance and regulatory exposure.
Production Impact
Weight: 40%
Scored on hours of production loss and whether the asset has a redundant path. A kiln drive failure that halts the entire line scores a 5; a duplicated cooling fan with an installed spare scores a 2. This factor alone typically explains most of the variance in a plant's composite scores.
Safety & Environmental Consequence
Weight: 35%
Scored against injury potential, emissions exceedance risk, and regulatory reporting exposure. Pressure vessels, kiln shell integrity, and baghouse dust collection systems score high here regardless of their production impact score, because a failure carries consequences beyond lost tonnage.
Failure Probability
Weight: 25%
Scored from MTBF history, condition-monitoring trend data, and asset age against design life. An asset with a clean failure history and a stable vibration trend scores low even if its production impact is severe — probability tempers consequence rather than overriding it.
Score It Yourself: Kiln Shell vs. Auxiliary Conveyor
The fastest way to understand the model is to run two real assets through it side by side. Below is a simplified scoring pass on a kiln shell section and a plant-yard auxiliary conveyor, using the same 1-to-5 scale and the 40/35/25 weighting from the factor model above. Notice how the two composite scores land almost three full points apart even though both assets sit on similar-looking PM schedules in a plant that has never formalized a ranking — that gap is the entire justification for treating them differently.
HIGH CRITICALITY
Kiln Shell Section
Production impact5 / 5
Safety & environmental5 / 5
Failure probability3 / 5
Composite: 4.45 — Band A
Halts the entire kiln line, carries refractory and shell-integrity safety exposure, and has moderate failure probability given consistent thermal scanning. Full RCM analysis, continuous shell scanning, and dedicated spares are non-negotiable.
LOW CRITICALITY
Auxiliary Yard Conveyor
Production impact2 / 5
Safety & environmental1 / 5
Failure probability2 / 5
Composite: 1.65 — Band D
Feeds a buffered stockpile with two days of downstream inventory, carries no meaningful safety exposure, and has a stable failure history. Run-to-failure with a standard inspection round is the economically correct strategy here.
From Composite Score to Criticality Band
The composite score is only useful once it sorts the asset population into bands that drive real maintenance decisions — PM frequency, spares policy, condition-monitoring depth, and how often the score itself gets reviewed. Most cement plants land on four to six bands; the four-band structure below is the most common starting point.
A four-band structure is a starting point, not a permanent fixture. Plants running full RCM programs on their Band A population typically report Overall Equipment Effectiveness approaching 90 to 95%, largely because scarce reliability engineering hours stay concentrated on the roughly 15% of assets that were driving nearly all of the unplanned stops in the first place. Some plants add a fifth or sixth band once the program matures, splitting Band B into a "high-production, low-safety" and "high-safety, low-production" sub-group so that spares policy and condition-monitoring depth can be tuned separately for each. The exact number of bands matters far less than making sure every band maps to a distinct, documented maintenance policy — a band that does not change PM frequency, spares stocking, or review depth is not really a band, it is just a label.
Building the Criticality Register: A Four-Step Rollout
A first-pass criticality register does not require a six-month consulting engagement. Most cement plants can produce a defensible, band-ready score across the full asset population in four to six weeks by working through the same four steps, in the same order, every time.
Step 1
Pull the Full Asset List From the CMMS
Export every maintainable asset currently tracked in the CMMS, not just the ones reliability engineering already suspects are important. A plant with 2,200 registered assets typically finds another 200 to 400 that were never formally added to the hierarchy — instrumentation, small motors, and auxiliary skids that still deserve a band even if that band ends up being low.
Step 2
Score the Population Against the Three Factors
Run every asset through the production impact, safety and environmental consequence, and failure probability scale described above. Cross-functional input matters here — a reliability engineer alone will consistently under-weight safety exposure that an EHS lead would catch immediately, and vice versa for production-impact assumptions that only operations fully understands.
Step 3
Assign Bands and Sync Them to Work-Order Priority
Apply the composite score to sort every asset into a band, then push that band into the CMMS so work orders inherit priority automatically. This is the step most spreadsheet-based programs skip, and it is the single biggest reason those programs stop influencing daily maintenance decisions within a year.
Step 4
Set a Review Cadence Tied to Real Triggers
Schedule an annual weighting review with plant management and EHS, and define the specific plant changes — new equipment, bypassed lines, rerated capacity — that force an immediate re-score for the affected process area rather than waiting for the next calendar review to catch up.
Where Criticality Programs Break Down
Most cement plants have run at least one criticality ranking exercise. Few keep it operationally useful past the first year. The methodology itself is well established — ISO 14224, SAE JA1011, and IEC 60812 have been documenting the process for decades — so the failure is almost never in the scoring model. It is in what happens after the workshop ends and the plant goes back to normal operations. The same four failure patterns explain almost every program that quietly stopped mattering.
The Score Lives in a Spreadsheet
The criticality study sits in an Excel file on a reliability engineer's laptop. The CMMS never learns which assets are Band A, so PM frequencies stay generic and the entire exercise becomes decorative documentation rather than an operating input.
No Link to Work-Order Priority
Even when the band is recorded somewhere, the CMMS work-order queue still triages by ticket age or requester urgency instead of asset criticality. A Band D pump request can sit ahead of a Band A kiln drive alarm simply because it was logged first.
Never Re-Scored After Plant Changes
The plant adds a precalciner, bypasses a coal mill, or rerates a steam turbine, and the criticality scores from three years ago keep driving PM schedules for an asset configuration that no longer exists.
Weighting Set Once, Never Challenged
The 40/35/25 weighting gets chosen in a single workshop and never revisited, even as regulatory exposure changes or a new safety incident shifts the plant's actual risk tolerance away from the assumptions baked into the original model.
See Your Own Asset Register Scored and Banded
Send your current CMMS asset export and iFactory's reliability team returns a first-pass criticality score across your full population — production impact, safety consequence, and failure probability, banded and ready to drive PM priority.
How iFactory Operationalizes Criticality Ranking
A criticality score only pays off when it is wired into the systems that actually run daily maintenance decisions. iFactory's Asset Management and Analytics modules keep the score current and connect it directly to the work order queue, spares planning, and condition-monitoring assignment — the four places most spreadsheet-based programs never reach. Instead of a one-time workshop output that ages out within eighteen months, the band becomes a living attribute of the asset record, recalculated as new work-order history, condition data, and plant configuration changes arrive, so planners are always prioritizing against the current state of the plant rather than a snapshot from years ago.
A
Automated Scoring From Work-Order History
iFactory generates an initial ranked asset register directly from existing work-order history, downtime logs, and safety incident records — reducing a scoring exercise that traditionally takes 40 hours per major asset class down to a fraction of that.
B
CMMS Priority Sync
Once an asset's band is set, every work order raised against it inherits that priority automatically. A Band A alarm routes ahead of a Band D request in the queue by default, without a planner manually re-sorting tickets each morning.
C
Condition-Based Re-Scoring
Failure probability inputs update automatically as new vibration, thermal, and oil-analysis data arrives, so a composite score reflects current asset condition rather than a static assumption made during the original workshop.
D
Spares & Budget Allocation Dashboard
Spares stocking recommendations and capital request justifications pull directly from the current band, giving planners and finance a shared, defensible number instead of a purchase-price-driven guess or a gut-feel capex request.
What Plants Report After a Working Criticality Program
The financial case for criticality ranking is not a single number — it shows up across outage hours, PM spend, spares carrying cost, and how defensible the next capital request becomes. The figures below reflect what comparable cement facilities report after wiring criticality scores into daily maintenance decisions.
30–50%
Unplanned outage hour reduction, first year
22–35%
PM spend avoided by de-prioritizing low-band assets
90–95%
OEE reported at full RCM adoption on Band A assets
12–18 mo
Typical window to see documented availability lift
None of these figures come from a single lever. The outage-hour reduction traces back to concentrating condition monitoring and RCM analysis on Band A and Band B equipment instead of spreading it evenly across the register. The PM spend reduction comes from correctly de-prioritizing Band D assets that were absorbing calendar-based preventive labor they never needed. The OEE figure reflects what happens when spares, condition monitoring, and engineering review all point at the same short list of assets instead of competing for attention across the full 2,200-asset population. And the twelve-to-eighteen-month window matters for planning purposes — a criticality program is not a quarter-over-quarter initiative, it is closer to a capital project with a defined payback period, and it should be budgeted and reported that way to plant leadership and corporate finance alike.
Frequently Asked Questions
The questions reliability engineers and plant managers ask most often before starting a criticality ranking project.
How many of our 2,000-plus assets actually need a criticality score?
All of them get a score, but most of the analysis effort should concentrate on the top tier. A typical plant finds that 15 to 20% of assets, once ranked into Band A and Band B, account for roughly 80% of unplanned downtime hours. The remaining assets still need a band assignment so PM frequency and spares policy follow a rule rather than habit, but they do not need full FMEA treatment. Start with a rough pass across the full register, then reserve deep RCM analysis for the top two bands. To see how this splits out across your own asset list,
book a demo and bring a CMMS export.
Who should own the weighting between production, safety, and failure probability?
The weighting decision belongs to a cross-functional group, not a single reliability engineer working alone. Plant management sets the risk tolerance, EHS confirms the safety and environmental scoring criteria, and reliability engineering translates both into the probability inputs drawn from maintenance history, work-order records, and condition-monitoring trend data collected across the plant. Most cement plants land near a 40/35/25 split across production, safety, and probability, but a plant with recent regulatory exposure or a safety incident history often shifts more weight toward the safety and environmental factor. Review the weighting annually rather than setting it once and leaving it untouched for years.
How often does a criticality score need to be recalculated?
Two triggers matter more than a fixed calendar. First, any material plant change — a new precalciner, a bypassed coal mill, a rerated turbine — should trigger a re-score for every asset in that process area, since the original consequence assumptions no longer hold. Second, failure probability inputs should update continuously as new condition-monitoring data arrives, rather than waiting for an annual workshop. A criticality score tied only to a calendar review cycle drifts out of date within about eighteen months, which is exactly the pattern that makes most spreadsheet-based programs stop being useful. Plants that keep the register accurate over time typically build re-scoring into the change-management process itself, so that a capital project sign-off automatically triggers a criticality review for the affected assets rather than relying on someone remembering to update a spreadsheet months later.
Does a low criticality band mean an asset gets no maintenance at all?
No. A Band D score means run-to-failure is the economically correct strategy for that specific asset, not that it gets ignored. Run-to-failure assets still sit on a standard inspection round, and a failure still triggers a work order — it simply does not receive dedicated spares, continuous condition monitoring, or priority queue placement ahead of higher-band assets. The point of the band is to stop spending reliability engineering hours and spares budget on equipment where a failure has minimal consequence, and redirect that budget toward the assets where it actually protects production and safety. In practice, most plants find that Band D still represents a meaningful share of the asset count, so even a modest reduction in inspection frequency or spares carrying cost across that group frees up a noticeable amount of budget without adding any real production or safety risk.
How does this connect to our existing CMMS instead of replacing it?
iFactory does not replace the plant's CMMS, MES, or quality system — it sits alongside them and feeds the criticality band into the work-order priority field the CMMS already uses. Once an asset carries a band, every ticket raised against it inherits that priority automatically, spares reorder points reference the band, and condition-monitoring assignment follows the same score. This is why deployment centers on integration rather than a rip-and-replace project. Reach out to
iFactory support to review how the sync works with your specific CMMS platform.
STOP MAINTAINING BY CALENDAR. START MAINTAINING BY CONSEQUENCE.
Turn Your Asset Register Into a Ranked, Defensible Priority List
Bring your current CMMS export and iFactory's reliability team will return a first-pass criticality score across production impact, safety consequence, and failure probability — banded, ready to drive PM priority, and wired into your existing work-order queue from day one.