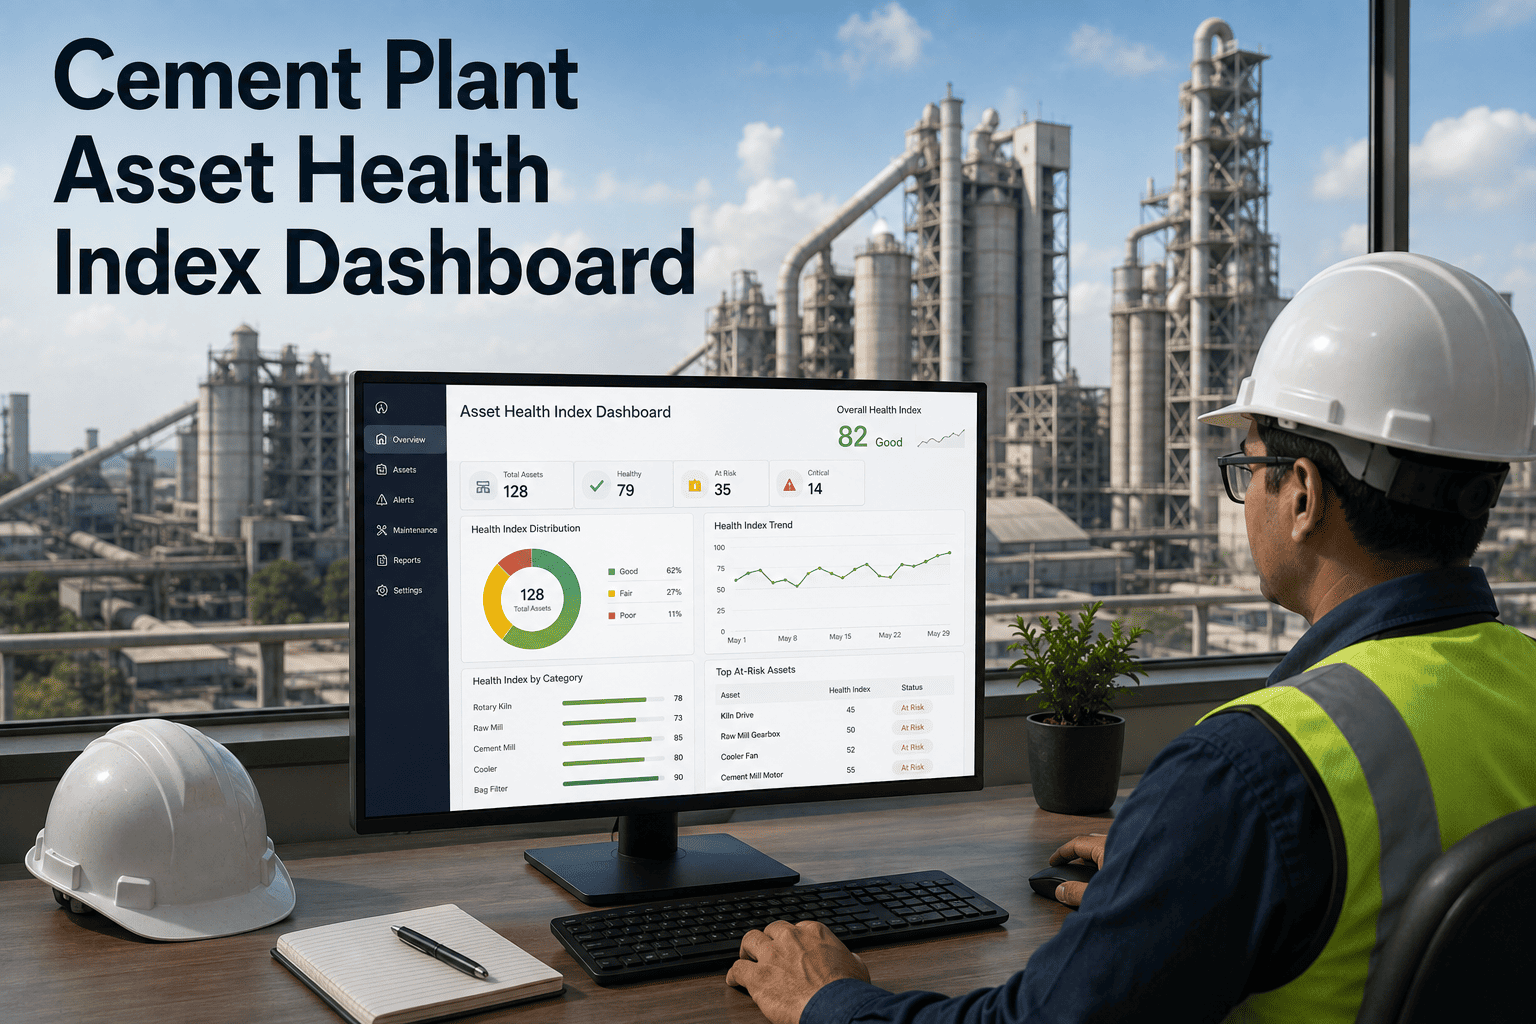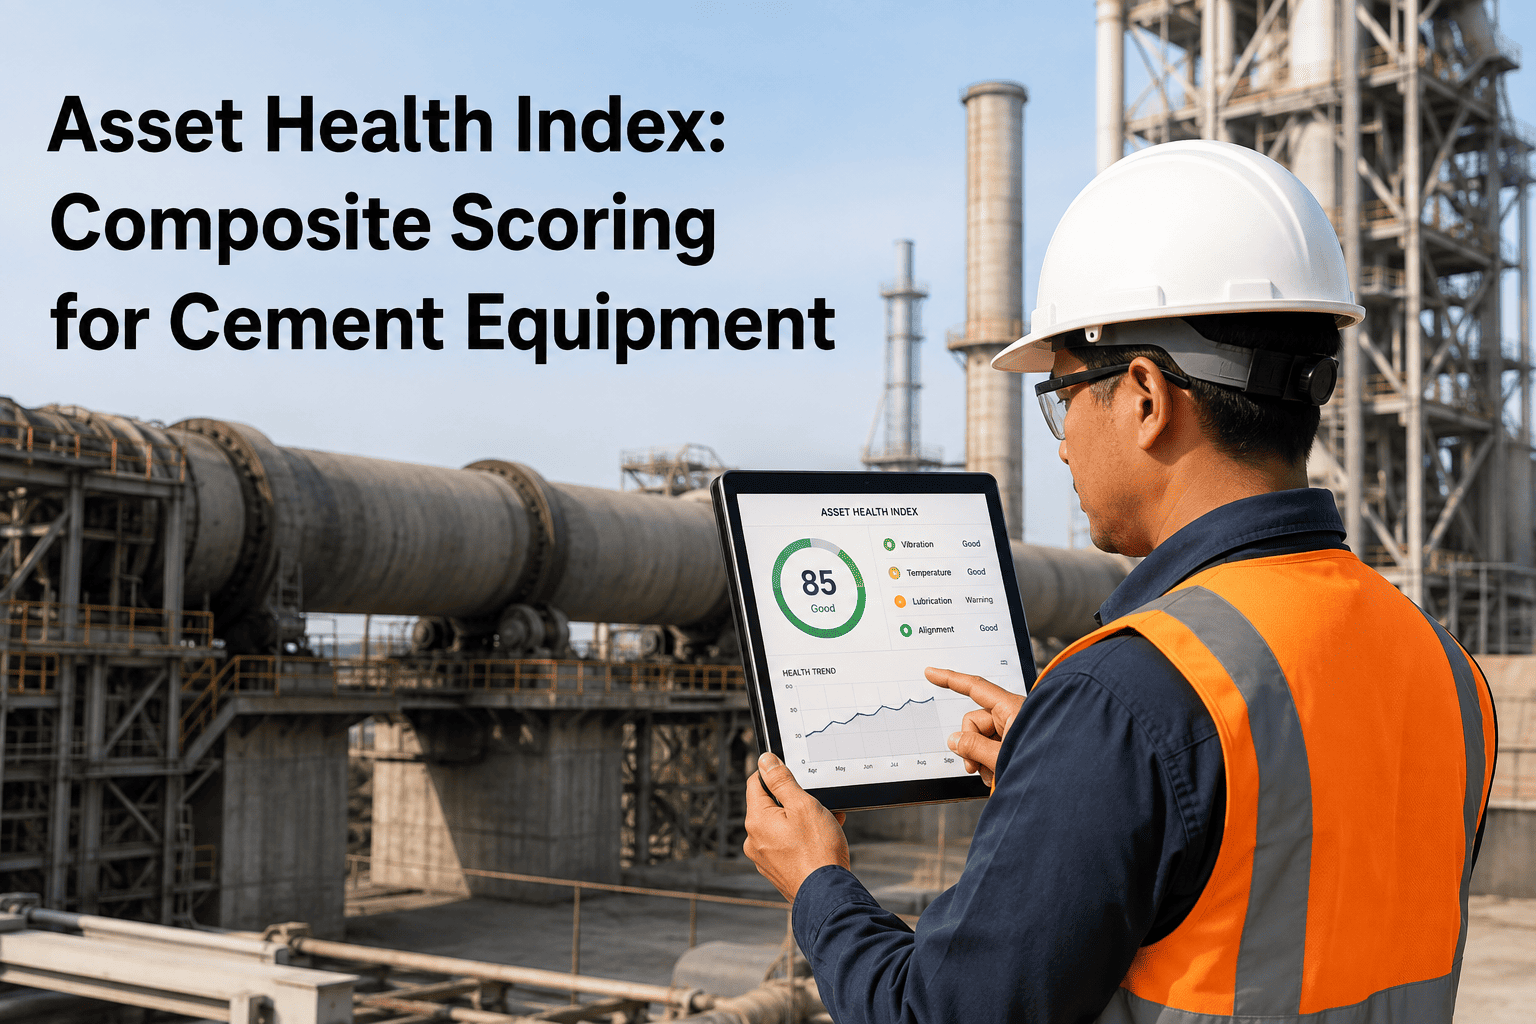
Most cement plants already collect more equipment condition data than anyone actually uses — vibration on the kiln drive, bearing temperature on the raw mill, current draw on the ID fan, oil analysis on the cooler gearbox — each sitting in its own trend, its own threshold, its own silo. When a reliability manager asks "which asset is in the worst shape right now," nobody can answer with a number, only with a debate. A composite asset health index fixes that by rolling every relevant parameter into one comparable score per asset, and a working session with our team can show how it applies to your fleet.
Asset Performance Management · Health Scoring
Asset Health Index: Composite Scoring for Cement Equipment
Turn vibration, temperature, current draw, oil condition, and inspection findings into a single 0-100 health score per asset — weighted by failure mode and criticality, trended over time, and comparable across the entire plant fleet.
92
Raw Mill Fan
Healthy
61
Kiln Drive
Watch
38
Cooler Gearbox
Alert
The Underlying Issue
Why a Single Reading Never Tells the Whole Story
A vibration spike on a mill bearing might mean nothing on its own — bearings run a little rough sometimes and settle back down within a shift or two, and an experienced technician learns to expect that noise in the data. The same spike, arriving alongside a slow rise in bearing temperature and a lubricant sample showing early metal content, means something else entirely, and that combination is exactly the kind of pattern a single-parameter alarm is not built to see. Reliability teams that watch each parameter in isolation catch the second case only after two or three signals have already lined up on their own separate trends, which is often later than they would like, and by that point the failure window has already started to narrow. A composite health index is built specifically to close that gap, because it looks at the combination of signals rather than any one of them alone, and it does so continuously instead of only when someone happens to open a trend screen or run a weekly report. Over time, this shifts the reliability conversation away from reacting to individual alarms and toward managing a small, ranked list of assets whose overall condition is genuinely moving in the wrong direction, which is a far more efficient use of a limited maintenance team's attention than chasing every threshold crossing as it happens.
How Composite Scoring Works
From Raw Signals to a Single Comparable Score
1
Parameter Collection
Vibration, temperature, current draw, oil analysis results, and recent inspection findings are pulled continuously from whatever sensors and systems the plant already has connected.
2
Normalization
Each parameter is converted onto a common 0-100 scale relative to its own healthy range, so a temperature reading and a vibration reading can be compared on equal footing.
3
Failure-Mode Weighting
Parameters are weighted according to how strongly each one predicts the dominant failure modes for that specific asset class, so a bearing-driven asset weights vibration differently than a lubrication-driven one.
4
Composite Score
The weighted parameters combine into one asset-level score, refreshed as new readings arrive, and placed automatically into a health band from Healthy through Critical.
Parameter Reference
What Feeds the Index for Common Cement Equipment
| Asset Class | Primary Parameters | Dominant Failure Mode | Typical Weighting Emphasis |
|---|---|---|---|
| Kiln Drive & Girth Gear | Vibration, tooth contact pattern, oil analysis, current draw | Gear wear, misalignment | Vibration and contact pattern weighted highest |
| Raw Mill / Ball Mill | Bearing vibration, bearing temperature, motor current | Bearing fatigue | Vibration and temperature weighted highest |
| ID / Cooler Fans | Vibration, bearing temperature, imbalance trend | Rotor imbalance, bearing wear | Vibration weighted highest |
| Cooler Gearbox | Oil analysis, temperature, vibration | Lubrication breakdown | Oil condition weighted highest |
| Conveyor Drive Pulleys | Vibration, belt tracking, motor current | Bearing wear, misalignment | Vibration and current weighted evenly |
Scoring Methodology
Why the Same Parameter Can Carry Different Weight on Different Assets
A vibration reading that would be a minor flag on a large, well-supported fan can be a serious flag on a kiln drive where the failure consequence and repair cost are far higher, and treating both readings the same way in a scoring model would either desensitize the fan alarm or oversensitize the kiln alarm. Composite scoring accounts for this by adjusting each parameter's weight not just against its own statistical range, but against how much that parameter actually matters for that specific asset's dominant failure mode and criticality tier, which is closer to how an experienced reliability engineer already reasons through the same data by hand. The result is a score that reflects the plant's actual failure history rather than a generic industry template, and it keeps improving as more inspection findings, oil reports, and eventual failure or repair events feed back into the weighting over successive quarters. This is one of the reasons a composite index tends to become more accurate the longer it runs on a given fleet, since the weighting isn't fixed once and left alone — it continues to sharpen against what the plant's own equipment actually shows before something breaks.
Criticality TierHigher-criticality assets apply tighter thresholds before a parameter starts pulling the composite score down, since the cost of missing an early signal on a kiln-critical asset is far higher than on a redundant one.
Failure Mode LibraryWeighting reflects which parameters have historically preceded failure for that specific equipment type at the plant, drawing on past inspection findings and repair records rather than a generic industry assumption.
Data ConfidenceParameters with sparse or unreliable sensor history carry reduced weight until data quality improves, so a single noisy sensor cannot distort the whole composite score on its own.
Recency BiasRecent readings influence the score more strongly than older ones, so an improving asset recovers its score as it stabilizes rather than staying penalized for a problem that has already been resolved.
See Your Fleet Ranked by Health Score
Most reliability teams have never seen their entire equipment fleet ranked side by side on one comparable scale. A short session shows what that ranking looks like using your own asset list.
Health Trending
Watching the Score Move, Not Just Where It Sits Today
A single health score is useful, but the direction it has been moving over the last few weeks is often more useful still. An asset sitting at 68 and climbing is a very different situation from an asset sitting at 68 and falling five points a week, even though the snapshot number looks identical on the day someone checks it. Trending the composite score over time turns the index from a static report card into an early warning system, since a consistent downward slope through the Watch band is exactly the pattern that historically precedes a move into Alert or Critical, and catching that slope early is usually what separates a scheduled repair from an unplanned one. Plants that trend the score also get a useful secondary benefit: they can see which assets recover on their own after a minor intervention like a lubrication top-up or a belt adjustment, versus which ones keep sliding despite the same kind of fix, which sharpens the judgment calls maintenance planners make about where to spend limited labor hours during the next available window.
85 - 100HealthyOperating within normal range across all weighted parameters
60 - 84WatchOne or more parameters trending away from baseline, worth a closer look
35 - 59AlertMultiple parameters degrading, inspection or intervention recommended
Below 35CriticalFailure risk elevated, near-term action strongly recommended
Applied Example
How a Cooler Gearbox Moves Through the Bands
Consider a clinker cooler gearbox that starts the quarter with a composite score of 88, comfortably in the Healthy band and showing nothing unusual on any individual trend an operator would normally check. Over several weeks, oil analysis begins showing a gradual rise in metal particulate while vibration and temperature both stay essentially flat, and under a traditional single-parameter alarm setup none of the existing thresholds would have tripped, because vibration and temperature are usually what those alarms are built around. The weighting model behind the composite index, however, leans heavily on oil condition for this specific asset class since lubrication breakdown is the dominant historical failure mode for cooler gearboxes at this plant, and it pulls the composite score down to 71 even though most parameters still look normal on their own individual charts. The score continues sliding through the Watch band over the following two weeks and crosses into Alert at 58, well before vibration or temperature would have flagged anything on their own, giving the maintenance team a scheduled window to inspect and address lubrication during a planned stoppage rather than reacting to a gearbox that fails mid-run. By the time the inspection confirms early-stage wear consistent with the oil trend, the team has already ordered the parts and scheduled the labor, which is the practical difference a composite score makes over waiting for a single threshold to be crossed.
Composite Scoring vs Traditional Metrics
How This Differs From an OEE Number or a Single Alarm Threshold
Overall equipment effectiveness tells a plant how well an asset performed against its production plan, and a threshold alarm tells a technician when one specific parameter crossed one specific line — both are useful, but neither one is designed to answer the question a reliability manager actually asks most often, which is simply "how is this asset doing overall, right now, compared to everything else on my list." A composite health index is purpose-built to answer exactly that question, because it is asset-condition-focused rather than production-focused, and it is multi-parameter rather than single-threshold. The two approaches are not competitors; OEE still measures production performance and individual alarms still catch acute, fast-moving problems that a slower-moving composite score would not react to quickly enough. What the index adds is the layer in between — a running, comparable read on gradual condition change that neither OEE nor a single alarm was ever meant to provide, filling a gap that most cement plants have carried for years without a clean way to close it.
OEE
Measures production performance against a plan — availability, performance, and quality — not equipment condition.
Single Alarm
Flags one parameter crossing one threshold, good for acute events, blind to slow multi-signal degradation.
Composite Index
Continuous, multi-parameter, comparable across the whole fleet, tuned to each asset's real failure modes.
Financial Impact
Where a Composite Index Actually Saves Money
The value of a composite health index rarely shows up as one large, easy-to-point-to number, which is part of why it can be underappreciated compared to a more dramatic capital project. Instead it shows up as a series of smaller, compounding savings across a plant's maintenance calendar: a bearing replaced during a planned shutdown instead of during an unplanned outage that stops the kiln, a gearbox rebuild scheduled with parts already on hand instead of expedited at a premium, and a shutdown scope that gets built around a ranked list of the fleet's actual worst assets instead of a list built mostly from memory and whoever complained loudest at the last planning meeting. None of these individually looks like a headline figure on a monthly report, but across a full year of continuous operation at a mid-size cement plant running dozens of critical rotating assets, the combined avoided downtime, avoided expedited parts spend, and better-targeted shutdown labor typically represents a meaningful share of the plant's total unplanned maintenance cost — savings that a fleet without any comparable scoring system simply has no consistent way to capture.
Getting Started
What to Confirm Before Building Your First Composite Index
Plants that stand up a composite health index fastest are usually the ones that walk in already knowing which sensors are online, how much inspection history exists per asset, and which assets sit in the highest criticality tier. That groundwork determines how much of the first implementation phase goes toward configuration instead of discovery.
| Question | Why It Matters |
|---|---|
| Which sensors already report to a historian? | Determines which parameters can be scored immediately versus later |
| Is there a documented criticality ranking? | Shapes how weighting is applied across the asset fleet |
| How much oil analysis and inspection history exists? | Affects how quickly failure-mode weighting can be tuned per asset |
| Who reviews and acts on Alert-band assets? | Defines the workflow a score change needs to trigger |
Reliability teams almost always have enough data to build a good composite index before they realize it — the sensors are already there, the oil reports are already filed, the inspection notes already exist. What is usually missing is a consistent way to bring it all together into one number that means the same thing for every asset. Once that exists, prioritization conversations get a lot shorter, because the fleet is finally speaking the same language.
Marguerite Adeyemi-Voss
Reliability Engineering Lead · 14 years in cement plant asset management and condition monitoring
Common Questions
Asset Health Index Scoring — Frequently Asked
Does the index replace individual parameter alarms like vibration thresholds?
No — individual thresholds continue running as they do today, and the composite score sits alongside them as an added layer that captures how several parameters are moving together rather than any single one in isolation. Book a demo to see how the two layers work side by side.
Can the index work with limited sensor coverage on older equipment?
Yes — the model can start scoring with whatever parameters are actually available for an asset, weighting confidently around what exists, and expand automatically as additional sensors or inspection data get connected later. Contact support to review what your current instrumentation supports.
How are the weighting values decided for each asset class?
Weighting starts from known failure-mode relationships for that equipment type and is then refined against the plant's own inspection and failure history, so the model reflects how that specific fleet actually degrades rather than a generic industry default. Book a session to discuss weighting for your asset list.
How often does the composite score update?
The score updates continuously as new sensor readings and periodic data such as oil analysis results arrive, rather than on a fixed daily or weekly schedule, so a sudden shift in any weighted parameter is reflected as soon as the data comes in. Ask our team about update frequency for your systems.
Can the score be used to prioritize a shutdown work list?
Yes — ranking the fleet by composite score is one of the most common uses, since it gives planners a consistent, comparable basis for deciding which assets deserve inspection or repair time during a limited shutdown window. Book a call to see fleet ranking applied to a shutdown scope.
Give Every Asset in Your Plant One Comparable Score
iFactory combines vibration, temperature, oil analysis, and inspection data into a single composite health index per asset — trended, weighted by failure mode, and ranked across the fleet.