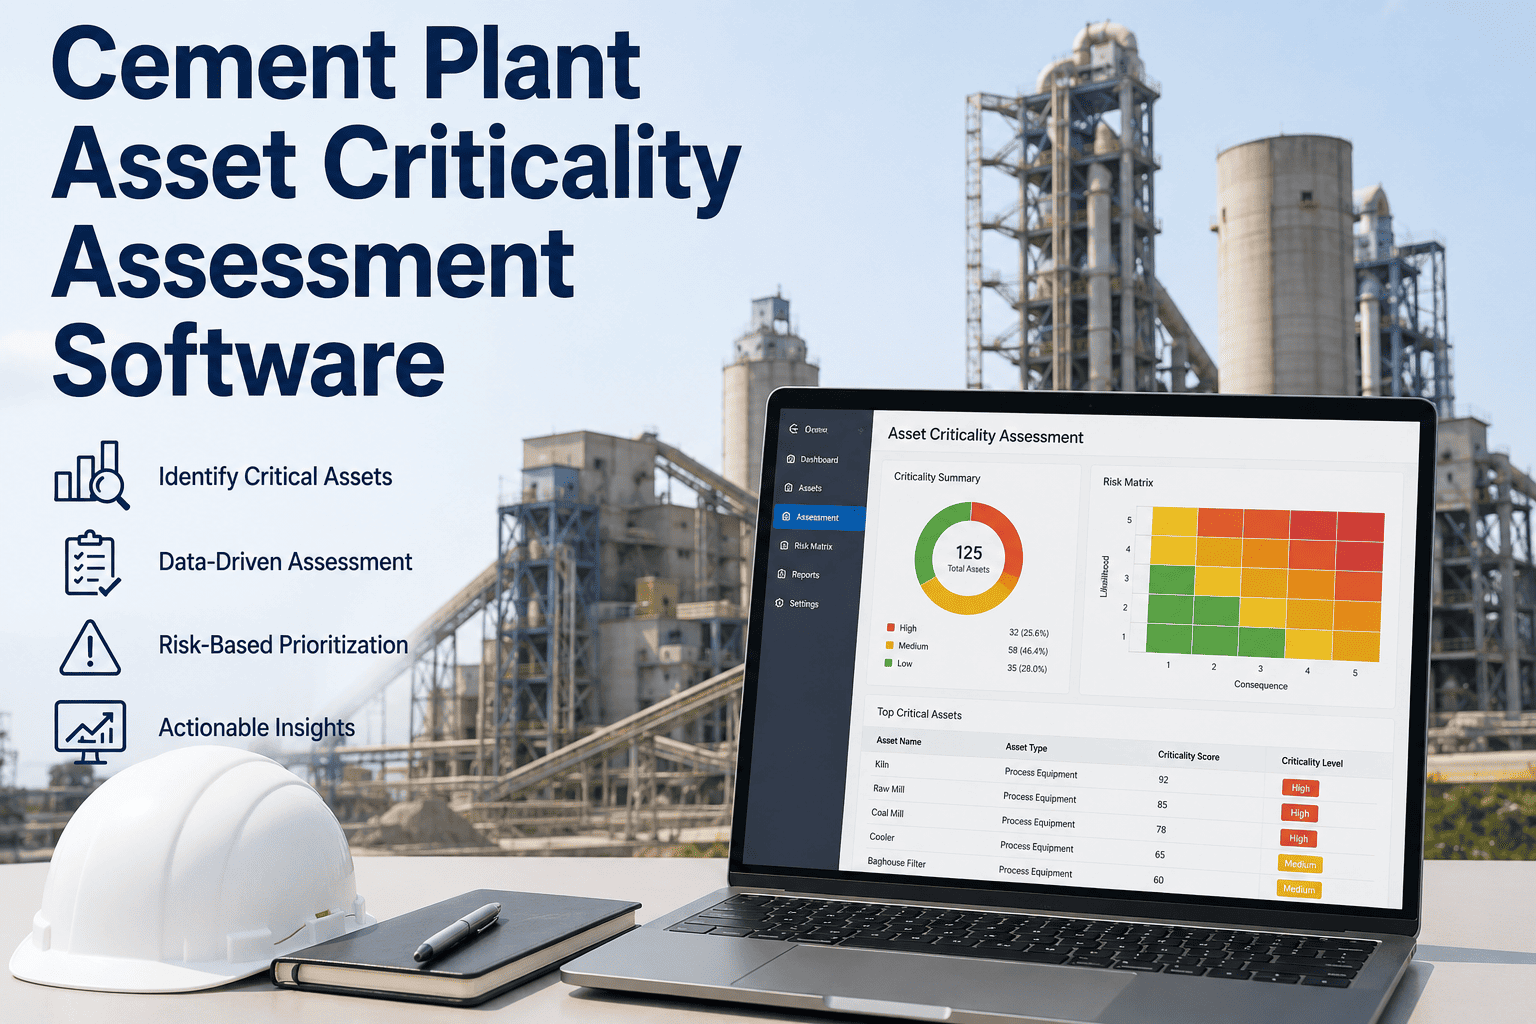
A kiln bearing at one cement plant was scheduled on the exact same 30-day preventive maintenance cycle as the breakroom HVAC unit — until that bearing failed on a Saturday and cost $880,000 in downtime and emergency repair over a single weekend. Every asset in a plant is not equally important, yet most maintenance schedules are built as if they were. A structured criticality assessment scores every asset by what actually happens when it fails — not its age, not how loudly it's been squeaking lately — so your team's limited hours go where the real risk sits. See how iFactory operationalizes this at Book a Demo.
Not Every Asset Deserves The Same Maintenance Attention
iFactory scores every maintainable asset in your plant across six risk dimensions and embeds that score directly into your CMMS — driving PM frequency, work order priority, and spares stocking automatically, instead of sitting untouched in a spreadsheet reviewed once a quarter.
Six Dimensions Behind A Defensible Criticality Score
A criticality score that can't survive a CFO asking "why this asset, and why now?" isn't worth building. iFactory's scoring framework combines six factors that, together, produce a ranking your team can defend in a budget meeting rather than one built on gut feel or whichever asset failed most recently.
Production Impact
Downtime hours, throughput loss, and quality impact if the asset fails — for a kiln main drive, hundreds of tonnes per hour of clinker multiplied by hours-to-restart.
Safety Risk
Personnel risk from the specific failure mode, weighted heavily regardless of how the other five dimensions score, since no production or cost calculation offsets a safety consequence.
Environmental Consequence
Emissions, spill, or regulatory exposure created by a failure — particularly relevant for baghouse, ESP, and containment systems tied to permit compliance.
Replacement & Repair Cost
The direct capital cost of repairing or replacing the asset, independent of the downtime it causes — a factor that changes the calculus for high-value, long-lead-time components.
Lead Time Exposure
How long it takes to source a replacement part or component, since a six-to-twelve-month lead time on a kiln tire turns a routine failure into an extended outage.
Detectability
How early a developing failure can realistically be caught before it becomes unplanned downtime — an asset with poor detectability deserves a higher score even at moderate failure likelihood.
Cement plants and power plants weight these six dimensions differently — cement operations tend to over-weight production impact given the continuous nature of kiln operation, while power plants over-weight safety and grid-stability exposure — but all six belong in the calculation regardless of which industry is doing the scoring.
How A Criticality Score Actually Gets Calculated
Beneath the six weighted dimensions sits a simpler underlying formula that many reliability engineers will already recognize: Risk Priority Number, or RPN, calculated as Severity multiplied by Occurrence multiplied by Detection, each typically rated on a scale from 1 to 10.
| Factor | What It Measures | Scale |
|---|---|---|
| Severity | Impact of the failure on operations, safety, or compliance if it occurs | 1 (negligible) to 10 (catastrophic) |
| Occurrence | Likelihood of this failure mode happening, based on historical frequency | 1 (rare) to 10 (frequent) |
| Detection | How likely current monitoring is to catch the failure before it happens | 1 (easily detected) to 10 (undetectable) |
A kiln main drive bearing with high severity, moderate occurrence, and poor detectability under a manual walk-down inspection regime produces a far higher RPN than a conveyor idler roller with the same severity rating but excellent detectability under routine visual inspection — even though both might look equally "important" on a simple age-based maintenance list.
Stop Scheduling Your Kiln Bearing Like A Breakroom HVAC Unit.
iFactory's criticality scoring identifies the 15-20% of assets driving most of your downtime risk, and keeps that ranking visible every shift.
Turning A Criticality Number Into A Maintenance Strategy
Running a full Reliability Centered Maintenance analysis on every asset simultaneously is neither practical nor economically justified — a rigorous failure mode analysis for a single complex asset can require 40 to 80 hours of facilitated time from operations, maintenance, and engineering. Criticality tiering exists specifically to concentrate that expensive, detailed analysis on the assets where it earns its cost.
Plants that implement this kind of formal criticality matrix and let it actually drive scheduling — rather than treating it as a one-time exercise — report reducing unplanned downtime by up to 47% within twelve months, largely because maintenance hours stop being spread evenly across assets that carry wildly uneven consequences when they fail.
Where Cement Plant Equipment Typically Falls On The Criticality Curve
While every plant's specific scoring depends on its own layout, redundancy, and process configuration, certain equipment classes consistently rank at the top of the criticality curve across integrated cement plants.
Rotary Kiln System
Universally the highest-criticality asset in a cement plant. It runs continuously at extreme temperature, has the longest repair lead times of any component in the plant, and a shell or bearing failure halts the entire production line, typically costing $30,000 to $80,000 per day in lost production.
Ball Mills & Vertical Roller Mills
Second-highest priority, driven by extreme abrasion exposure and significant energy consumption tied to grinding efficiency — bearing temperature, liner wear, and gearbox oil condition are the leading indicators worth the closest monitoring.
Raw mill systems and coal mills typically follow as medium-priority targets, while structural components, motors, and gearboxes across all major rotating equipment remain the specific monitoring points worth prioritizing within each of these asset classes, regardless of which overall tier the parent equipment falls into.
The Numbers Behind A Properly Operationalized Criticality Program
A Score In A Spreadsheet Changes Nothing. A Score In Your CMMS Changes Everything.
The single biggest factor separating plants that get real value from criticality ranking from those that don't has nothing to do with the sophistication of the scoring model itself. It comes down to whether the score actually lives inside a system that acts on it every day.
Static Spreadsheet Approach
A criticality exercise is run once, results get stored in a spreadsheet, and it is reviewed — if at all — during an annual planning cycle, drifting further from operational reality with every passing month as equipment ages and process conditions change.
Embedded CMMS Approach
The score sits directly in the asset record and automatically drives PM frequency, work order priority, and spares stocking levels — visible and acted upon every single shift, not rediscovered once a year during budget season.
Without a criticality score embedded this way, every capital request tends to look identical to a budget reviewer — a machine that's simply old, with no risk quantification attached. iFactory's asset hierarchy and scoring engine translates the criticality ranking directly into automated maintenance strategy, so a Tier 1 asset automatically receives more intensive scheduling and faster work order response targets, and the reliability team has a documented, risk-scored justification ready the moment a capital conversation comes up.
Before we built out a real criticality matrix, our kiln main drive bearing and the breakroom HVAC unit were on the exact same 30-day inspection cycle — nobody had ever sat down and asked whether that made sense. iFactory's scoring engine gave us a defensible, six-factor ranking we could actually show engineering leadership, and it now drives our PM scheduling and spares stocking automatically instead of living in a spreadsheet nobody opens after the initial workshop.
Frequently Asked Questions
Q: Who actually assigns the criticality score for each asset?
iFactory's scoring engine guides your maintenance engineers through each of the six scoring dimensions using a structured framework, rather than asking one person to assign a number from memory. Missing operational context gets enriched using available engineering references such as P&IDs, OEM documentation, and existing maintenance history, and an initial baseline score is generated across the full asset base using equipment class and failure impact mapping. High-impact and edge-case assets are then reviewed and calibrated by your team to ensure the scoring reflects actual plant behavior, not just a generic industry template. Reach out through Support Contact to see how this scoring workflow fits your current engineering team structure.
Q: How long does a full plant-wide criticality assessment take?
Because iFactory generates an initial baseline score across the entire asset base automatically using equipment class and process context, the assessment doesn't require a facilitated workshop for every single asset the way a full RCM analysis would. Most plants complete an initial baseline scoring pass within a matter of weeks, then spend additional time calibrating scores specifically on high-impact and edge-case assets where automated equipment-class assumptions may not fully capture plant-specific operating conditions or redundancy configurations.
Q: Does a criticality score replace the need for full RCM or FMEA analysis?
No, and it isn't meant to. Criticality tiering is specifically what tells you where full Reliability Centered Maintenance analysis is worth its considerable time investment in the first place. Running a rigorous failure mode analysis on every asset in the plant simultaneously would consume far more facilitated hours than most reliability teams have available; criticality scoring identifies the Tier 1 assets where that 40-to-80-hour investment per asset is clearly justified, while lower-tier assets are managed through standard PM scheduling without needing the same depth of analysis.
Q: Will this integrate with the CMMS we already use?
iFactory's criticality scoring is designed to embed into your existing asset hierarchy and CMMS work order system rather than requiring a separate standalone scoring tool that lives disconnected from where maintenance decisions actually get made. Once a score is assigned, it automatically informs PM frequency, work order priority, and spares stocking recommendations inside the system your team already uses day to day. A Book a Demo session can walk through integration specifics for your CMMS.
Q: How often should criticality scores be reviewed and updated?
Criticality is not a one-time exercise, since production configurations, redundancy, and failure history all shift over time in ways that can change an asset's true risk profile. A conveyor that was single-path and highly critical last year might become significantly lower risk once a redundant path is installed, and an asset with a clean failure history for a decade may see its occurrence score rise sharply after a new failure mode emerges. iFactory keeps scores current by incorporating new maintenance history and work order data continuously, rather than requiring a full re-assessment workshop to catch changes like these. Contact Support Contact for details on review cadence for your plant.
Give Your Capital Requests A Risk Score, Not Just An Age.
iFactory's criticality assessment gives your reliability team a defensible, six-dimension ranking that drives real maintenance decisions every shift.