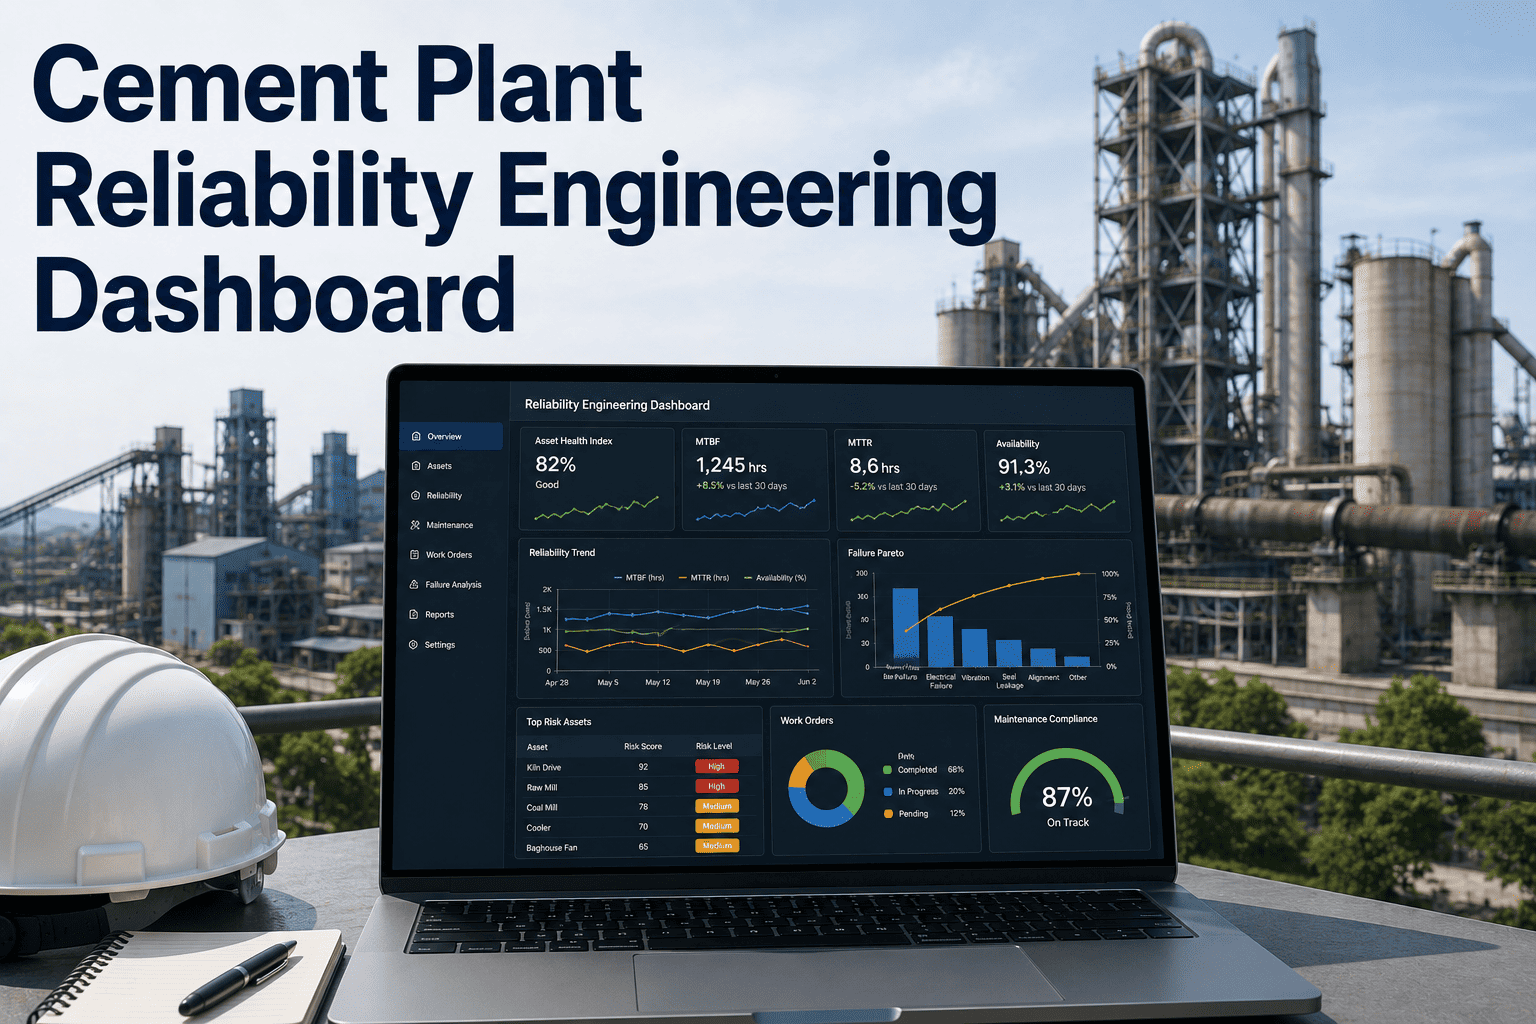
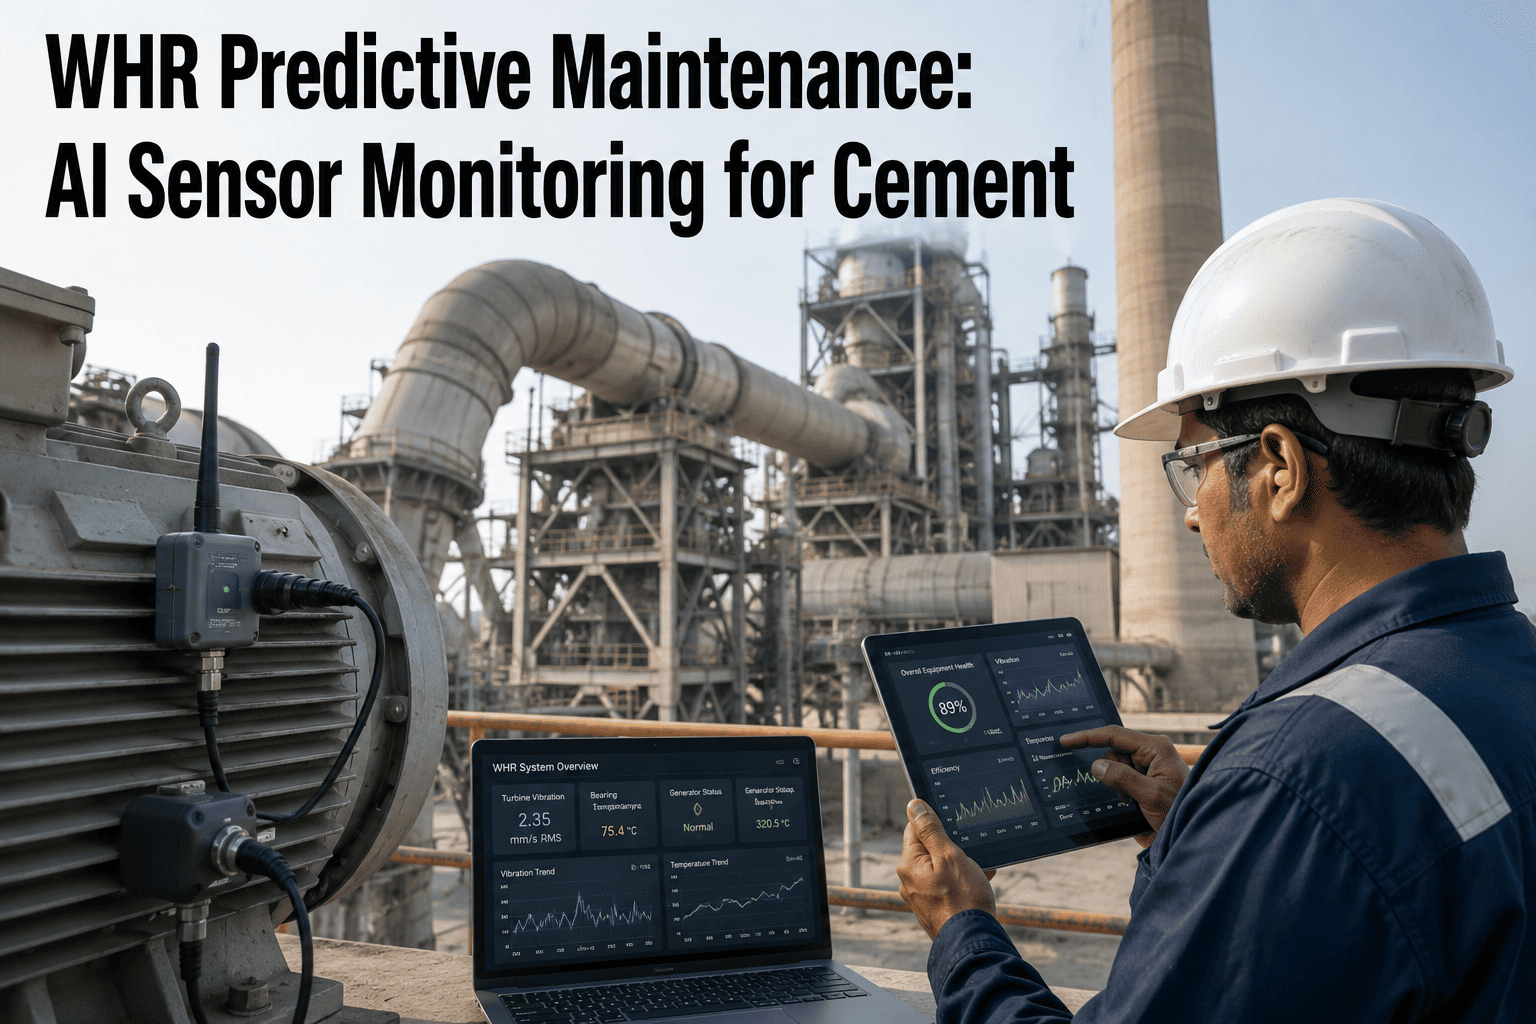
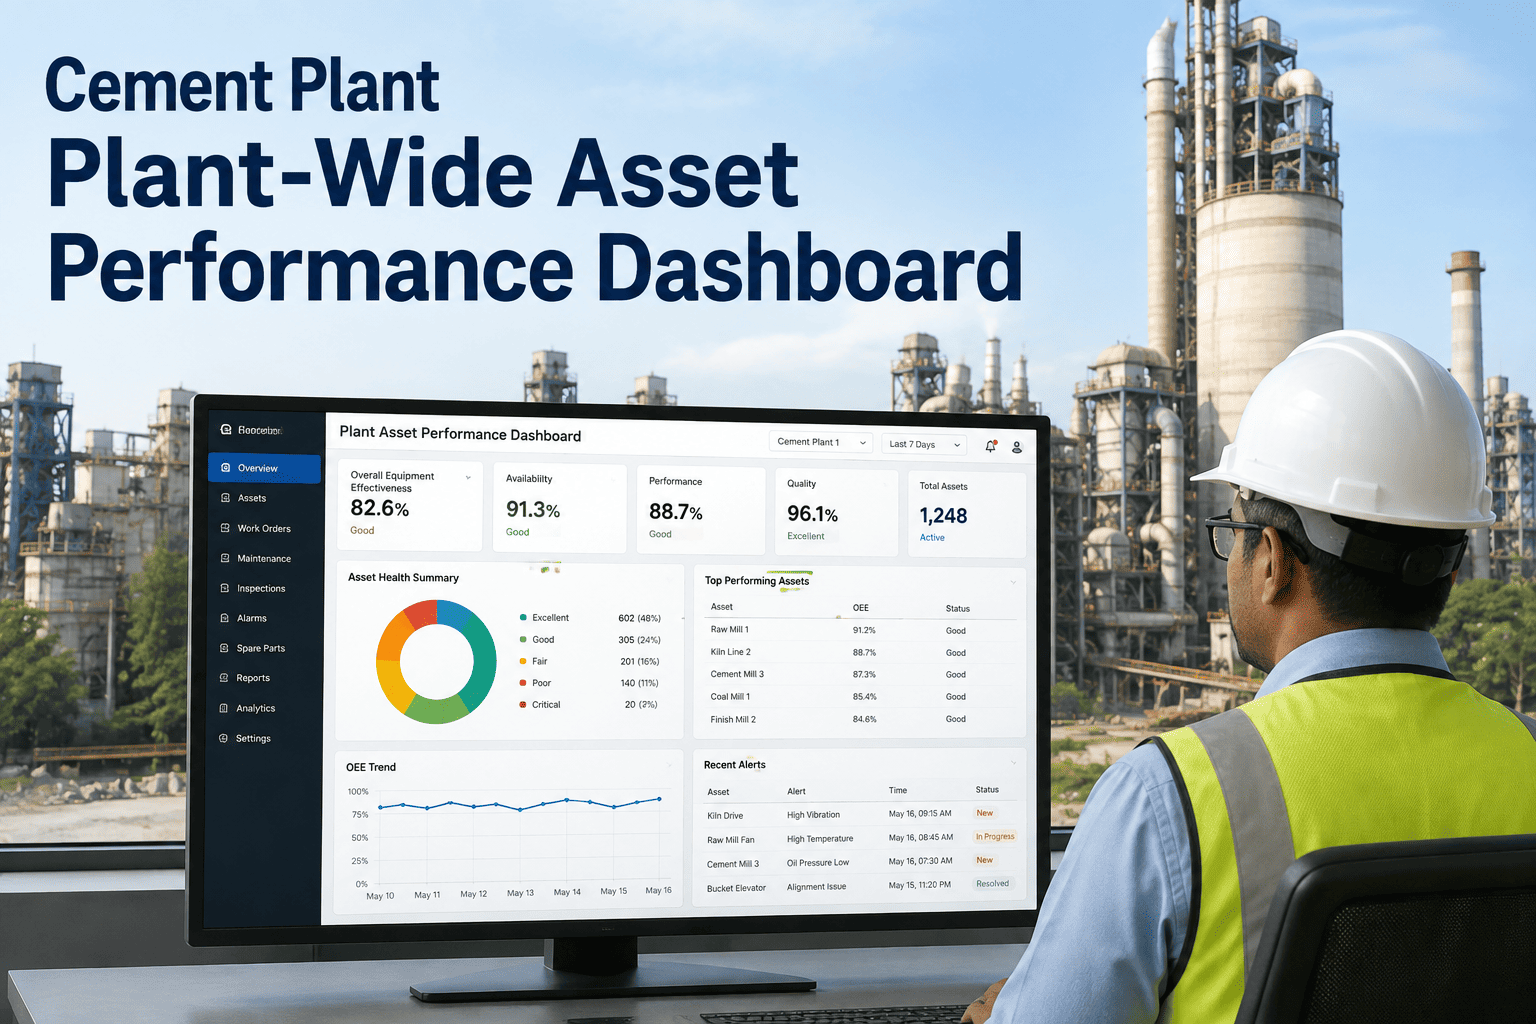
Cement plants operate in a continuous, abrasive, high-temperature environment where an unplanned kiln shutdown can cost upwards of $300,000 per day in lost clinker production and thermal damage. Reliability engineers have invested heavily in vibration sensors, thermography, and oil analysis, but the data from these systems often lives in isolation — vibration in one software platform, work orders in the CMMS, and operating parameters in the DCS. The result is a reliability team that is data-rich but insight-poor, reacting to alarms rather than predicting failures. An AI-driven reliability engineering dashboard unifies these fragmented data streams into a single asset performance view, applying machine learning to detect the subtle degradation patterns that precede mechanical failure in rotating equipment. Book a demo to see how this unified view transforms maintenance prioritization in cement operations.
RELIABILITY ENGINEERING · CEMENT MANUFACTURING · PREDICTIVE MAINTENANCE
The Cement Plant Reliability Dashboard That Connects Vibration Data to Shutdown Prevention
Stop guessing which mill or fan is about to fail. An AI-driven reliability dashboard unifies CMMS, SCADA, and condition monitoring to surface the exact assets at risk, the failure mode, and the remaining useful life.
$300K+
Average Cost of an Unplanned Kiln Shutdown Per Day
62%
Of Cement Rotating Equipment Failures Show Detectable Preceding Vibration Changes
4.2x
Return on Investment for AI-Driven Reliability Dashboards in Year One
35%
Reduction in Emergency Work Orders After Dashboard Deployment
THE DATA FRAGMENTATION PROBLEM
Your Reliability Sensors Are Working — Your Data Integration Is Not
Most cement plants have a robust condition monitoring infrastructure. Accelerometers on vertical roller mills, temperature sensors on kiln tire bearings, and oil analysis programs for gearboxes are standard. The failure is not in the collection; it is in the synthesis. When a reliability engineer needs to determine the health of a critical raw mill, they must log into the vibration monitoring software, export a trend, open the CMMS to check the last lube oil change, and pull DCS trends for operating temperature and load. This manual correlation takes hours and is typically only performed after an alarm has already escalated, which is too late for proactive intervention.
CMMS ISOLATION
The CMMS knows that the gearbox had a bearing replacement eight months ago and that there have been three minor lubrication work orders since. It does not know that the vibration velocity on the output shaft has increased by 2.5 mm/s over the last six weeks. The maintenance history exists without the current health context, making it impossible to correlate past interventions with present degradation trajectories.
SCADA ISOLATION
The DCS knows that the mill motor is drawing 15% more amperage than the baseline for the current feed rate, and that the differential pressure across the separator is high. It treats these as process variables, not reliability indicators. An experienced operator might recognize the combination as a mechanical drag issue, but the system itself does not flag it for the reliability team.
CONDITION MONITORING ISOLATION
The vibration system detects a developing inner race defect frequency on the pinion bearing. It generates an alarm. But without the context of the operating load from SCADA and the lubrication contamination level from the oil analysis, the reliability engineer cannot accurately estimate the remaining useful life. The alarm is either ignored due to alarm fatigue or acted upon with an unnecessary emergency shutdown.
UNIFIED DASHBOARD
The AI-driven reliability dashboard merges the vibration trend, the amperage deviation, the oil particle count, and the maintenance history into a single asset health score. The system recognizes that a high vibration reading at low load is more concerning than the same reading at peak load. It presents a synthesized risk profile: the pinion bearing has a 78% probability of requiring intervention within 21 days, allowing the team to schedule the replacement during a planned stop.
CORE RELIABILITY KPIs
Six KPIs Every Cement Reliability Dashboard Must Visualize — And Why Most Plants Track Them Wrong
A reliability dashboard is only as valuable as the metrics it surfaces. However, simply displaying a number on a screen is not enough — the metric must be contextualized against the asset hierarchy, the operating conditions, and the historical baseline. The six KPIs below are the foundation of cement plant reliability engineering, presented here with the visualization logic that turns a raw number into an actionable engineering insight.
Mean Time Between Failures (MTBF)
MTBF measures the average operating time between functional failures of a specific asset. In cement, tracking MTBF at the plant level is nearly useless — it averages the highly reliable bagging equipment with the failure-prone kiln auxiliary systems. The dashboard must calculate MTBF at the critical asset level — the raw mill, the kiln main drive, the clinker cooler — and trend it over rolling 12-month periods. A declining MTBF on the coal mill over three consecutive quarters is a systemic reliability signal that no single failure event can communicate.
HEALTH TARGET: 90+ DAYS
CURRENT: 76 DAYS — TRENDING DOWN
Mean Time To Repair (MTTR)
MTTR measures the average time required to restore an asset to service after a failure. In cement, MTTR is frequently inflated not by the repair itself, but by the time spent waiting for parts, waiting for the kiln to cool, or waiting for crane availability. The dashboard must decompose MTTR into active repair time, logistics delay time, and access delay time. If active repair time is four hours but total MTTR is eighteen hours, the reliability problem is not technical — it is spare parts management and shutdown logistics.
HEALTH TARGET: UNDER 8 HOURS
CURRENT: 12.4 HOURS — LOGISTICS DELAY DOMINANT
Asset Health Index (AHI)
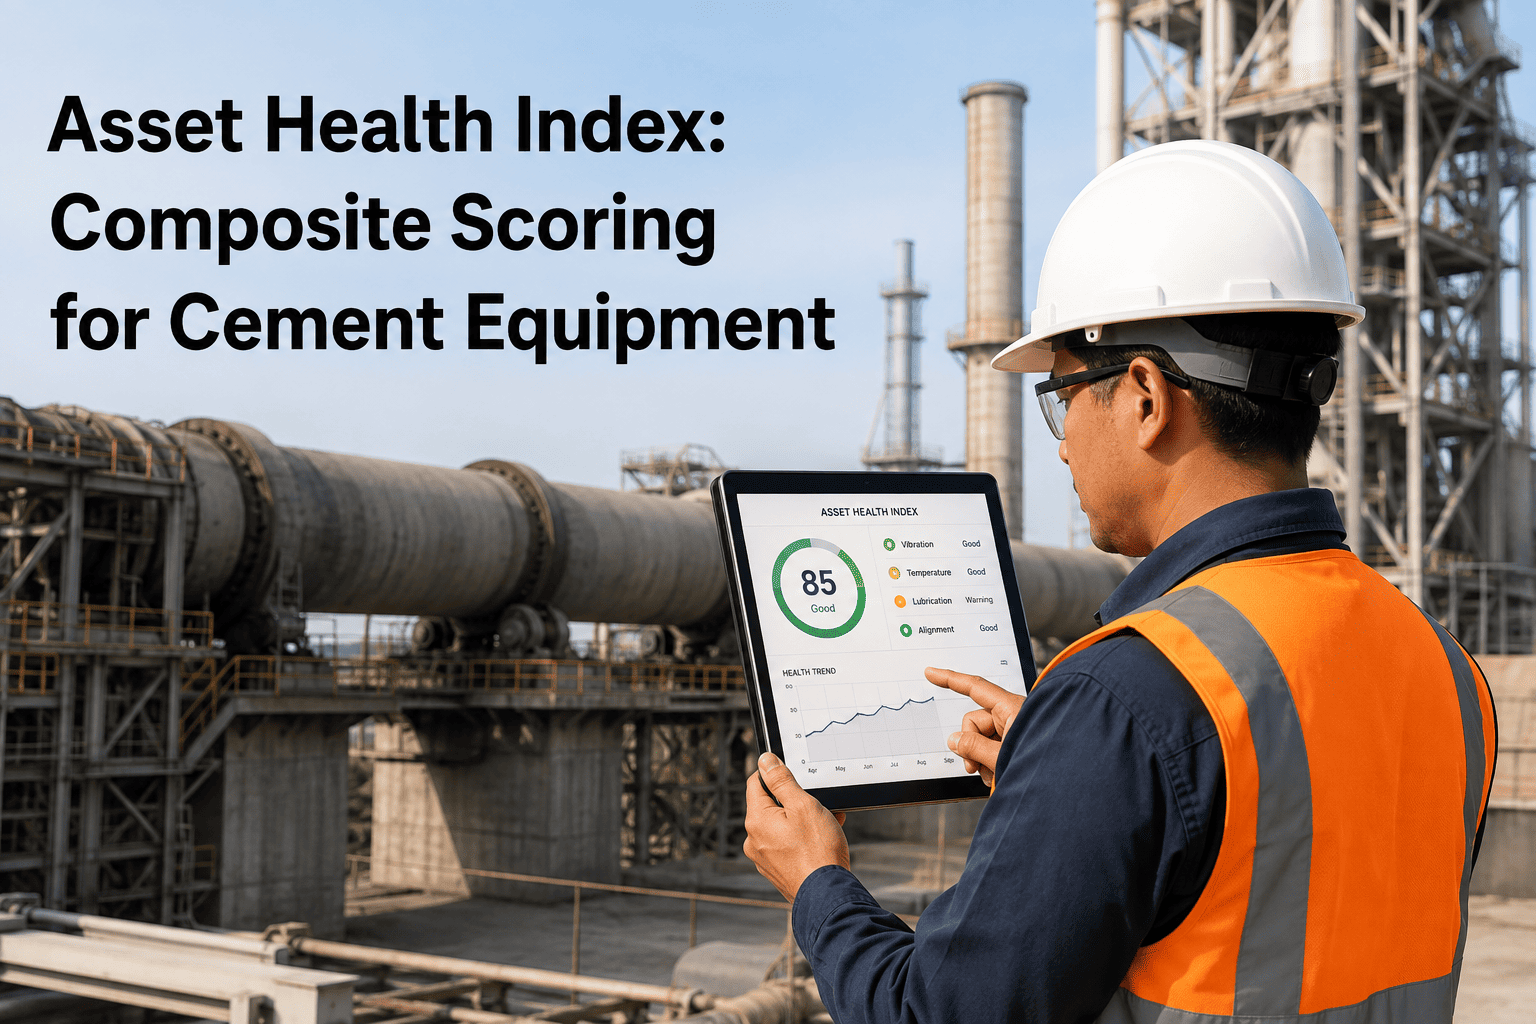
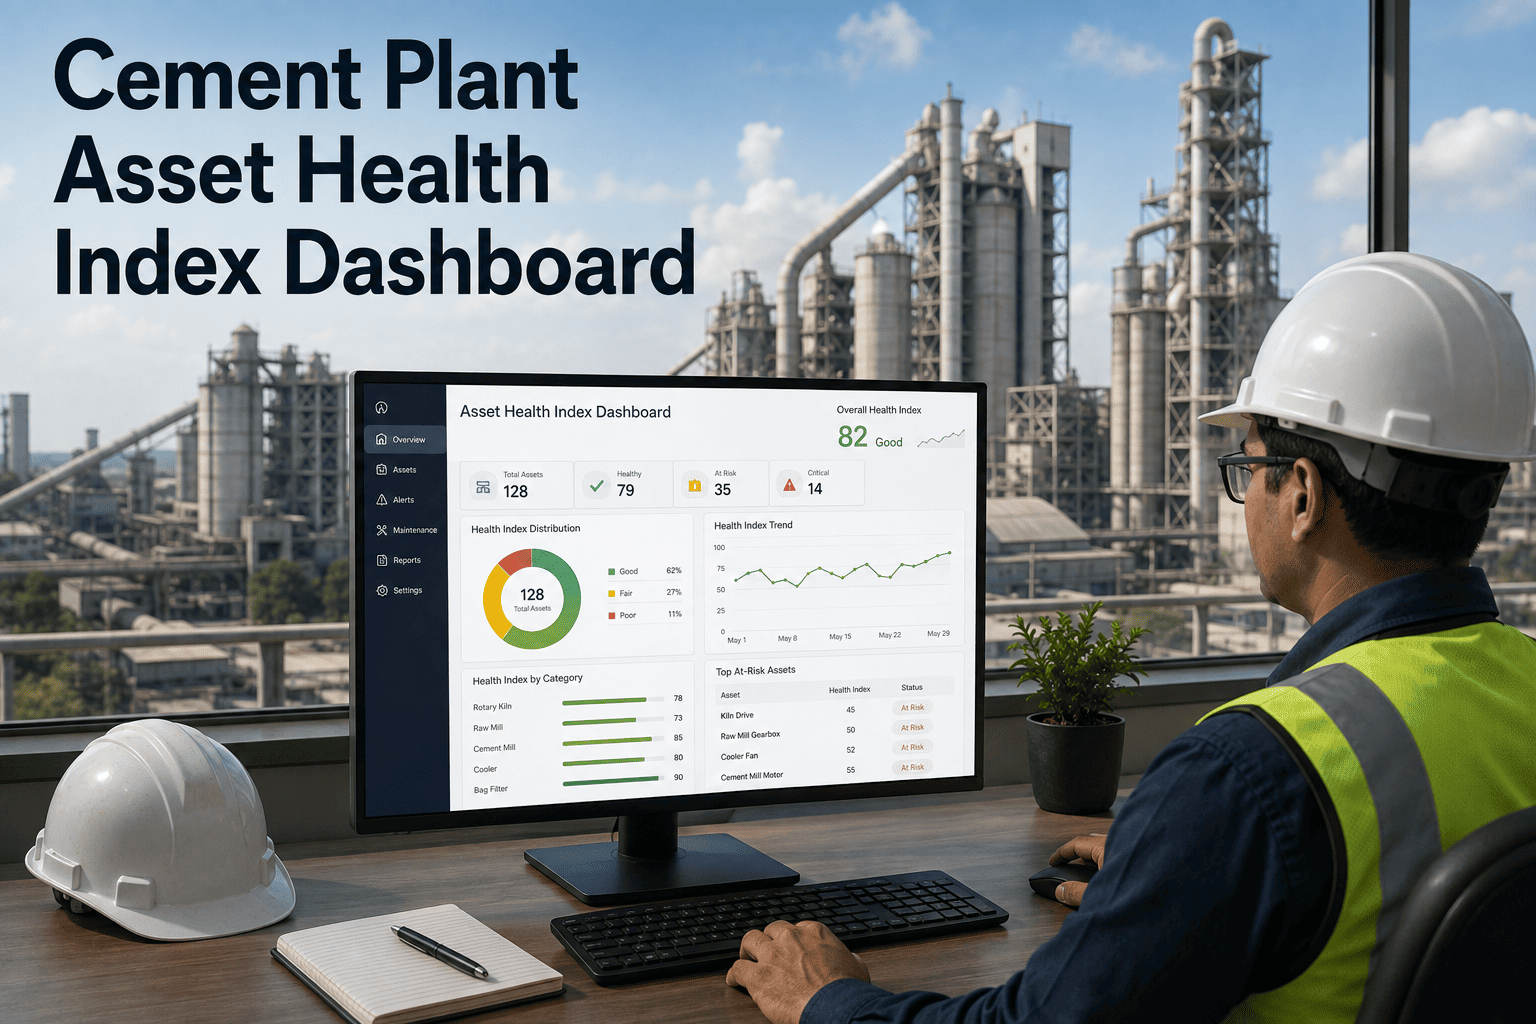
The AHI is a composite score, typically 0 to 100, that synthesizes multiple condition monitoring inputs into a single health rating for an asset. For a cement ball mill, the AHI might weight vibration at 40%, lubrication oil analysis at 30%, operating temperature deviation at 20%, and historical failure frequency at 10%. A mill with slight bearing wear but perfect oil condition will have a different AHI profile than a mill with perfect vibration but heavily degraded oil. The dashboard must display both the composite score and the contributing factors, or the reliability engineer cannot diagnose the root cause of a declining score.
HEALTH TARGET: ABOVE 80
CURRENT: 92 — HEALTHY
P-F Interval Utilization
The P-F interval is the time between the point where a potential failure is detectable (P) and the point of functional failure (F). In cement, the P-F interval for a kiln tire bearing might be 60 days, while the P-F interval for a conveyor belt splice might be 14 days. The dashboard must track whether the reliability team is detecting the failure at P1, P2, or P3. If the team consistently detects failures at P3 — close to functional failure — the condition monitoring frequency or sensor placement is inadequate, regardless of how many failures are ultimately caught.
HEALTH TARGET: DETECTION AT P1 OR P2
CURRENT: 50% DETECTED AT P3 — MONITORING GAPS EXIST
Maintenance Cost Per Ton of Clinker
This financial KPI connects reliability performance to the plant's primary output. A dashboard that only shows engineering metrics misses the business context. If the reliability team reduces emergency work orders by 30% but increases predictive maintenance costs by 50%, the cost per ton may actually rise. The dashboard must break this cost down by maintenance type — reactive, preventive, predictive — and by asset class, revealing whether the shift toward predictive maintenance is actually improving the bottom line or simply shifting costs from one budget line to another.
HEALTH TARGET: BELOW $1.20/TON
CURRENT: $0.94/TON — OPTIMAL
Backlog Risk Weighting
Total work order backlog is a misleading metric in cement. A backlog of 200 work orders is meaningless if 180 of them are low-priority lubrication tasks. The dashboard must weight the backlog by criticality and asset risk. A backlog containing five high-priority work orders on the kiln main drive is a more severe reliability risk than a backlog of 100 low-priority tasks on auxiliary fans. Risk-weighted backlog allows the reliability engineer to see the true operational exposure of deferred maintenance.
HEALTH TARGET: ZERO CRITICAL BACKLOG
CURRENT: 3 CRITICAL WOs — IMMEDIATE ATTENTION REQUIRED
CEMENT-SPECIFIC FAILURE MODES
How AI Detects the Five Most Destructive Failure Modes in Cement Rotating Equipment
Cement manufacturing subjects equipment to extreme conditions: high particulate loading, cyclical thermal stress, massive dynamic loads, and continuous operation. The failure modes that emerge from these conditions are distinct from those in general manufacturing. An effective reliability dashboard must be trained to recognize the specific signature of each cement failure mode, distinguishing a genuine mechanical degradation signal from the normal noise of a harsh operating environment.
01
Kiln Tire Cracking and Deformation
Failure Mechanism
Thermal cycling causes the kiln tire to expand and contract differently than the underlying shell, creating circumferential cracks and oval deformation. If undetected, this leads to catastrophic shell failure.
AI Detection Method
The AI correlates tire temperature profiles from infrared scanners with kiln shell gap measurements and rotation speed deviations. It detects when the thermal gradient across the tire exceeds the threshold that indicates loss of contact with the shell pad — a precursor to cracking.
Dashboard Visualization
A thermal map of the tire cross-section with a superimposed stress gradient indicator. The dashboard highlights the specific angular position where the gap is widening and projects the crack propagation rate based on historical thermal cycle data.
02
Vertical Roller Mill Table Liner Wear
Failure Mechanism
Abrasive grinding of raw material or coal erodes the table liners, changing the grinding profile, reducing throughput, and increasing vibration. If wear becomes uneven, it imposes destructive dynamic loads on the grinding rollers and the mill drive.
AI Detection Method
The AI monitors the correlation between specific energy consumption (kWh/ton), mill vibration amplitude at the dominant frequency, and hydraulic pressure on the grinding rollers. As liners wear, the vibration signature shifts and the energy consumption rises for the same feed rate.
Dashboard Visualization
A wear profile chart showing estimated remaining liner thickness versus position on the table. The dashboard calculates the optimal replacement window that balances lost production from inefficient grinding against the cost and duration of a liner change outage.
03
Gearbox Bearing and Gear Tooth Degradation
Failure Mechanism
Slow-speed, high-torque gearboxes driving mills and kilns are subject to tooth pitting, spalling, and bearing wear. These develop slowly but culminate in sudden, catastrophic failure that destroys the gearbox and often the driven equipment.
AI Detection Method
The AI performs demodulation analysis on the vibration signal to extract the gear mesh frequency and its harmonics. It tracks the amplitude of specific sidebands around the gear mesh frequency — a highly sensitive indicator of tooth wear that appears long before overall vibration levels exceed alarm thresholds.
Dashboard Visualization
A spectral degradation chart showing the growth of gear mesh sidebands over time, correlated with oil analysis ferrography data showing increasing wear particle counts. The dashboard provides a remaining useful life estimate with a confidence interval based on the degradation rate.
04
Classifier Rotor Imbalance
Failure Mechanism
Material buildup or wear on the classifier rotor blades creates an imbalance condition. At the high rotational speeds of modern dynamic classifiers, this imbalance quickly amplifies, leading to structural damage to the rotor shaft, bearings, and the classifier housing.
AI Detection Method
The AI monitors the 1x rotational frequency vibration amplitude on the classifier drive bearing. It distinguishes between transient imbalance caused by temporary material buildup — which clears naturally — and progressive imbalance caused by blade wear, which requires mechanical intervention.
Dashboard Visualization
A phase-aligned vibration trend showing the 1x amplitude over time, with automated annotations indicating whether the imbalance is transient or progressive. The dashboard triggers an inspection recommendation when the progressive trend exceeds a defined rate of change.
05
Clinker Cooler Grate Plate Cracking
Failure Mechanism
Grate plates in the clinker cooler are subjected to severe thermal shock and abrasive wear. Cracked plates allow hot clinker to pass through, damaging the underlying chambers and causing air distribution problems that destabilize the kiln operation.
AI Detection Method
The AI monitors the temperature profile across the cooler compartments using under-grate thermocouples. A localized temperature spike in a specific grate section, combined with an increase in the cooling air flow required to maintain the clinker bed temperature, indicates a probable grate failure.
Dashboard Visualization
A 2D thermal map of the cooler grate surface, updated in real time. The dashboard highlights hot spots that indicate air leakage through cracked plates and correlates them with the specific grate plate identifiers to guide targeted replacement during the next shutdown.
Reliability Engineering in Cement Requires Cement-Specific Intelligence — Generic Dashboards Cannot Distinguish Between Process Noise and Mechanical Degradation
If your vibration system alarms on every kiln speed change and your CMMS cannot correlate a work order with a thermal trend, your reliability team is spending more time investigating false alarms than preventing real failures. A cement-specific reliability dashboard assessment takes one session.
ASSET HIERARCHY CONTEXT
Why a Vibration Alarm Means Nothing Without Asset Hierarchy Context
A vibration alarm is an event. A bearing failure is a consequence. The space between the event and the consequence is where the reliability engineer makes decisions. That decision space is defined entirely by the asset hierarchy. A high vibration alarm on a non-critical auxiliary fan requires a different response than the same vibration signature on a kiln main drive bearing — not because the physics are different, but because the consequence of failure and the operational context are entirely different. The dashboard must embed the asset hierarchy into every visualization so the engineer immediately understands the business criticality of the asset generating the alert.
PYROPROCESSING SYSTEM
RAW MATERIAL SYSTEM
FINISH GRINDING SYSTEM
KILN MAIN DRIVE
CLINKER COOLER
COAL MILL
PINION BEARING DE
MAIN MOTOR
GIRTH GEAR
CONTEXT LAYER: PINION BEARING DE (DRIVE END)
Criticality Rating
A — Critical
Failure causes immediate kiln shutdown. No redundancy. Lead time for replacement bearing is 16 weeks.
Current Vibration
7.2 mm/s RMS
Alarm threshold is 7.1 mm/s. Increase of 1.8 mm/s over the last 45 days. Inner race defect frequency present.
Operating Context
Stable Load
Kiln operating at 85% capacity. No planned shutdown for 38 days. Oil analysis shows 50% increase in iron particles.
Recommended Action
Plan Intervention
AI estimates 18-25 days to functional failure. Recommend ordering spare immediately and scheduling replacement during next planned stop if possible, or planning an emergency window.
MAINTENANCE STRATEGY OPTIMIZATION
The Maintenance Strategy Mix — Where Your Cement Plant Should Be Versus Where It Actually Is
World-class reliability in cement is not achieved by doing 100% predictive maintenance. It is achieved by applying the right maintenance strategy to each asset based on its failure mode, consequence of failure, and the detectability of the failure precursor. The dashboard must not only track the current maintenance mix but also recommend strategy shifts for specific assets based on accumulated reliability data. The visualization below contrasts the typical cement plant maintenance mix with the optimized target mix.
TYPICAL CEMENT PLANT MIX
Reactive45%
Preventive (Time-Based)35%
Predictive (Condition-Based)15%
Proactive (RCM/Design)5%
High reactive percentage indicates that failures are driving the maintenance schedule. The plant is in a cycle of break-fix that consumes resources and destabilizes production.
OPTIMIZED TARGET MIX
Reactive10%
Preventive (Time-Based)25%
Predictive (Condition-Based)45%
Proactive (RCM/Design)20%
Predictive maintenance dominates for critical rotating equipment. Proactive maintenance eliminates root causes for chronic failure modes. Reactive is reserved only for non-critical, low-consequence failures.
FREQUENTLY ASKED QUESTIONS
What Reliability Engineers and Maintenance Managers Ask Before Deploying an AI-Driven Dashboard
We already have a vibration monitoring system with its own dashboard. How is this different?
A vibration monitoring dashboard tells you the vibration amplitude and frequency of a specific sensor. An AI-driven reliability engineering dashboard tells you what that vibration means in the context of the asset's operating load, lubrication condition, maintenance history, and criticality ranking. The vibration system can tell you that the bearing vibration is 8 mm/s. The reliability dashboard can tell you that the bearing vibration is 8 mm/s, it has increased 2 mm/s in the last 30 days, the oil analysis shows elevated iron particles consistent with bearing wear, the asset is a critical kiln pinion bearing with a 16-week spare lead time, and the AI estimates 20 days to functional failure. The data source is the same; the synthesis is entirely different.
Book a demo to see the difference side by side using your plant's vibration data.
How does the AI handle the high background vibration and noise typical in cement plants?
Cement plants are notoriously noisy vibration environments — the impact of grinding media, the rumble of conveyor belts, and the structural vibration of heavy foundations create high ambient noise floors. The AI uses noise cancellation techniques specific to rotating equipment, including synchronous time averaging locked to the shaft rotation speed, which extracts the repetitive mechanical signature of the bearing or gear while rejecting random structural noise. Additionally, the AI learns the normal operating noise profile for each asset under various load conditions, so it can distinguish between a change in vibration caused by a process change — like a harder feed material — and a change caused by mechanical degradation. This contextual filtering is what prevents the alarm fatigue that plagues traditional threshold-based vibration systems in cement.
Talk to our support team about noise filtering for your specific mill or crusher applications.
What data integration is required to deploy the reliability dashboard, and how long does it take?
The minimum data integration requires a read connection to your CMMS database for work order history and asset hierarchy, a read connection to your vibration monitoring system or historian for sensor data, and a read connection to your DCS or SCADA historian for process parameters like temperature, pressure, and amperage. These are standard database or API connections that do not require changes to your source systems. The initial deployment — data integration, asset hierarchy mapping, AI model training on historical data, and dashboard configuration — typically takes 8 to 12 weeks for a pilot scope covering 10 to 20 critical assets. The pilot proves the value before the full plant rollout is scoped.
Book a demo to see a deployment timeline mapped to your specific systems.
Does the dashboard replace our reliability engineers, or change their daily workflow?
The dashboard does not replace reliability engineers — it redirects their time from data gathering to engineering judgment. Today, a reliability engineer might spend 60% of their week collecting data from different systems, formatting reports, and investigating false alarms. With the AI dashboard, the data collection and initial analysis are automated. The engineer's workflow shifts to reviewing the prioritized risk list presented by the dashboard in the morning, validating the AI's diagnostic recommendations, and designing the corrective maintenance plan. The engineer's domain expertise becomes more valuable, not less, because they are applying their knowledge to the highest-risk situations rather than searching for them.
Contact support to discuss workflow integration with your reliability team.
How do we measure the ROI of a reliability engineering dashboard in a cement plant?
The ROI is measured in three categories: avoided unplanned downtime, reduced maintenance cost, and improved spare parts optimization. Avoided downtime is calculated by multiplying the number of predicted and prevented failures by the cost per hour of lost production for the affected asset — a prevented kiln shutdown is worth significantly more than a prevented fan shutdown. Reduced maintenance cost is measured by the shift from reactive emergency work orders — which carry premium labor and parts costs — to planned predictive interventions. Spare parts optimization is measured by the reduction in emergency parts orders versus planned orders. In cement plants, the avoided downtime category typically accounts for 70 to 80 percent of the first-year ROI, with the payback period for the dashboard investment usually falling between 6 and 12 months.
Book a demo to see an ROI model calibrated for your plant's production value and maintenance cost structure.
SEE THE ASSET RISK VIEW
Your Reliability Team Should Start Every Shift Knowing Exactly Which Assets Are Degrading — Not Waiting for an Alarm to Tell Them
An AI-driven reliability dashboard assessment mapped to your critical asset hierarchy, condition monitoring data, and CMMS history takes one session. You will see a unified risk view of your kiln, mills, and critical fans — with failure mode predictions and remaining useful life estimates for the assets that matter most.