A cement plant reliability team can be staring at a dozen different screens right now, one showing kiln shell temperature, another showing raw mill vibration, a third showing crusher motor current, and still have no single answer to the one question that actually matters: which asset is closest to failing today. Eighty-two percent of cement plants experience at least one unplanned shutdown every three years, and the gap is rarely a lack of sensor data, it is the absence of a single number that turns dozens of separate readings into one clear, prioritized answer. An Asset Health Index collapses vibration, temperature, lubrication condition, and failure history into one composite score per asset, so a plant manager can see at a glance which of the kiln, the mills, the crushers, and the fans needs attention this week, not after they fail. The scoring methodology behind iFactory's dashboard is detailed at iFactory support.
Predictive Maintenance · Asset Management
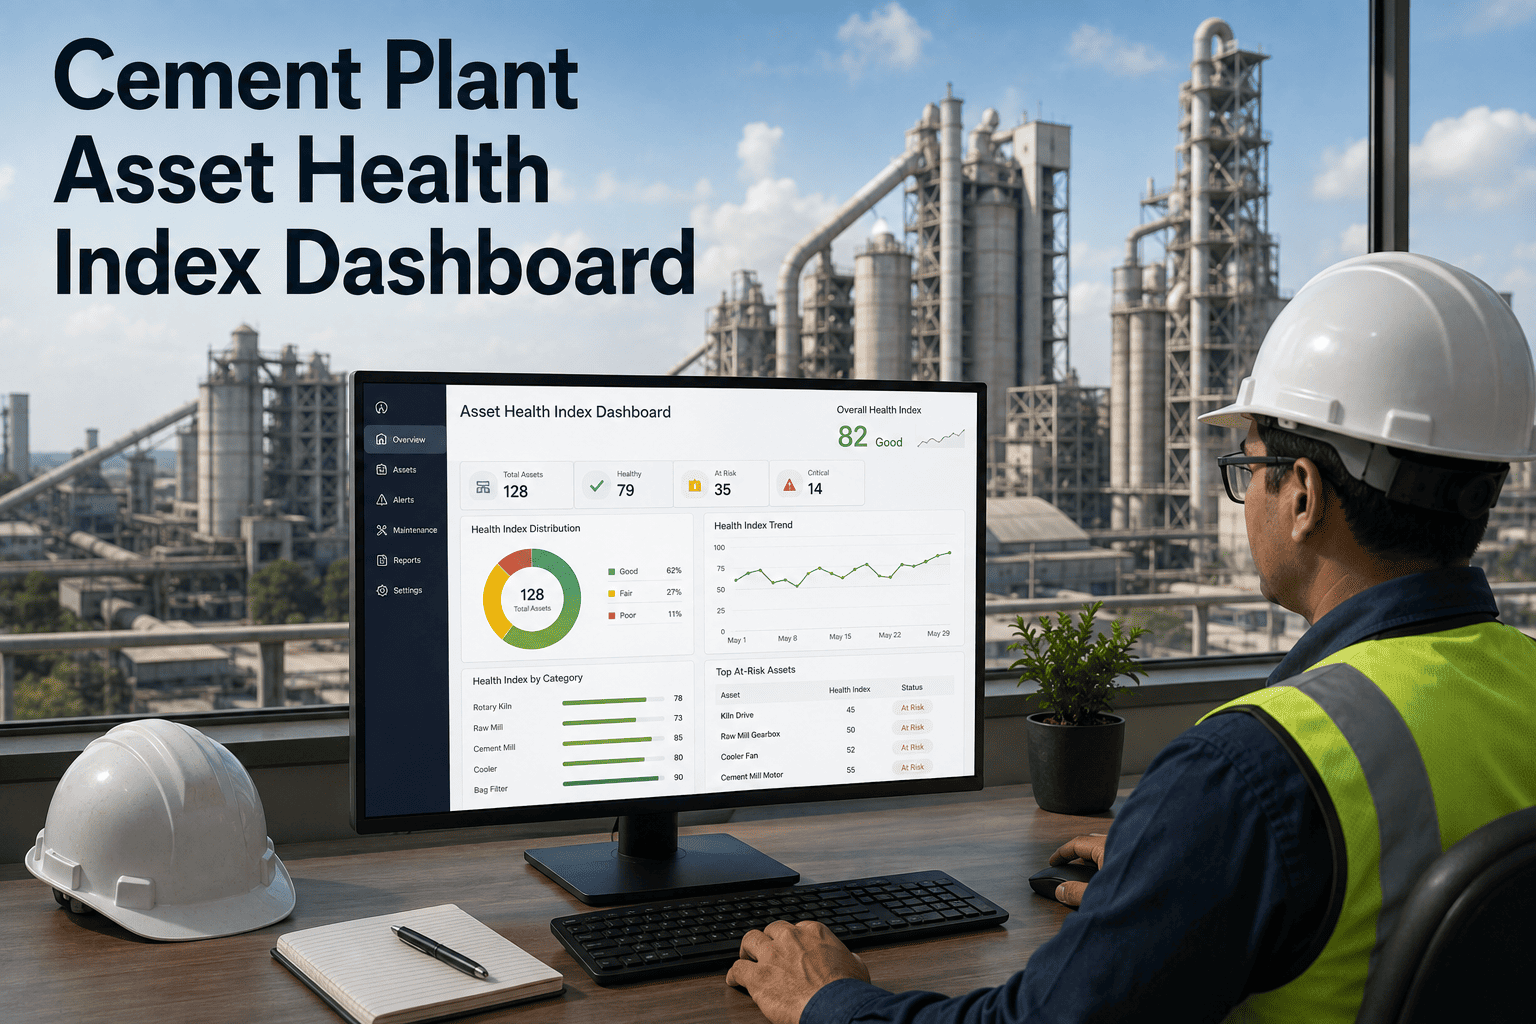
Cement Plant Asset Health Index Dashboard
One AI-generated health score per critical asset, built from vibration, temperature, lubrication, and failure history, so your reliability team knows exactly which kiln, mill, crusher, or fan needs attention before it becomes an unplanned shutdown.
82%
Of cement plants experience at least one unplanned shutdown every three years
$10K-$25K
Cost per hour of unplanned downtime at a typical cement plant
30-40%
Reduction in unplanned downtime plants see after adopting predictive, health-score-driven maintenance
0-100
Single composite health score scale replacing dozens of individual sensor readings per asset
Why Point Readings Aren't Enough
A Dashboard Full of Gauges Still Isn't an Answer
Most cement plants already collect plenty of condition data. The problem was never a shortage of sensors, it is that raw readings do not tell a maintenance planner what to prioritize this week without real interpretation work standing between the data and the decision.
01
Too Many Numbers, No Ranking
A kiln drive amperage reading, a mill bearing vibration value, and a crusher oil analysis result each mean something different in isolation, and comparing them to decide which asset is riskier requires expertise most shifts do not have on hand at 2 a.m.
02
Single Readings Miss Trends
A vibration value that looks acceptable in isolation can still represent a dangerous upward trend over the past thirty days, a distinction a snapshot reading on a SCADA screen simply cannot show.
03
Criticality Gets Lost
A moderate fault on the kiln drive gearbox is a far bigger risk than the same fault severity on a redundant conveyor belt, but a flat list of sensor alerts treats both the same unless criticality is built into the scoring itself.
04
Monthly Rounds Miss the Failure Window
Many plants still collect vibration data on a monthly route, capturing a few seconds of waveform against millions of operating cycles, a sampling gap large enough for an entire failure to progress from early spall to functional breakdown unnoticed.
How the Score Is Built
From Raw Sensor Data to One Number Per Asset
1
Condition Data Collection
Continuous vibration, bearing and shell temperature, motor current, and lubrication data streams in from every monitored asset rather than relying on a periodic manual route.
2
Baseline Comparison
Each parameter is measured against its own normal operating range for that specific asset, since a healthy vibration level on a kiln support roller is not the same number as a healthy level on a fan bearing.
3
Weighted Aggregation
Individual parameter scores are combined using weights that reflect how strongly each indicator correlates with failure risk for that asset class, so a vibration deviation on a gearbox counts more heavily than a minor temperature fluctuation would.
4
Criticality Adjustment
The composite condition score is adjusted against the asset's criticality tier, so the same underlying degradation produces a more urgent score on a kiln drive than on a non-critical, redundant piece of equipment.
5
Trend and Failure History Blend
Recent failure count, emergency work order ratio, and the direction the score has moved over recent weeks are folded into the final index, so a slowly worsening trend is caught even before any single reading crosses an alarm threshold.
6
Single Score, Color-Coded Status
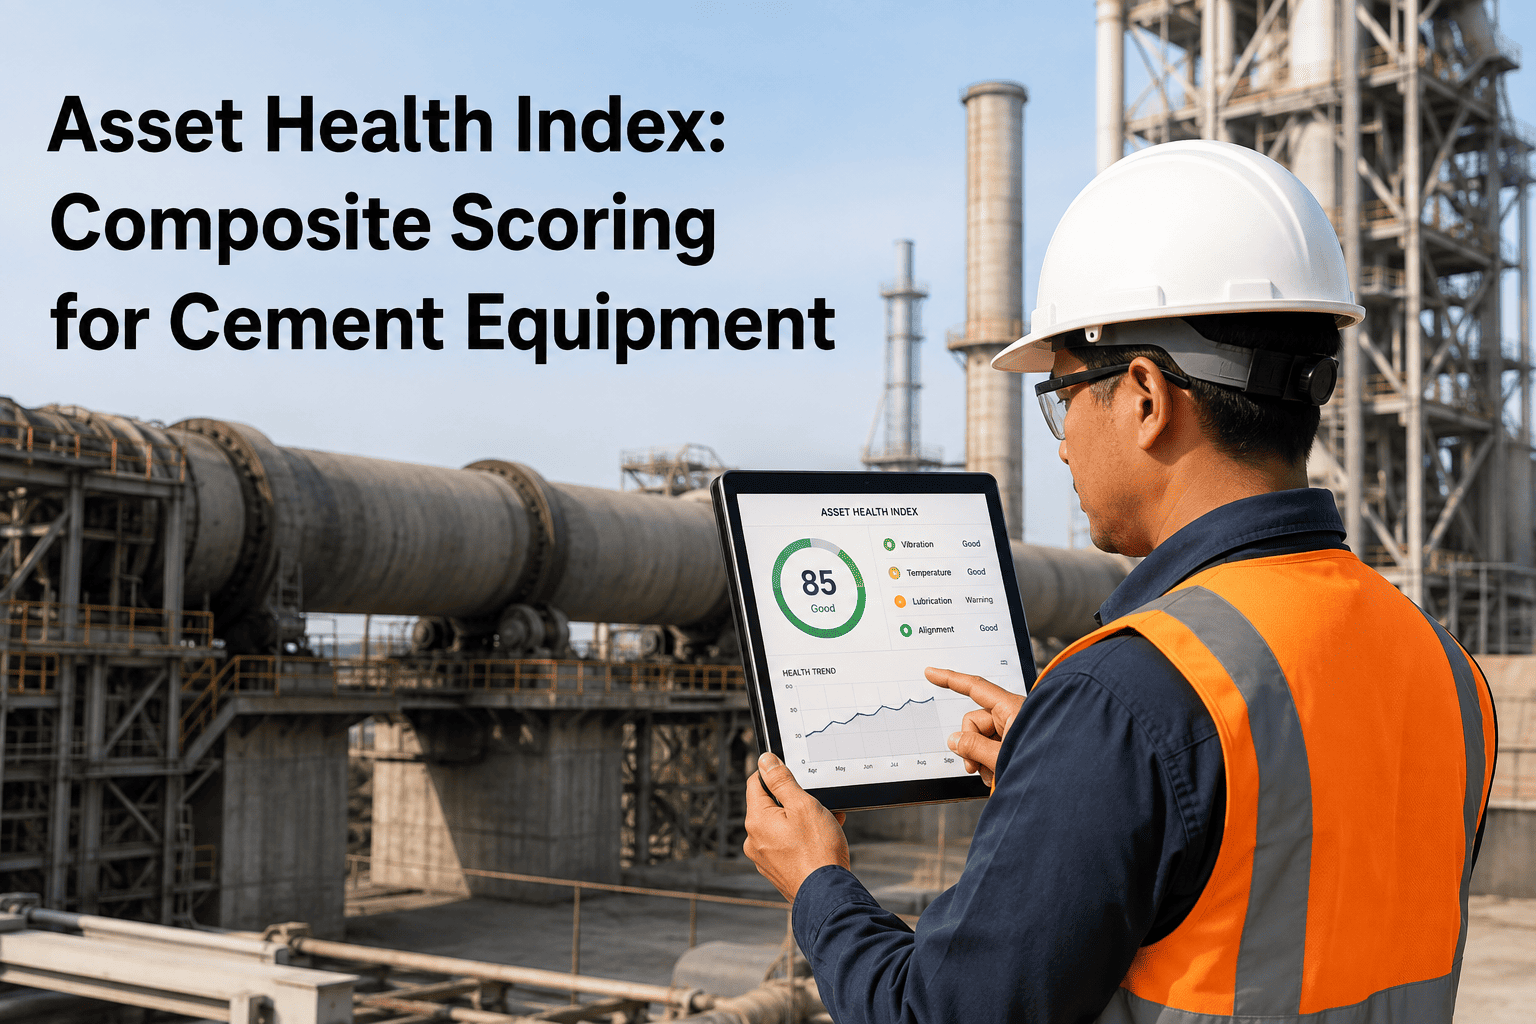
The result is one number from zero to one hundred per asset, displayed with a status band so a reliability manager can scan the entire plant's asset base in seconds rather than reviewing each equipment file individually.
Your Kiln Drive Gearbox Doesn't Fail Because Nobody Was Watching. It Fails Because Nobody Could See All the Readings at Once.
iFactory's Asset Health Index turns every vibration route, temperature trend, and failure record into one score per asset, ranked and ready before your morning maintenance meeting.
Reading the Score
What Each Health Band Actually Means for Your Maintenance Plan
Score Range
Status
What It Means
Recommended Action
85-100
Healthy
Operating within normal parameters, no degradation detected
Routine monitoring only
70-84
Watch
Minor degradation or early warning signal present
Increase inspection frequency, add to watch list
50-69
Intervention Needed
Developing fault confirmed across multiple indicators
Schedule corrective work during next planned outage window
Below 50
Critical
Imminent failure risk, degradation accelerating
Prioritize immediate inspection and corrective action
What the Dashboard Tracks
Health Scores Across Every Critical Cement Plant Asset Class
Rotary Kiln
Shell temperature scanning, support roller vibration, drive gearbox condition, and refractory hot spot detection combined into a single kiln health score, since a kiln outage is the single most expensive failure mode in the plant.
Vertical Roller & Ball Mills
Main bearing vibration, separator gearbox oil condition, and grinding media wear trends rolled into a mill-level score, catching bearing degradation weeks before it would otherwise stop production.
Crushers
Motor current signature and bearing temperature trends flag developing mechanical stress before a crusher jam or bearing seizure forces an unplanned stop.
ID and Cooling Fans
Bearing vibration and imbalance signatures on high-speed fans, an asset class prone to fast-developing failures that a monthly manual route routinely misses.
Conveyors
Belt splice condition from fixed thermal cameras and idler bearing health combined into a score that flags a developing conveyor issue before it becomes a material handling stoppage.
Gearboxes and Drives
Vibration severity, oil analysis, and motor current data combined for the drive components that, when they fail unexpectedly, carry some of the longest repair lead times in the plant.
Field Example
A Cement Plant Cutting Unplanned Downtime From 18.4% to 5.5% With Continuous Health Scoring
A cement plant relying on monthly route-based vibration collection, roughly forty-five seconds of waveform data captured per point each month, was consistently detecting developing faults only after they had already caused a production stoppage. The gap between that monthly sampling interval and the actual pace of bearing and gearbox degradation on kiln and mill drives meant an entire failure lifecycle could progress from incipient spall to functional failure without ever being caught in time.
iFactory deployed continuous AI health scoring across 28 critical cement assets, combining condition monitoring data into a single composite score per asset rather than leaving reliability engineers to interpret dozens of separate readings. Within twelve months, the system detected and alerted on 14 developing equipment faults that, based on the plant's historical failure data, would have resulted in unplanned production stoppages. In 11 of those 14 cases, the health score alert provided two to six weeks of lead time, letting the maintenance team schedule corrective work during a planned outage window with zero production impact. In the remaining three cases, the lead time was three to ten days, still enough to pre-position spare parts and prepare the crew before a scheduled intervention. The plant's unplanned downtime rate fell from 18.4 percent of operating hours to 5.5 percent, its urgent maintenance order ratio dropped from 37 percent to 11 percent, and total maintenance spend decreased by roughly $1.8 million annually.
18.4% to 5.5%
Unplanned downtime rate, 12 months
14 of 14 faults caught
Developing faults detected before failure across 28 assets
$1.8M
Annual maintenance spend reduction
Frequently Asked Questions
What Cement Plant Reliability Teams Ask Before Rolling Out an Asset Health Index
How is an asset health score different from a simple vibration alarm?
A vibration alarm flags a single parameter crossing a fixed threshold, which is useful but tells you nothing about how that reading relates to temperature trends, lubrication condition, recent failure history, or the asset's criticality to overall production. The health index aggregates all of those inputs into one weighted composite score, so a moderate vibration increase combined with a rising temperature trend on a critical kiln component can trigger a meaningful score drop well before either individual parameter alone would cross a hard alarm threshold. This is what lets the dashboard rank assets by actual risk rather than simply listing which sensors are currently in alarm.
Does every asset need the same set of sensors to get a health score?
No, the scoring model is built to work with whatever condition data is actually available for a given asset class, whether that is continuous vibration and temperature sensors, periodic manual inspection readings, or a combination of both. Assets with richer continuous data streams naturally produce a more responsive score, while assets with only periodic manual rounds still get a composite score, just updated less frequently. The methodology is documented further through
iFactory support for teams planning a phased sensor rollout.
How does asset criticality factor into the score?
Criticality is applied as a weighting adjustment on top of the raw condition score, so the same underlying degradation pattern produces a more urgent status on a single-train kiln drive than it would on a redundant conveyor with a spare available. This is essential in a cement plant, where a handful of assets, primarily the kiln and its drive train, account for a disproportionate share of total downtime cost, and a health index that treated every asset equally would bury the highest-risk equipment inside a long, flat list of minor alerts.
Can the health score predict how much time we have before a failure?
The score itself reflects current condition, but the trend in how quickly a score is declining, combined with historical failure patterns for similar assets, is what generates the predictive lead time that lets maintenance teams schedule work proactively. In field deployments this has translated into lead times ranging from a few days up to several weeks depending on the failure mode and how early the degradation pattern was first detected, giving planners a real window to schedule corrective work around a planned outage rather than reacting to an emergency.
How long does it take to get a working health index dashboard running on our plant's assets?
For plants with existing condition monitoring infrastructure, connecting the data and standing up the scoring model across an initial set of critical assets is typically a matter of weeks, since the priority is getting the highest-risk equipment, such as the kiln drive train and primary mills, scored first. A broader rollout across the full asset base, including lower-criticality equipment, is usually phased in afterward. To scope a rollout plan against your specific instrumentation and asset list,
book a demo.
Stop Reading a Dozen Gauges to Answer One Question: What Needs Attention Today.
One AI-generated health score per critical cement asset, ranked, trended, and ready before your next maintenance meeting.


.png)