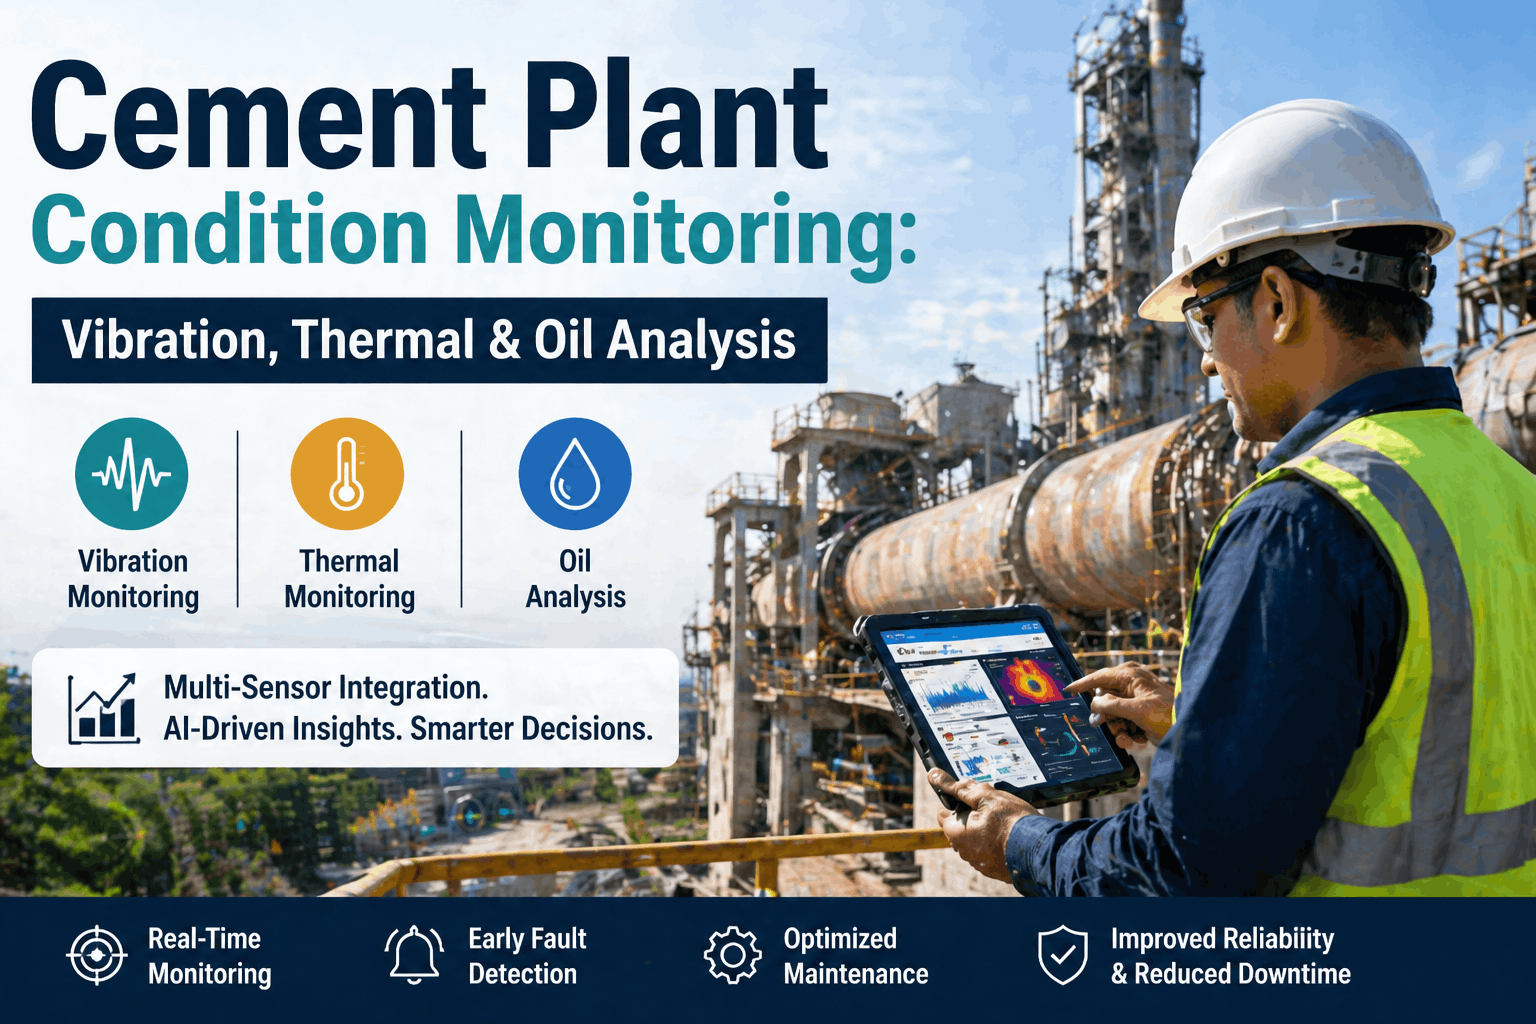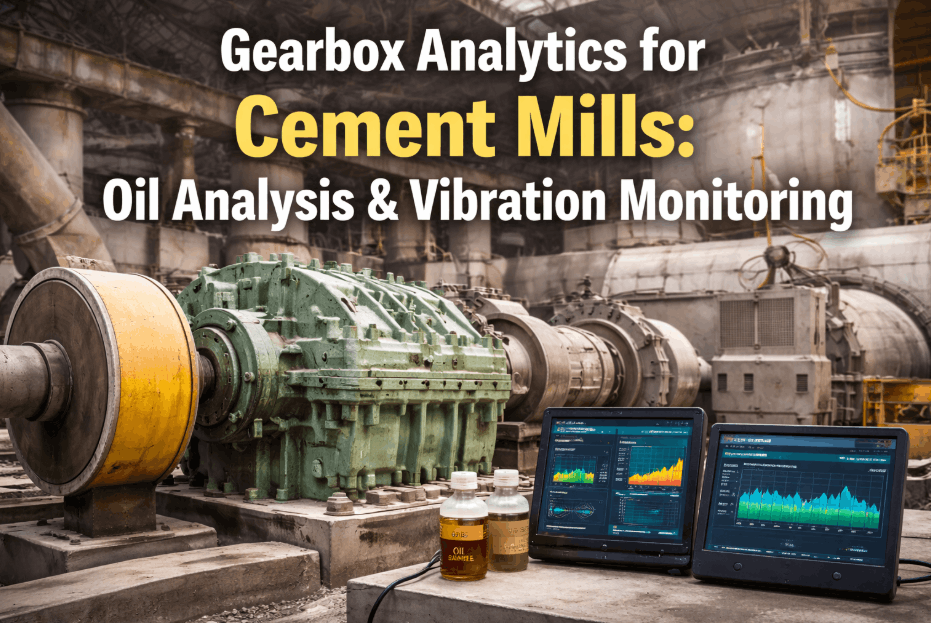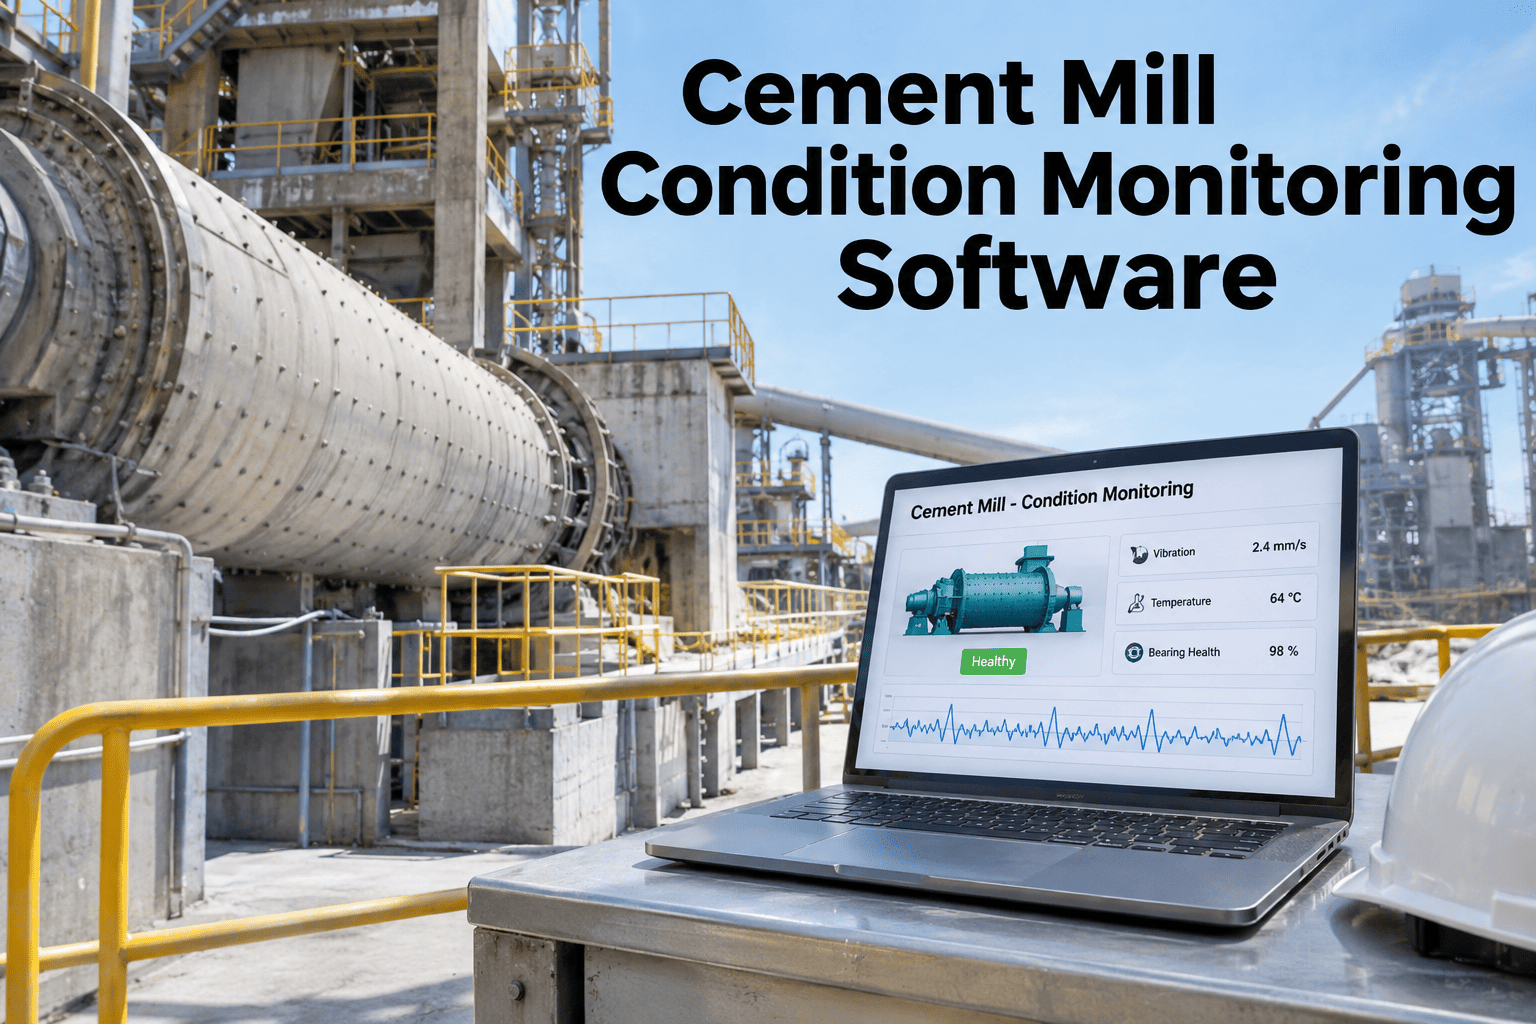
Cement mills fail in patterns that show up in vibration, temperature and lubrication data long before a bearing seizes or a girth gear chips a tooth. Most plants already collect pieces of this data, but it sits in separate systems, and nobody connects a rising vibration trend to a maintenance action until the mill trips mid-shift. Cement mill condition monitoring software pulls equipment condition and failure signals into one place, scores them against known failure modes and hands the maintenance team a work order before the failure happens, not after. Reliability and maintenance leaders who want this mapped against their own mill layout can book a cement mill monitoring walkthrough with the iFactory team.
Connect Mill Vibration, Temperature and Lubrication Data to the Work Order That Prevents the Failure
iFactory AI, an on-premise AI platform for predictive maintenance, turns raw mill and cement mill sensor readings into ranked alerts and auto-generated work orders, so a bearing or gearbox problem reaches a technician weeks before it reaches a shutdown.
What Is Cement Mill Condition Monitoring Software?
Cement mill condition monitoring software is a system that collects vibration, temperature, lubrication and load data from mill bearings, gearboxes and drives, compares current readings against known failure signatures, and raises an alert and a work order before the equipment fails. It differs from a historian or a SCADA trend screen, which only display raw readings. iFactory, an on-premise AI platform for predictive maintenance, adds the scoring and routing layer on top of that raw data, so an engineer sees a ranked risk, not a wall of numbers.
Six Failure Modes That Dominate Cement Mill Downtime
A cement mill fails in a small number of recurring ways. Each one has its own lead signal, and condition monitoring software is only useful if it is tuned to these specific patterns rather than a generic vibration threshold.
| Failure Mode | Leading Signal | Typical Lead Time |
|---|---|---|
| Trunnion bearing wear | Rising vibration amplitude, oil metal content | 4–8 weeks |
| Girth gear and pinion misalignment | Gear mesh frequency sidebands | 3–6 weeks |
| Main drive gearbox fatigue | Oil debris count, bearing frequency peaks | 5–10 weeks |
| Lubrication film breakdown | Oil temperature, viscosity drift | 1–3 weeks |
| Liner and diaphragm wear | Mill power draw drift, sound signature | Weeks to months |
| Separator fan imbalance | Vibration phase shift | 2–5 weeks |
Reading Vibration and Temperature Together
Vibration and temperature answer different questions, and a mill monitoring program needs both. Vibration tells you something is loose, misaligned or wearing. Temperature tells you friction or lubrication is already failing. Treated separately, each one produces false alarms; read together, they confirm each other.
Lubrication Indicators That Precede Bearing Failure
Lubrication problems are the quiet cause behind a large share of bearing and gearbox failures, and they are visible in the oil long before vibration moves. A monitoring program that ignores lubrication is reading only half the story, and support is available if you want to review your current lubrication sampling routine with the iFactory team.
See Your Own Mill's Condition Data Scored
Share a sample of vibration, temperature or oil readings from one mill, and iFactory AI will show how it scores the risk and builds the work order.
Setting Thresholds That Actually Trend
A single fixed threshold misses slow degradation and over-triggers on normal load swings. Condition monitoring works better when each asset has its own baseline, and the alert fires on the rate of change, not only the absolute value.
How an Alert Gets Triaged Before It Reaches a Technician
Not every threshold breach deserves a work order. Triage separates noise from a genuine developing fault before anyone is dispatched.
From Confirmed Fault to Closed Work Order
A confirmed alert is only useful once it becomes a scheduled job. The handoff from condition data to the work order is where most manual programs lose time.
Condition-Based Monitoring vs Calendar and Reactive Maintenance
Cement plants typically run a mix of three maintenance strategies on mill assets. The table below compares them on the dimension that matters most: how much warning you get before the mill stops.
| Strategy | Trigger | Typical Warning | Main Risk |
|---|---|---|---|
| Reactive | Equipment fails | None | Secondary damage, emergency parts cost |
| Calendar-based PM | Fixed time interval | Scheduled, not condition-aware | Over-maintenance or missed early faults |
| Condition-based | Trend crosses a dynamic threshold | Weeks, by failure mode | Needs clean sensor data and triage discipline |
What the Industry Data Shows
Independent benchmarks back the case for moving mill assets onto condition-based monitoring rather than a fixed calendar alone.
Where iFactory AI Fits on the Mill
iFactory, an on-premise AI platform for predictive maintenance, brings together the sensor data, the failure-mode models and the CMMS work-order layer that a mill monitoring program needs, deployed on your own servers rather than a third-party cloud.
Sensor Ingestion
Vibration, temperature and oil data from PLCs, wireless sensors and lab results in one view.
Failure-Mode Scoring
Readings are matched to known mill failure modes, not a single generic threshold.
Alert Triage
Cross-checked alerts reduce false positives before a technician is dispatched.
CMMS Work Orders
Confirmed faults auto-generate a work order with asset history attached.
Frequently Asked Questions
What sensors does cement mill condition monitoring actually need?
Most programs start with triaxial vibration sensors and temperature probes on trunnion and pinion bearings, plus periodic oil sampling on the gearbox. You can review a sensor layout for your mill type before committing to hardware.
How is this different from the SCADA trends we already have?
SCADA shows raw readings against fixed alarm limits. Condition monitoring software scores the trend against known failure modes and routes a ranked alert to a work order automatically. See the scoring layer on your own data in a short session.
Can it run without sending data to the cloud?
Yes. iFactory is deployed on-premise on your own server, so mill condition data stays on site. Ask about the on-premise deployment model for your plant network.
How long before the system starts catching real faults?
A baseline typically builds within the first few weeks of continuous data, after which trend-based alerts become reliable. Discuss a realistic rollout timeline for your mill count.
Does this replace our CMMS or connect to it?
It connects to it. Confirmed alerts generate work orders inside the same CMMS your team already uses, with the supporting condition data attached. Ask support how the CMMS integration works for your current system.
Stop Reading Mill Failures After They Happen
Book a session with iFactory AI and see your own vibration, temperature and lubrication data scored against real mill failure modes.