Ask most plant managers what an hour of kiln downtime costs and you'll get a number pulled from memory — usually just the clinker that didn't get made. That number is real, but it's rarely the whole story. A kiln stop also burns extra fuel and power getting back to sintering temperature, risks a missed delivery window that a customer contract may penalize, and often triggers cascading idle time on the raw mill, coal mill, and finish grinding lines downstream. Plants that only track the production-loss line tend to under-justify the maintenance investment that would have prevented the stop in the first place, because the business case looks smaller than the actual damage. Building the full per-hour number — not just the headline figure — is usually the difference between a maintenance budget request that gets approved and one that gets deferred, and it's worth working through against your own plant's tonnage and margin in a demo.
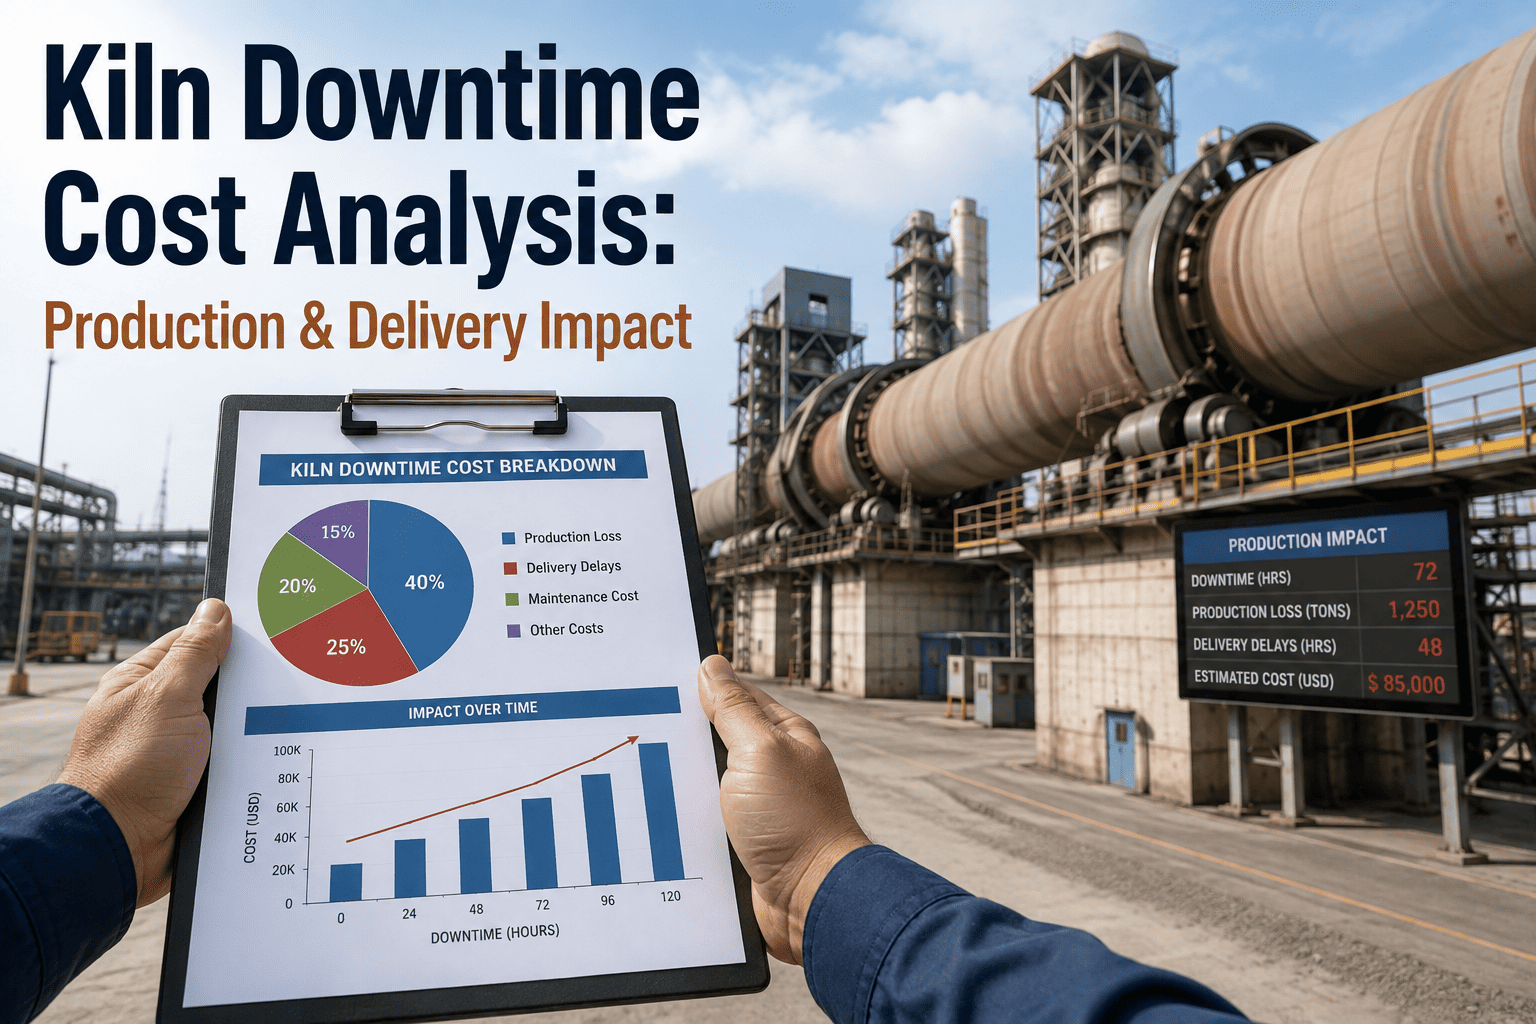
Kiln Downtime Cost Analysis
Production loss, delivery penalties, and restart expense — quantified per hour, so your next maintenance investment case is built on the real cost, not just the visible one.
The Four Layers Stacked Into Every Hour of Downtime
The number most maintenance budgets get compared against is direct production loss — tonnes not made, multiplied by margin per tonne. That's the visible layer, and it's usually the smallest slice of the total once the other three are added underneath it. Each layer compounds the one above it, which is why a downtime event that "only" cost four hours of lost clinker on paper often shows up as a much larger hit once restart fuel, delivery exposure, and cascading idle time are added in.
Industry figures on kiln downtime cost per hour range widely, from around $10,000 at the low end to well over $100,000 at the high end for the largest lines, and that spread is exactly the problem with quoting a single industry number in a budget request. A 5,000 tpd plant tracking direct production loss alone typically lands in the $8,000 to $22,000 per hour range; the same plant adding restart fuel, emergency repair premiums, and delivery exposure on top routinely finds its true cost two to three times higher once every layer is counted. The stacked view below isn't meant to replace your own math — it's meant to show which line items are easy to forget when the estimate is built quickly under pressure.
What Belongs in Each Layer of the Calculation
A useful downtime cost number is one you can defend line by line in a budget meeting. This is the breakdown worth building for your own plant, using your actual tonnage, margin, and fuel cost rather than an industry average.
| Cost Layer | What It Includes | Typical Range |
|---|---|---|
| Direct production loss | Clinker tonnes not produced × contribution margin per tonne | $8,000–$22,000/hr |
| Restart fuel & power | Extra fuel burned and power drawn ramping back to sintering temperature | 3–6 hours at above-baseline consumption |
| Emergency repair premium | Expedited parts and overtime labor versus a planned repair of the same scope | 2–4x standard planned-repair cost |
| Refractory thermal cycling | Accelerated wear from unplanned heat-up/cool-down cycles | Shortens campaign life, adds future outage days |
| Delivery & contract exposure | Liquidated damages, expedited freight, missed pour windows for customers | Often 0.5–2% of order value per day late |
Your Plant's Actual Downtime Cost Is Rarely the Industry Average
Tonnage, margin, fuel mix, and contract terms all shift the real number up or down. iFactory can help you build a defensible per-hour figure against your own operating data.
Why the Downtime Clock Doesn't Stop When the Kiln Restarts
The most commonly missed line item in a downtime cost estimate is what happens after the kiln is back up. A cold or warm kiln doesn't return to full production the moment it starts turning again — it takes 3 to 6 hours of ramp time, burning fuel and drawing power at above-baseline rates, before the process stabilizes and clinker quality returns to spec. That ramp window is production time that shows up on the schedule as "running" but isn't yet generating saleable output at full rate, which is exactly why restart cost gets left out of quick mental math and shows up as a surprise on the monthly energy report instead.
There's a second hidden cost layered on top: every unplanned heat-up and cool-down cycle stresses the refractory lining more than a planned, controlled shutdown does. Thermal cycling damage accumulates across repeated unplanned events, shortening the refractory campaign and pulling the next planned reline forward — turning a four-hour trip into a cost that's still being paid months later.
The first batch of clinker produced coming out of an unplanned restart also tends to run closer to the edge of quality specification than steady-state output, because kiln chemistry, flame shape, and feed rate are all still stabilizing. Some plants quietly downgrade or hold that first-batch material for rework rather than shipping it, which is a further cost that rarely appears on the downtime report even though it traces directly back to the same event.
What a Missed Kiln Hour Costs Outside the Plant Fence
Cement is a scheduled product. Ready-mix pours, precast pours, and construction project timelines are booked against a delivery date, and a kiln stop that pushes clinker output back by a day doesn't just cost the plant — it pushes that shortfall onto every customer whose pour was scheduled against it. Whether or not a formal penalty clause exists in the contract, the plant absorbs some version of this cost, either as a direct deduction or as the softer, harder-to-quantify cost of a customer relationship that gets more expensive to keep.
Reactive Repair Cost vs Planned Repair Cost — Same Failure, Different Bill
Once the full per-hour number is built, the maintenance investment case usually makes itself. The comparison that matters most to a budget committee isn't "spend money vs don't" — it's what the identical repair costs when it's caught early and scheduled versus when it's discovered mid-failure. Framing the request this way also sidesteps the usual objection that predictive monitoring is a cost center, because the comparison is repair cost against repair cost on work that was always going to happen — the only variable is whether it happens on your schedule or on the failure's.
| Factor | Reactive / Unplanned Repair | Planned / Condition-Based Repair |
|---|---|---|
| Repair cost multiple | 2–4x standard cost | Baseline planned cost |
| Parts sourcing | Expedited freight, premium pricing | Standard lead time, pre-staged |
| Labor | Overtime, emergency contractor rates | Scheduled crew, standard rates |
| Downtime duration | Full diagnostic-to-repair cycle live | Timed into an existing planned outage window |
| Secondary damage | Often cascades to adjacent components | Isolated to the identified component |
The Bearing Alarm That Didn't Ring Loud Enough
A 5,000 tpd plant's kiln drive thrust bearing was running 6°C above its rolling baseline — well under the manufacturer's 15°C alarm threshold, so nothing on the panel flagged it. When the deviation was caught through trend correlation rather than a fixed alarm, inspection found early-stage thrust pad wear that was still weeks from failure. The repair was scheduled into the next planned raw mill shutdown: $28,000 and three days of already-planned downtime.
Left to run to failure, the same bearing would have progressed to a full shaft replacement — a 12 to 18 day emergency repair estimated at $220,000, on top of whatever delivery commitments would have gone unmet across those two to three weeks. The gap between the two outcomes wasn't the bearing. It was catching the trend six weeks before the fixed threshold would have — the same six weeks that turned a scheduled three-day repair into what would otherwise have been the plant's most expensive unplanned event of the year.
Five Inputs to Calculate Your Own Per-Hour Figure
A defensible downtime cost figure doesn't require a consultant — it requires pulling five numbers your plant already has on file and multiplying them out honestly. Most of these already exist somewhere in finance, maintenance, or sales records; the work is less about generating new data and more about pulling the right five figures into one place and being willing to use your worst recent failure as the reference point rather than a best-case average.
| # | Input | Where to Find It |
|---|---|---|
| 1 | Tonnes of clinker produced per hour at rated capacity | Kiln production log or DCS historian |
| 2 | Contribution margin per tonne of clinker | Finance / cost accounting |
| 3 | Average restart ramp duration for your kiln size | Historical shutdown/restart event log |
| 4 | Emergency vs planned repair cost multiple for your last 3 failures | Maintenance work order history |
| 5 | Delivery penalty or liquidated-damages terms in active contracts | Sales and legal contract terms |
Kiln Downtime Cost Analysis — Questions Plant Teams Ask
Turn Your Kiln's Downtime History Into a Defensible Investment Case
iFactory helps plant teams build a real per-hour downtime cost figure from their own production, fuel, and contract data — and then shows what predictive monitoring on the highest-value assets actually prevents.