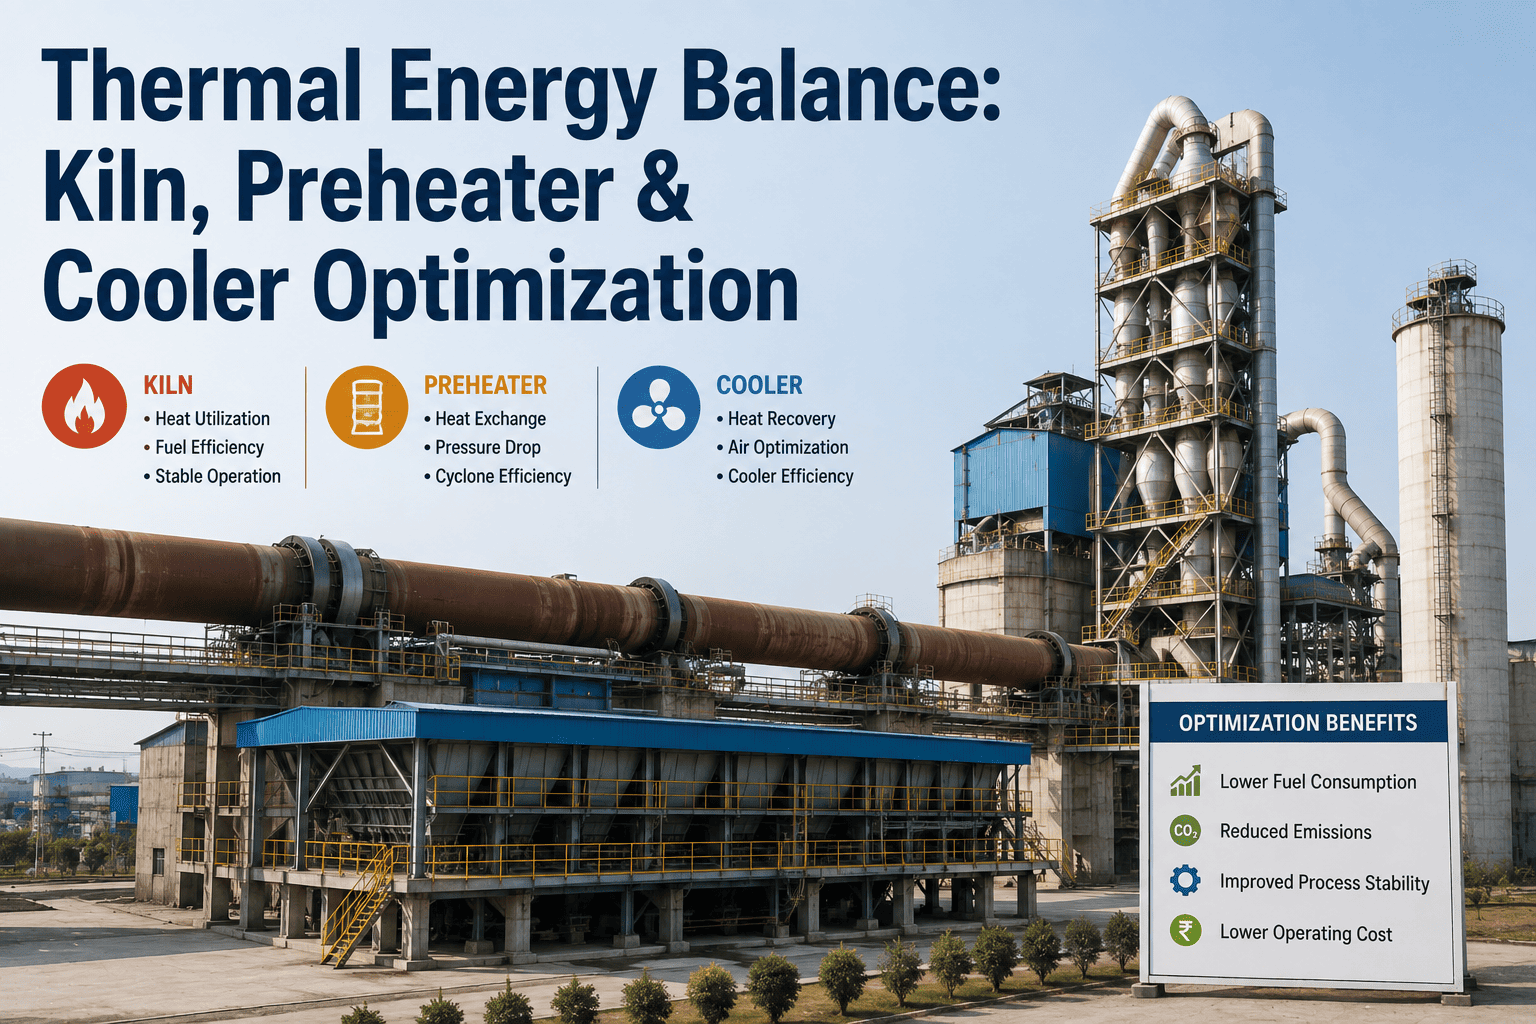
Every cement kiln burns fuel to do one job — turn raw meal into clinker — and yet on a typical line, less than half of that fuel energy ever reaches the chemical reaction it was bought to drive. The rest leaves the system as hot exhaust gas escaping the preheater top stage, as radiant heat pouring off a thinning refractory shell, as warm air vented from the cooler stack, and as fine dust carrying heat straight out of the process. None of these losses show up as a single number on a fuel invoice — they show up as a specific fuel consumption that's stubbornly higher than the kiln's design figure, month after month, without anyone quite able to say why. A structured heat balance turns that mystery into four measurable numbers, and iFactory's plant monitoring tools are built to keep each one visible instead of buried in an annual audit report.
Your Kiln Isn't Inefficient. It's Losing Heat in Four Very Specific Places.
Exhaust gas, shell radiation, cooler stack air, and dust each carry away a measurable share of every kilocalorie you burn. Find the share, and the fuel savings plan writes itself.
Where the Heat Actually Goes: A Typical Kiln Heat Balance
Published kiln energy audits vary by design, cooler type, and refractory condition, but they consistently point to the same four categories carrying the bulk of avoidable loss. Seeing them side by side, sized to scale, is usually the moment a plant manager stops treating fuel consumption as a fixed cost and starts treating it as four separate improvement projects.
The False Air Multiplier: Why a Small Leak Costs More Than It Looks Like
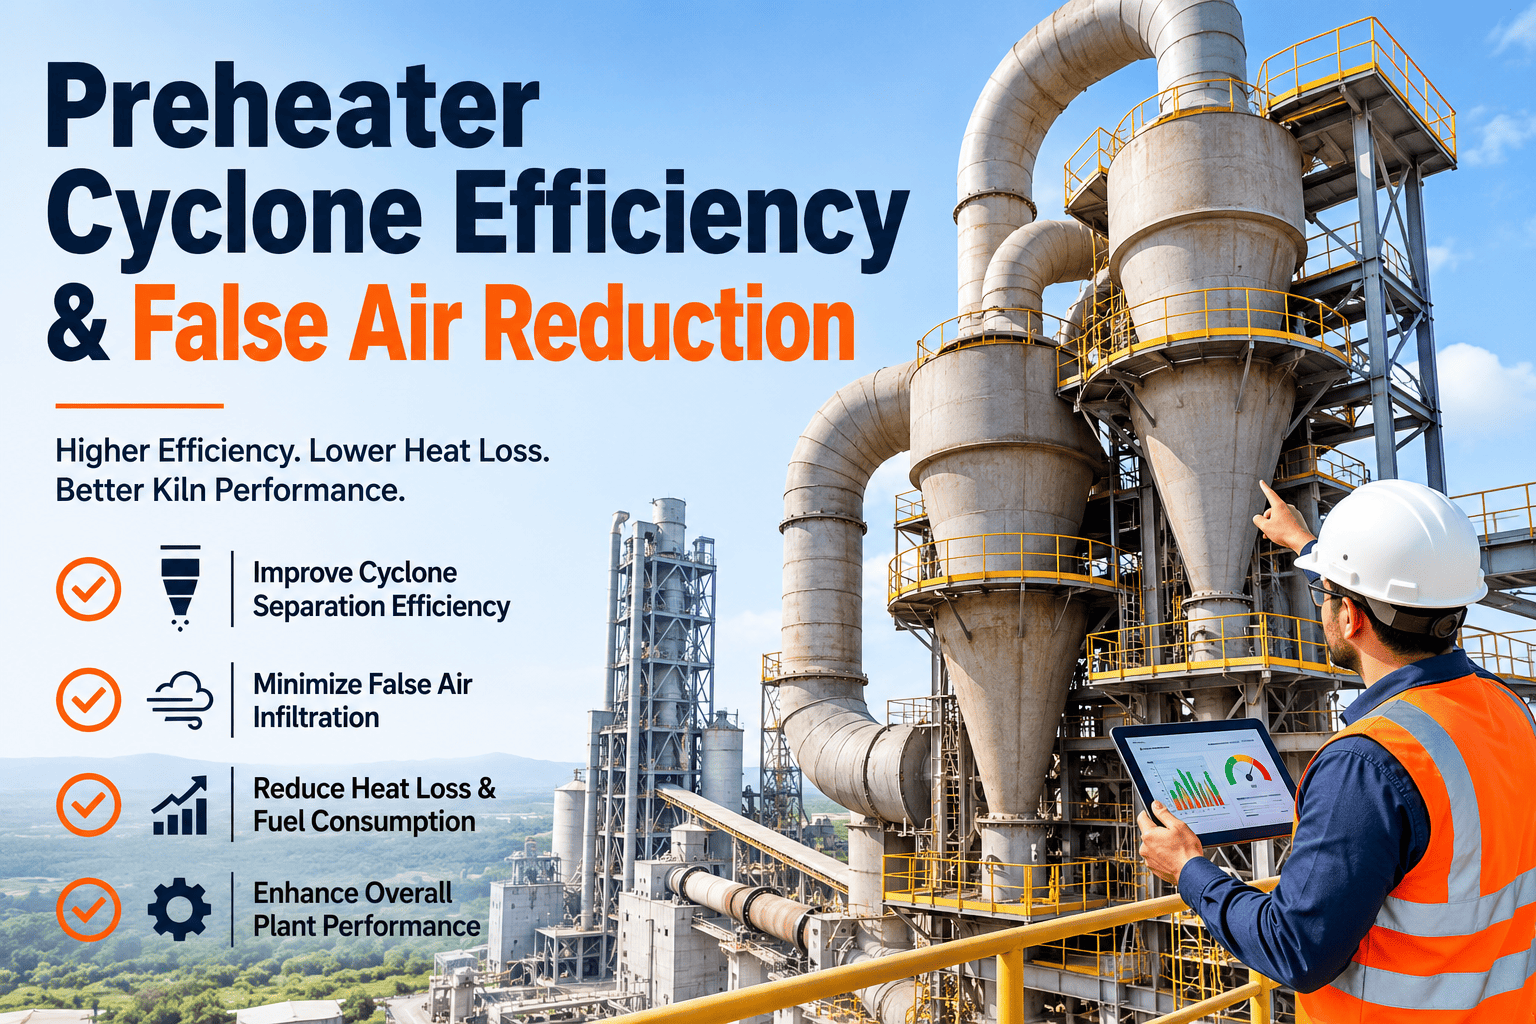
False air entering through cyclone flap valves, duct joints, or inspection doors dilutes the kiln gas stream, and every stage that dilution passes through before exiting the stack compounds the fuel penalty. A five-stage preheater shows this compounding effect clearly: the same 0.5% increase in cyclone exhaust oxygen costs progressively more heat the further downstream it's measured, because each stage has already spent extra fuel trying to maintain the process gas temperature against the diluted stream above it.
| Preheater Stage | Heat Cost per 0.5% Excess O2 Increase |
|---|---|
| Top stage (Stage I) | 12 kcal/kg clinker |
| Stage II | 22 kcal/kg clinker |
| Stage III | 34 kcal/kg clinker |
| Stage IV | 45 kcal/kg clinker |
| Stage V (bottom) | 60 kcal/kg clinker |
A single cracked expansion joint or a worn flap valve at a lower cyclone stage is therefore worth fixing first — not because it's the easiest repair, but because its position in the gas path makes it the most expensive leak on the kiln.
Four Loss Categories. One Dashboard That Tracks All of Them.
Exhaust gas temperature, shell hot spots, cooler vent conditions, and dust loading all move independently — but they all trace back to the same fuel bill. iFactory brings the readings together so the loss that's actually growing gets fixed first.
Shell Loss Is a Refractory Problem Wearing a Different Name
Of the four major loss categories, shell radiation is the one most directly tied to a maintenance condition rather than a process control setting. A hot shell isn't an electrical or combustion issue — it's refractory brick that has worn thin enough to stop doing its job as a thermal barrier, and the relationship between the two is close enough to use as a working diagnostic.
Building a Loss Reduction Program: Four Steps
Establish the current heat balance
Collect fuel flow and calorific value, kiln feed rate and moisture, combustion air volumes, preheater exit gas temperature, cooler vent conditions, and a full shell thermal survey — most plants already generate this data through existing instrumentation.
Rank losses against design baseline
Compare each measured loss category against its design-stage figure to see which one has drifted furthest, rather than assuming the largest category is automatically the most fixable one.
Fix the fastest-payback item first
False air seal repairs and refractory thickness monitoring typically return investment within a single fiscal quarter, making them the natural starting point ahead of larger capital projects like waste heat recovery.
Re-measure and trend continuously
A heat balance is not a one-time audit — exhaust gas temperature, shell condition, and cooler performance all drift over months, and only continuous trending catches the next leak before it grows into a stage-five problem.
A Composite Scenario: What a Sealed Riser Duct Was Actually Worth
A 5,000 TPD Line, One Cracked Expansion Joint
Consider a 5,000 tonne-per-day kiln line running with roughly 5% false air across the preheater — not an unusual figure, and not one that had triggered any alarm, since kiln output and clinker quality both looked normal. Across 320 operating days at a fuel cost of roughly $9 per gigajoule, that leak level was quietly costing the plant approximately $215,000 a year, almost entirely traced back to a worn riser duct expansion joint and a set of aging cyclone flap valves the team had walked past on inspection rounds for months.
A seal and gasket repair program addressing both points cost under $35,000 installed. The exhaust gas loss, measured against the previous audit, came in nearly a third higher than the kiln's original design figure — almost entirely attributable to those two leak points. Once resealed, the fuel consumption improvement showed up in the very next kiln campaign's numbers, not as a modeled projection but as a measured drop in specific fuel consumption.
The broader lesson mirrors what shows up across most kiln energy audits: the highest-value fix is rarely the most technically complex one. It's the leak, the crack, or the worn seal that nobody had measured recently enough to notice was getting worse.
Metrics That Show a Heat Balance Program Is Working
Whether kcal/kg clinker is trending down toward the design figure across successive campaigns, rather than holding flat or drifting upward between planned outages.
Whether cyclone exhaust oxygen readings are staying within the optimal control band, typically 1.0-1.5%, instead of creeping upward as an early sign of false air ingress.
Whether the number of shell zones trending more than 20°C above their three-month rolling average is shrinking as refractory monitoring and targeted repair take effect.
Whether a growing share of cooler stack air is being redirected as secondary or tertiary combustion air rather than vented as an unrecovered loss.
Frequently Asked Questions
What data does a kiln heat balance audit actually require?
A complete audit needs fuel flow and calorific value, kiln feed rate and moisture content, combustion air volumes, preheater exit gas temperature and flow, cooler vent air conditions, and a shell surface temperature survey. Most plants already generate this data through existing instrumentation — the audit's real value is in reconciling all of it into a single balance rather than reading each sensor in isolation. Visit support for a walkthrough of the data points your plant likely already has available.
Which loss category usually offers the fastest payback to fix?
False air sealing at the riser duct and lower cyclone stages typically returns the fastest payback, often inside a single fiscal quarter, because the fix cost is low relative to the fuel savings and the impact shows up immediately in the following campaign's fuel consumption numbers. Refractory thickness monitoring and targeted shell repair usually follows close behind.
How does false air at one preheater stage affect a completely different stage?
Because gas flows upward through the preheater, dilution introduced at a lower stage forces every stage above it to work harder maintaining process gas temperature, which is why the same percentage increase in excess oxygen costs progressively more heat the lower in the tower it's measured — a leak near Stage V is worth far more fuel than an identical leak near the top stage.
Is shell radiation loss always a refractory problem?
In the large majority of cases, yes — a burning zone shell temperature climbing above roughly 330°C is a strong signal that brick thickness in that zone has dropped below the point where it can still function as an effective thermal barrier. Tracking shell temperature against a brick-zone map over time is generally a more reliable early warning than waiting for a visual hot spot during a walk inspection.
How does iFactory help track kiln heat balance losses over time?
iFactory logs exhaust gas temperature, shell thermal scans, cooler vent readings, and false air indicators against the kiln's asset record, turning four separate loss streams into one continuous trend line your process and maintenance teams can act on together. Book a demo to see how the heat balance dashboard connects to your existing instrumentation.
The Fuel You're Losing Is Already Being Measured. It Just Isn't Being Connected.
Exhaust gas temperature, shell scans, and cooler readings usually live in separate logs, checked by separate teams, on separate schedules. iFactory puts all four heat balance losses on one screen so the next leak gets caught before it costs another quarter of fuel.