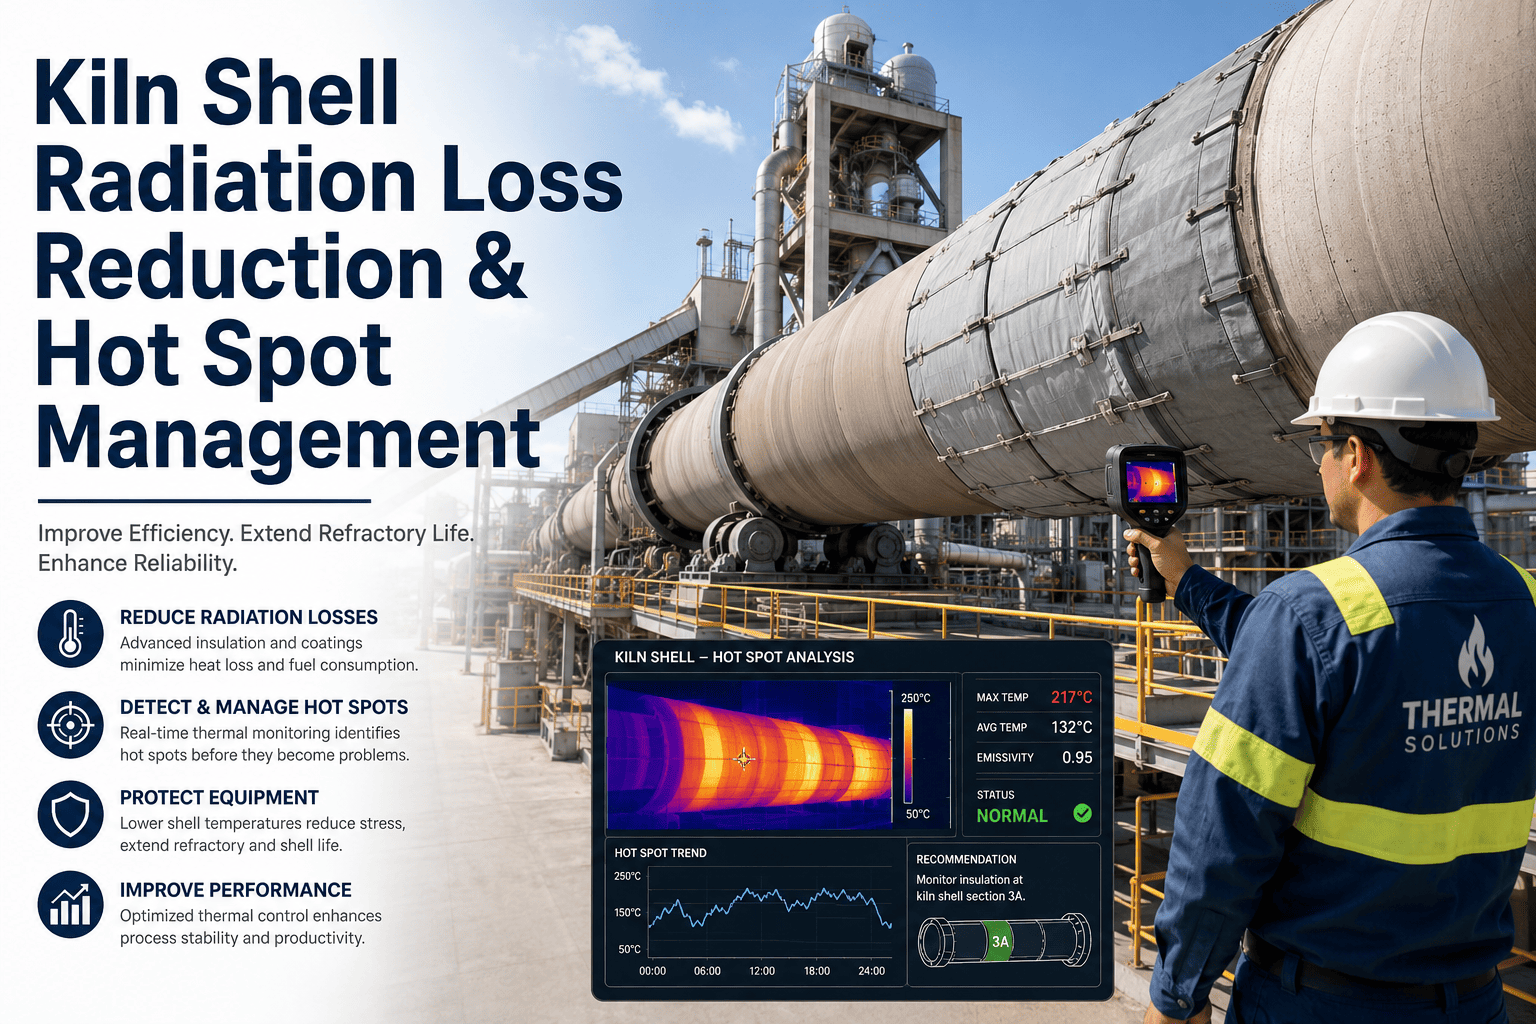
Kiln Shell Radiation Loss Reduction & Hot Spot Management

By Johnson on July 11, 2026

kiln-shell-radiation-loss-reduction-insulation-coating

Cement kiln shells routinely radiate ten to fifteen percent of total thermal energy input straight into the plant atmosphere, and most plants accept this as an unavoidable cost of operation because their approach to managing it consists of walking the shell with a handheld pyrometer once per shift and hoping the refractory holds until the next scheduled shutdown. The reality is that shell radiation loss is a continuously variable parameter driven by refractory degradation, coating instability, and shell deformation that can be tracked, quantified, and reduced with the same analytical rigor applied to specific energy consumption at the mill. iFactory correlates shell scanner data, refractory condition records, and process parameters into a live thermal loss model that shows exactly where your kiln is bleeding energy and what the refractory condition underneath looks like. You can book a demo to see your kiln shell thermal profile modeled this way.

KILN THERMAL EFFICIENCY · REFRACTORY MONITORING · RADIATION LOSS

Every Degree Your Kiln Shell Radiates Above Ambient Is a Degree You Paid Coal or Gas to Create

iFactory builds a live thermal loss model from shell scanner data and refractory records, showing exactly where your kiln is bleeding energy and what the underlying brick condition looks like at every point along the shell.

THERMAL LOSS DISTRIBUTION

Where the Energy You Put Into Your Kiln Actually Ends Up

Before addressing shell radiation loss specifically, it is essential to see it in context against the other major thermal loss pathways in a cement kiln system. The stacked profile below represents a typical dry-process kiln with a five-stage preheater, showing the proportional distribution of energy leaving the system through each pathway during normal stable operation.

27% Preheater Exit Gas
24% Cooler Exhaust
12% Shell Radiation
7% Clinker Discharge
4% Cooler Radiation
26% Useful Heat (Clinker)
Shell radiation at twelve percent represents the single largest controllable loss pathway after exhaust gas and cooler losses, making it the most impactful target for reduction without major equipment modification.
REFRACTORY CONDITION GRADING

Four Refractory Grades That Determine Your Shell Temperature at Every Point

Shell temperature is a direct indicator of the refractory and coating condition beneath it, but reading the number alone without understanding the grading scale leads to either unnecessary alarm or dangerous complacency. The four grades below define the relationship between what the scanner sees on the shell surface and what the refractory condition actually looks like inside the kiln.

GRADE A
Below 250 C
Stable Refractory With Intact Coating
Brick thickness above sixty percent of original, coating layer continuous and adherent, shell surface temperature uniform and within design envelope, no visible hot spots on scanner output, estimated remaining brick life exceeds current operating campaign interval.
GRADE B
250 - 320 C
Moderate Wear With Intermittent Coating
Brick thickness between forty and sixty percent of original, coating present but showing intermittent patches of exposure during kiln rotation, shell temperature fluctuates with each revolution as bare spots pass the scanner, remaining brick life requires monitoring against planned shutdown schedule.
GRADE C
320 - 380 C
Advanced Wear With Frequent Coating Loss
Brick thickness between twenty and forty percent of original, coating unstable and frequently lost during process upsets or load changes, shell temperature shows pronounced peaks during each revolution indicating large bare areas, remaining brick life is limited and shutdown planning should begin if not already scheduled.
GRADE D
Above 380 C
Critical Wear With Red Spot Risk
Brick thickness below twenty percent of original or completely absent, no coating protection remaining, shell temperature approaching or exceeding red spot threshold of four hundred degrees, immediate risk of shell deformation or forced shutdown, shell cooling fans required continuously and emergency kiln shutdown criteria under evaluation.
KILN ZONE TEMPERATURE MAP

Shell Temperature Behavior Changes Dramatically Across Each Kiln Zone

The burning zone gets the most attention, but radiation loss behavior is distinctly different in each section of the kiln because the refractory types, process temperatures, and coating dynamics change from one zone to the next. The mapped profile below shows the typical shell temperature ranges and dominant radiation loss drivers for each zone in a standard dry-process kiln.

Inlet / Feed End
200 - 280 C
Dust build-up on shell exterior acts as unintended insulation, masking true refractory condition and making scanner readings unreliable without accounting for the insulating dust layer thickness.
Calcining Zone
280 - 340 C
Alkaline infiltration from raw meal attacks refractory joints and causes brick structural degradation that reduces thermal resistance progressively without producing sharp temperature spikes visible on the scanner.
Upper Transition Zone
300 - 380 C
No stable coating forms in this region, so the refractory is directly exposed to process gas and radiation with no protective layer, making it the zone where shell temperature most directly reflects brick thickness.
Burning Zone
250 - 450 C
Coating dynamics dominate shell temperature behavior, where a stable coating can mask severe brick loss behind low shell temperatures, while coating collapse exposes thin brick and drives rapid temperature excursions within minutes.
Lower Transition / Cooling
280 - 350 C
Thermal cycling from clinker discharge temperature fluctuations causes refractory spalling at the brick surface, creating gradual thickness loss that raises baseline shell temperature over weeks rather than hours.
HOT SPOT ESCALATION PROTOCOL

The Four-Stage Response Framework That Prevents Red Spots From Becoming Forced Shutdowns

A hot spot does not jump from normal to red spot in a single step. It follows a predictable escalation path where the correct intervention at each stage prevents progression to the next. The protocol below defines the temperature thresholds, required actions, and decision criteria at each escalation level.

STAGE 1
Shell Temp 280 - 320 C
ELEVATED
Deploy shell cooling fans to the affected area, increase scanner sampling frequency, review process parameters for coating instability causes, log the location and temperature for trend tracking against previous rotations.
STAGE 2
Shell Temp 320 - 370 C
WARNING
Verify all shell cooling fans are operational and correctly positioned, reduce kiln feed rate by five to ten percent to lower thermal load in the affected zone, assess whether coating adjustment through flame or raw meal changes is feasible, notify shift supervisor and refractory engineer.
STAGE 3
Shell Temp 370 - 400 C
CRITICAL
Begin controlled kiln slow-down to reduce thermal input, evaluate whether the hot spot area can be coated through targeted process adjustments or whether kiln shutdown is unavoidable, prepare for potential emergency shutdown by confirming spare refractory availability and outage crew readiness.
STAGE 4
Shell Temp Above 400 C
RED SPOT
Initiate emergency kiln shutdown procedure, stop fuel input and maintain minimum rotation to prevent shell distortion, continue shell cooling fans until shell temperature drops below three hundred degrees, do not resume kiln operation until the affected area is inspected and refractory is repaired or replaced.
COATING STABILITY FACTORS

Six Process Variables That Determine Whether Your Coating Holds or Falls Away

Coating in the burning zone is the single most important factor controlling shell temperature and radiation loss in that zone, yet many plants treat coating formation as a random occurrence rather than the result of specific process conditions that can be monitored and controlled. The six factors below are the primary variables that determine coating stability.

01

Burning Zone Temperature Profile

Flame temperature must be high enough to melt and deposit clinker liquid phase on the brick surface but not so high that it prevents adhesion or burns away existing coating through excessive liquid fluidity.

02

Raw Meal Liquid Phase Content

The percentage of liquid phase at burning zone temperature, determined by raw meal chemistry and silica modulus, controls how much coating material is available for deposition and how strongly it adheres to the brick surface.

03

Flame Shape and Impingement

A long, sweeping flame distributes heat evenly and promotes uniform coating, while a short or impinging flame concentrates heat on one side of the kiln, preventing coating formation and accelerating local brick wear.

04

Kiln Rotational Speed

Rotational speed controls the dwell time of clinker in the burning zone and the mechanical stress applied to the coating layer, where excessive speed can shear coating from the brick surface before it fully adheres.

05

Sulfur and Alkali Circulation

Volatile recirculation of sulfur, potassium, and sodium compounds changes the melting behavior and viscosity of the coating material, where excessive volatiles can cause coating to become unstable and periodically shed in large sections.

06

Feed Rate Stability

Rapid feed rate changes alter the thermal balance in the burning zone faster than the coating can adjust, causing thermal shock that cracks and detaches coating from the brick surface in the affected area.

Handheld Pyrometer Walk-Downs Tell You What the Shell Temperature Was at the Moment You Walked Past It

iFactory's thermal loss model runs continuously against your shell scanner data, tracking refractory degradation and coating instability at every point on the kiln so you see the hot spot forming before it reaches the escalation threshold.

SCANNER VS MANUAL INSPECTION

Why Shell Scanners and Handheld Pyrometers Answer Fundamentally Different Questions

Many plants operate both a shell scanner and a manual pyrometer inspection program without clearly understanding that these two methods serve different purposes and produce different types of information. The comparison below clarifies what each method can and cannot deliver for radiation loss management.

Inspection Parameter Manual Pyrometer Walk-Down Continuous Shell Scanner
Coverage Frequency Once or twice per shift at best, covering only the shell sections accessible from walkways Continuous scanning of the entire shell circumference every rotation, with no gaps in coverage
Temperature Resolution Single point readings at manually selected locations with variable spacing between measurement points High-density temperature map with readings every few centimeters along the shell length during each rotation
Coating Collapse Detection May miss rapid coating collapse if it occurs between inspection rounds and the area re-coats before the next walk-down Captures the full temperature excursion profile as bare brick is exposed and tracks the re-cooling as coating reforms
Trend Analysis Capability Limited to comparing notes between shifts, no structured time-series data for degradation trending Full historical temperature archive at every shell location enabling degradation rate calculation and remaining life estimation
Radiation Loss Quantification Cannot calculate total radiation loss because point measurements do not cover the full shell surface area Integrates temperature data across the entire shell surface to calculate total radiated energy loss in real time
Dust Layer Compensation Operator can visually assess dust build-up and attempt to measure beneath it at accessible locations Requires separate dust layer thickness measurement or modeling to correct scanner readings for insulating dust effect
Operator Dependency Highly dependent on individual operator technique, walking speed, and judgment about where to measure Automated and repeatable, with no variation in measurement technique between shifts or operators
MEASURED RESULTS

What Cement Plants Report After Implementing Systematic Shell Loss Management

The outcomes below reflect results reported by cement plants after deploying continuous shell temperature monitoring integrated with refractory condition tracking and coating stability analysis as part of a structured thermal loss reduction program.

15-20%
Reduction in total kiln shell radiation loss achieved by identifying and repairing refractory degradation areas before they expanded into large bare zones
40%
Reduction in red spot events per year because the escalation protocol caught developing hot spots at Stage 1 or Stage 2 instead of discovering them at Stage 4
8-12%
Extension in average refractory campaign life achieved by using degradation rate data to optimize brick replacement timing rather than replacing on fixed calendar intervals
3-5%
Reduction in specific heat consumption directly attributable to lower shell radiation losses after systematic refractory and coating management was implemented
FREQUENTLY ASKED QUESTIONS

Questions Process and Refractory Engineers Ask About Shell Radiation Loss Management

How does dust accumulation on the shell exterior affect scanner accuracy and radiation loss calculations?
Dust build-up on the shell acts as an unintended insulating layer that lowers the surface temperature the scanner measures while the actual brick surface behind the dust may be significantly hotter, creating a false sense of security if the dust layer is not accounted for in the analysis. The thermal model compensates by correlating scanner readings with periodic manual inspections that include dust thickness measurement, and by tracking the rate of temperature change rather than absolute temperature alone, since a rapidly thinning refractory under a constant dust layer will still produce a detectable upward trend even if the absolute reading appears acceptable. Book a demo to see how dust compensation is handled in the model.
Can the system distinguish between a hot spot caused by refractory loss and one caused by coating collapse?
The model distinguishes between these two causes by analyzing the temperature excursion profile shape and duration, where refractory loss produces a sustained temperature increase that does not recover as the kiln rotates, while coating collapse produces a sharp spike that follows a repeating pattern each revolution and typically recovers partially or fully as coating begins to reform. Process parameter data from the same time window, such as changes in kiln torque, oxygen levels, or feed rate, provides additional context that helps confirm whether the temperature change originated from a process upset affecting coating or from a mechanical refractory failure. Contact our support team to discuss how your scanner data would be classified.
What is the minimum scanner resolution needed to support useful radiation loss quantification?
Useful radiation loss calculation requires sufficient spatial resolution to identify hot spots that are smaller than one meter in axial length, which corresponds to a scanner with at least forty to sixty measurement points per meter of shell length to ensure that localized bare areas are not averaged out by adjacent cooler readings. Older scanners with lower resolution can still be used for general monitoring and trend detection, but the radiation loss calculation will have wider confidence intervals because small hot spots may fall between measurement points and their contribution to total loss will be underestimated. Book a demo to evaluate your scanner resolution against model requirements.
Does the model account for wind speed and ambient temperature effects on shell radiation loss?
Ambient conditions are factored into the radiation and convection loss calculation because the same shell temperature produces different heat loss rates depending on whether the surrounding air is still or moving and whether the ambient temperature is near freezing or above forty degrees. The model ingests local weather data or plant-installed ambient sensors to continuously adjust the loss calculation, so a shell section reading three hundred and fifty degrees in winter with high wind will show a different loss rate than the same section reading three hundred and fifty degrees in summer with calm conditions, which is critical for accurately quantifying the actual energy and cost impact of each hot spot. Contact our support team to discuss ambient data integration for your plant.
How does shell deformation from past red spots affect the accuracy of the thermal model going forward?
Shell deformation from previous red spots creates localized areas where the refractory does not sit flat against the shell, producing air gaps that increase thermal resistance in some locations and create stress concentration points that accelerate brick wear in others, both of which change the relationship between shell temperature and brick thickness. The model incorporates known deformation locations from shell profile surveys as correction factors in the thermal calculation, and tracks whether deformed areas show different degradation rates than undeformed sections of the same zone, which improves the accuracy of remaining life predictions for areas with a history of thermal damage. Book a demo to see how deformation data is integrated into the model.

Stop Accepting Shell Radiation Loss as a Fixed Cost and Start Managing It as a Controllable Variable

iFactory's thermal loss model turns your shell scanner data into a live radiation loss map with refractory condition grading and hot spot escalation tracking, giving your process and refractory engineers the information they need to reduce energy waste and extend brick life simultaneously.


Share This Story, Choose Your Platform!