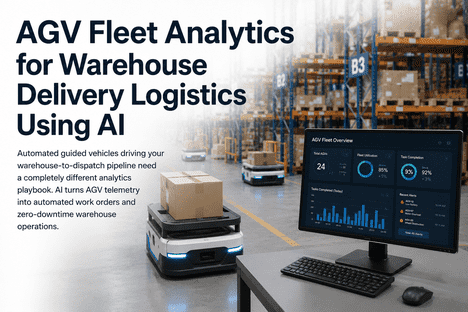
AGV Fleet analytics for Warehouse Delivery Logistics Using AI
By Astrid on May 25, 2026
An AGV fleet running 24/7 across a high-velocity warehouse generates thousands of telemetry signals every hour — battery state-of-health, drive motor current and temperature, encoder accuracy, SLAM navigation confidence, safety scanner status, charging contact wear — and most of those signals are landing nowhere. Spreadsheet maintenance schedules inherited from forklift programmes do not read AGV telemetry, calendar-based PM does not respond to actual operating load, and the supplier's warranty service ticket only opens once the vehicle has already stopped. The cost of letting that gap exist is documented: navigation accuracy drift causes $2,000 to $8,000 per blockage incident, drive-motor failure escalates to $3,000 to $12,000 including downtime, and a full battery pack replacement reaches $8,000 to $20,000 — before counting the throughput, despatch, and SLA impact when the affected vehicle takes its task queue offline during a peak fulfilment window. AGV fleets need a completely different analytics playbook from the forklifts they replaced. iFactory AI ingests AGV telemetry from the fleet manager and BMS, applies machine-learning anomaly detection across the six failure-mode signal groups, and auto-generates structured CMMS work orders 48 to 96 hours before the vehicle would go offline during a delivery shift. Book a Demo to see live AGV fleet analytics mapped against your warehouse-to-despatch pipeline.
48–96 hr
Advance warning window from AGV telemetry signatures before functional failure
80% SoH
LiFePO4 state-of-health threshold that triggers AGV battery replacement planning
$8–20K
Per-pack AGV battery replacement cost protected by SoH monitoring and BMS analytics
4–6 wks
Deployment from fleet manager integration to live predictive AGV analytics
Why AGV Fleets Need a Different Analytics Playbook Than Forklifts
A manual forklift has one degradation profile that matters operationally — the operator notices when something feels wrong and reports it. An AGV has none of that. It does not call in when its drive motor temperature begins drifting upward at constant load, when its battery's voltage drop rate per cycle starts steepening, when its encoder is slipping a few counts per pallet move, or when its safety laser scanner is reading marginally elevated fault rates on the morning route. By the time the AGV does communicate the problem, it is already an emergency stop, a navigation blockage, or a charging cycle that the fleet manager cannot complete. The vehicle is offline, the task queue rebalances onto the remaining fleet, and throughput drops by exactly one AGV's worth of capacity during whichever shift the failure happened to land in.
The signals that predict AGV failures are well understood and they are present continuously in the telemetry the fleet manager already collects — they simply need a layer of analytics that knows what to do with them. iFactory AI ingests data from the major AGV fleet management systems, normalises it across mixed fleets, runs machine-learning anomaly detection against per-vehicle baselines, and pushes structured work orders into the CMMS before the AGV goes offline. The maintenance team works against actual condition data on the highest-risk vehicles rather than against a calendar that has no relationship to how hard each AGV is actually working. Book a Demo to see what your AGV fleet would look like through a live analytics layer.
Battery SoH and Voltage-Drop Analytics
AI ingests BMS telemetry to track state-of-health, charge-cycle count, voltage drop rate per cycle, cell-level temperature, and cell-balance variance across every LiFePO4 pack in the fleet. The model flags packs approaching the 80% SoH replacement threshold weeks in advance, cell imbalance above 0.1V before reconditioning is required, and degraded discharge curves before they cause mid-shift capacity failures during peak despatch windows.
Drive Motor Current and Thermal Trending
Rising drive-motor temperature at constant load and rising current draw at constant speed are the earliest signatures of bearing wear and winding insulation degradation — typically appearing 48 to 96 hours before functional failure. iFactory's model maintains a per-vehicle baseline under representative load and flags drift before the AGV trips a thermal alarm in the middle of a despatch run.
Encoder Drift and Wheel Wear Detection
Incremental encoder drift beyond defined tolerances indicates wheel wear, encoder damage, or coupling slip — all of which manifest as positioning errors and lateral drift before they become navigation faults. AI tracks encoder count consistency against actual travel distance and flags units developing tolerance-band drift well before the AGV starts missing pickup positions or colliding with rack legs.
Safety Scanner and E-Stop Pattern Analytics
Safety laser scanner fault rates, emergency-stop event frequency, manual override events, and route-obstruction dwell time are tracked per vehicle and per zone. iFactory's model surfaces vehicles with rising scanner fault rates indicating contamination or alignment drift, plus zone-level patterns indicating layout or traffic-rule issues — both compliance-relevant under ANSI/ITSDF B56.5 and ISO 3691-4.
SLAM Navigation Confidence Monitoring
LiDAR detection range, scan-match confidence, and localisation accuracy against the operating ±20mm tolerance are tracked continuously. Vehicles showing declining navigation confidence due to sensor contamination, reflector misalignment, or environmental change are flagged for cleaning, recalibration, or map refresh before they begin generating route blockages and traffic interventions.
Fleet Manager, WMS and CMMS Integration
iFactory connects to AGV fleet management platforms across major manufacturers, plus Manhattan Associates, Blue Yonder, SAP EWM, and Infor WMS, plus IBM Maximo, SAP PM, ServiceMax, and Infor EAM CMMS. AGV telemetry is normalised across mixed fleets, work orders are auto-generated with vehicle ID, failed component, and predicted failure window, and the digital Shift Logbook carries every AGV alert and intervention across shift handovers.
Forklift-Style PM vs AGV Telemetry Analytics: Where the Maintenance Model Has to Change
Most warehouses moving from manual MHE to AGV fleets initially try to run AGV maintenance on the same calendar PM framework they used for their forklift programme — fixed operating-hour intervals, scheduled component swaps, walk-around inspections. The result is consistent across deployments: over-servicing on lightly used vehicles, under-servicing on heavily used ones, and unplanned downtime concentrated in exactly the failure modes that the telemetry already had visibility on. The table maps where the maintenance model has to change.
Fleet Management Dimension
Calendar PM Inherited from Forklift Programme
iFactory AI AGV Telemetry Analytics
Battery Replacement Trigger
Replaced at fixed cycle count from manufacturer documentation. SoH not monitored continuously. Replacements happen too early on light-duty vehicles (cost waste) or too late on heavy-duty vehicles (mid-shift capacity failures during peak windows).
Live SoH per pack tracked from BMS telemetry. Replacement triggered when capacity actually approaches 80% threshold, not on cycle count. Working capital optimised; mid-shift capacity failures effectively eliminated across the LiFePO4 fleet.
Drive Motor Health Visibility
Motor condition assessed at scheduled PM. Between visits, current and thermal trends are unread. First indication of degradation is usually a thermal trip on the floor — by which point the vehicle is already offline and the task queue is already rebalancing.
Continuous monitoring of motor current draw and temperature against per-vehicle baseline. Bearing-wear and insulation-degradation signatures detected 48 to 96 hours ahead. Replacement scheduled during off-peak windows with parts pre-staged.
Navigation Accuracy Tracking
Navigation problems detected only when an AGV starts generating blockages, missed pickup positions, or collision near-misses. By that point operations has already absorbed throughput impact and field-service intervention is reactive.
Encoder drift, SLAM confidence, and localisation against ±20mm tolerance tracked per vehicle continuously. Drift detected at sub-tolerance levels before it becomes operationally visible. Wheel and encoder service scheduled before route impact occurs.
Safety System Compliance
Annual ANSI/ITSDF B56.5 certification, monthly safety function checks, weekly scanner cleaning logged on paper or in a spreadsheet. Trend analysis across the fleet not visible; safety event patterns identified only in post-incident review.
Scanner fault rate, e-stop frequency, manual override count, and route-obstruction dwell time tracked per vehicle and per zone. Compliance documentation generated continuously; safety-event patterns surface as fleet-wide trends before they become recurring incidents.
Charging Contact and Dock Health
Charging contact corrosion discovered when an AGV fails to charge or charges intermittently. Failure typically discovered overnight or at start of shift, removing the vehicle from the morning task queue.
Charging session telemetry — start voltage, charge curve, contact resistance — monitored per dock and per vehicle. Degrading contacts and overloaded dock positions flagged before they cause charging failures or peak-window dock queues.
Spare Parts Procurement Lead Time
Failure detected; parts ordered at standard or emergency lead time. Specialised AGV components (drive units, scanner assemblies, BMS boards) can carry 4 to 8 week lead times. Emergency orders frequently incur 2 to 3× standard cost premium.
AI predicts failure window weeks in advance; parts ordered at standard lead time and standard cost. Failure window and parts arrival aligned. Emergency procurement premium effectively eliminated across the instrumented fleet.
Every AGV Carrying a Hidden Degradation Signal Is a Throughput Outage Waiting for Its Shift.
iFactory AI ingests AGV fleet telemetry — battery SoH, drive motor current and thermal, encoder accuracy, SLAM confidence, safety scanner status, charging contact health — and generates structured CMMS work orders 48 to 96 hours before the vehicle goes offline. Book a Demo to see live analytics running against your warehouse AGV fleet.
How iFactory AI Deploys Across a Warehouse AGV Fleet
The 4 to 6 week deployment sequence is structured to deliver live AGV telemetry analytics within the first two weeks of fleet manager integration, defect classification by week four, and automated CMMS work orders by week six. Each phase produces a measurable deliverable to the maintenance and operations teams that will act on the output.
Weeks 1–2
Fleet Audit, Telemetry Scope and Fleet Manager Integration
AGV fleet inventoried by manufacturer, model, vehicle age, charge-cycle history, and route profile. Fleet manager integration scoped — telemetry feed, BMS data, navigation logs, safety event stream, charging session records. WMS, ERP, and CMMS integration points confirmed. Per-vehicle baseline data ingestion begun across drive motor current and temperature, battery SoH and cycle history, encoder accuracy, SLAM confidence, scanner fault rate, and charging contact behaviour.
Weeks 2–4
Baseline Calibration, Anomaly Detection and Latent-Defect Surfacing
iFactory's machine-learning models calibrated to per-vehicle healthy baseline under representative load. Anomaly detection activated against each of the six failure-mode signal groups. First-pass anomaly review with maintenance leadership typically surfaces latent defects that calendar PM had missed — vehicles already drifting on encoder accuracy, packs below the SoH threshold, or motors trending thermally above baseline that have not yet caused a visible incident. Action prioritised against route impact and replacement lead time.
Weeks 4–6
Defect Classification, CMMS Automation and Shift Logbook Activation
Defect classification tuned to the fleet's specific manufacturer mix and operating profile. Automated CMMS work order generation activated with vehicle ID, failed component, severity score, recommended parts, and predicted failure window pushed to IBM Maximo, SAP PM, ServiceMax, or Infor EAM. Shift Logbook integrated so AGV alerts, technician interventions, and post-repair baseline resets are captured across every handover. Operations and maintenance leadership trained on alert triage; full handover with monthly fleet-condition reporting in place.
DEPLOYMENT OUTCOME: LATENT AGV DEFECTS SURFACED INSIDE THE FIRST THREE WEEKS
Warehouses completing iFactory's 4–6 week AGV analytics deployment consistently surface latent defects within the first 3 weeks of fleet manager integration — battery packs already below 80% SoH, drive motors trending thermally above baseline, encoders drifting outside tolerance. Programmes typically achieve 48 to 96 hours of advance warning per failure event, eliminating the 2 to 3× emergency-parts premium and protecting fleet availability across every despatch shift.
48–96 hr
Pre-failure warning window across drive motor, battery, and encoder failure modes
15–30%
Battery life extension achievable with smart charging and SoH-driven replacement timing
2–3×
Emergency parts freight premium eliminated via ahead-of-need procurement
AGV Fleet Analytics: Use Cases from Warehouse Logistics Deployments
The following outcomes are drawn from iFactory AGV analytics deployments at operating warehouse and distribution facilities across e-commerce, 3PL, FMCG, and pharmaceutical distribution networks. Each use case reflects 9 to 14 month post-deployment performance data against the specific AGV failure mode the analytics layer was deployed to catch.
Use Case 01
Battery SoH-Driven Replacement Programme at E-Commerce Cross-Dock Hub
A high-velocity e-commerce cross-dock hub operating 42 AGVs had been running a uniform 3,000-cycle replacement programme on its LiFePO4 packs inherited from the AGV vendor's recommendation. The maintenance team suspected the policy was over-replacing on light-duty vehicles and under-replacing on the heavy-duty ones running the despatch loops, but had no fleet-wide SoH visibility to act on. iFactory ingested BMS telemetry across all 42 vehicles and built a continuous SoH model per pack. Within 6 weeks of activation, the model had identified 9 packs that had already crossed the 80% SoH threshold despite being below the cycle-count replacement trigger, and a further 14 packs that were significantly above the cycle count but still well above 80% SoH. The replacement programme shifted to SoH-triggered. Mid-shift capacity failures across the despatch window dropped to zero across the following 11 months, and net battery spend reduced 17% by stretching healthy packs and replacing only the genuinely degraded ones. Book a Demo to see how this applies to your AGV battery programme.
0 events
Mid-shift AGV capacity failures across the 11 months following SoH-driven programme
17%
Net battery spend reduction by replacing on SoH rather than fixed cycle count
9 packs
Packs already below 80% SoH despite being within the previous cycle-count window
Use Case 02
Drive Motor Thermal Trending on FMCG Tugger AGV Fleet
An FMCG distribution operator running 28 tugger-type AGVs across receiving and despatch loops had recorded four unplanned drive-motor thermal trips across an 8-month window, each carrying 4 to 7 hours of downtime per affected vehicle and an emergency motor-assembly freight premium of approximately 2.4× standard cost. iFactory's analytics layer was deployed and within the first month identified two vehicles trending thermally above baseline at constant load — current draw also creeping upward by 6 to 9% versus their healthy baseline. Both motors were replaced during planned weekend windows with parts ordered at standard lead time. Spectrum and thermal returned to baseline post-replacement; no unplanned drive-motor events recorded across the following 12 months. The same monitoring approach was extended to the wider fleet by week six.
0 events
Unplanned drive-motor thermal trips across 12 months post-deployment
6–9%
Constant-load current draw drift that flagged both motors before functional failure
2.4×
Emergency parts freight premium eliminated by predicting failure ahead of need
Use Case 03
Navigation Confidence Tracking on 3PL Pallet AGV Fleet
A 3PL operating 36 pallet AGVs across a multi-client ambient DC was experiencing rising rates of navigation-induced traffic blockages — vehicles reporting missed pickup positions, route deviation events, and minor lateral drift beyond the ±20mm operating tolerance. The fleet manager logged the events but provided no visibility into which vehicles were causing the pattern. iFactory ingested per-vehicle SLAM confidence scores, encoder accuracy data, and safety-scanner fault rates. Within 4 weeks the analytics layer had identified 7 vehicles with declining navigation confidence concentrated in the high-traffic aisle intersections — 5 driven by LiDAR contamination from forklift activity on the receiving side, 2 driven by encoder drift on the steering axle. Targeted scanner cleaning and encoder service eliminated 91% of the navigation-induced blockage events across the following quarter.
91%
Reduction in navigation-induced traffic blockage events post-remediation
7 vehicles
AGVs identified with declining navigation confidence prior to operational impact
±20mm
Operating-tolerance band tracked continuously per vehicle against live SLAM confidence
Expert Perspective: Where AGV Fleet Reliability Programmes Actually Break Down
Industry Perspective Automation Engineering and Fleet Reliability
"The mistake most warehouse operations make when they deploy AGVs is treating them as silent forklifts. They are not. The vehicle is constantly streaming telemetry the operations team already paid for and the maintenance team is not using. Battery state of health, motor current trending, encoder drift, scanner fault rates — these are not exotic measurements, they are sitting in the fleet manager's log files. The shift the leading operators have made is moving from spreadsheet-driven AGV maintenance to telemetry-driven analytics that turn those signals into work orders before the vehicle takes itself offline. Calendar PM is fine for changing oil on a yard truck. It is not a fit-for-purpose maintenance model for a fleet that is generating thousands of usable telemetry signals per hour."
Head of Automation Engineering UK 3PL and Distribution Operator (provided via iFactory deployment reference)
The supporting market data is consistent. Modern AGV fleets generate detectable telemetry signatures 48 to 96 hours before the most common failure modes — drive motor degradation, battery capacity decline, encoder drift, navigation confidence loss. LiFePO4 battery life is extendable by 15 to 30% with smart charging and SoH-driven replacement scheduling rather than cycle-count replacement. The 80% SoH threshold is the operational replacement trigger that protects mid-shift fleet availability. The remaining decision for warehouse operators is operational rather than technical — which fleet manager and CMMS the analytics layer integrates with, and how quickly the maintenance team can move off the inherited forklift PM model. Book a Demo to speak with iFactory's AGV analytics team about your warehouse fleet.
Conclusion: AGV Telemetry Analytics Is Now the Default Architecture for Warehouse Delivery Reliability
Warehouse delivery operations running AGV fleets do not have the option of running them on forklift-era maintenance models. The economics no longer support it. Documented per-incident failure costs of $2,000 to $20,000 across navigation, drive motor, and battery failure modes, predictable 48 to 96 hour pre-failure telemetry windows, and the relentless throughput demands of same-day and next-day fulfilment have made calendar PM operationally and financially indefensible. The architecture that combines AGV fleet telemetry with AI-driven anomaly detection and automated CMMS work orders is the default for any operator serious about fleet availability and despatch reliability.
iFactory AI delivers the AGV-specific capability stack: battery SoH and voltage-drop analytics from BMS telemetry, drive motor current and thermal trending against per-vehicle baselines, encoder drift and wheel-wear detection, safety scanner and e-stop pattern analytics, SLAM navigation confidence monitoring, charging contact and dock health analytics, plus a digital Shift Logbook carrying every alert, intervention, and baseline reset across shift handovers. Deployment runs 4 to 6 weeks from fleet manager integration to fully integrated analytics with latent defects surfaced inside the first three weeks. Book a Demo to receive an AGV fleet analytics assessment scoped to your specific fleet composition and despatch profile.
Frequently Asked Questions About AGV Fleet Analytics for Warehouse Delivery Logistics
Which AGV manufacturers and fleet management systems does iFactory AI integrate with?
iFactory integrates with major AGV and AMR fleet management platforms via OPC-UA, REST API, and direct fleet-manager telemetry feeds. Vehicle compatibility covers tugger AGVs, pallet AGVs, unit-load AGVs, and forklift AGVs from the main manufacturers in the market. WMS integration covers Manhattan Associates, Blue Yonder, SAP EWM, and Infor. CMMS integration covers IBM Maximo, SAP PM, ServiceMax, and Infor EAM. Integration is scoped during the week 1–2 fleet audit based on the operator's specific manufacturer mix.
Which AGV telemetry signals does iFactory monitor for predictive maintenance?
iFactory monitors the six telemetry signal groups that produce the highest-value failure predictions for warehouse AGV fleets: battery SoH and voltage-drop curves from BMS data, drive motor current draw and temperature, incremental encoder accuracy and drift, SLAM navigation confidence and LiDAR detection range, safety scanner fault rates and e-stop frequency, and charging contact behaviour with session-level voltage and current curves. These six signal groups together cover the failure modes that account for the majority of documented warehouse AGV downtime events.
How does the analytics layer handle a mixed-manufacturer AGV fleet?
Telemetry is normalised across manufacturers in the iFactory ingestion layer — battery SoH, motor current, encoder accuracy, and SLAM confidence are computed against a common per-vehicle baseline regardless of the underlying AGV brand. Operations and maintenance leadership work against a single fleet-wide health view rather than separate dashboards per manufacturer. This is the practical requirement for any warehouse operator who has standardised on more than one AGV platform across deployment phases or across mixed task types.
What advance warning window does the analytics layer typically provide?
For drive motor degradation, battery capacity decline, and encoder drift — the three highest-frequency AGV failure modes — telemetry signatures typically appear 48 to 96 hours before functional failure, giving the maintenance team enough planning time to schedule the intervention against a low-utilisation window, source parts at standard lead time, and protect the despatch shift the vehicle would otherwise have failed in. For battery replacement specifically, the SoH model typically provides 4 to 8 weeks of advance visibility against the 80% replacement threshold.
Does iFactory automatically generate CMMS work orders when an AGV telemetry anomaly is detected?
Yes. When a severity score crosses a configurable threshold, a structured work order is auto-generated with vehicle ID, failed component or signal group, defect classification, severity score, recommended part, and predicted failure window — pushed directly into IBM Maximo, SAP PM, ServiceMax, or Infor EAM. Spare parts procurement can be triggered ahead of the predicted failure date, which is the mechanism that eliminates the 2 to 3× emergency-order premium typical of reactive AGV maintenance.
How does the Shift Logbook integrate with the AGV analytics workflow?
Every AGV alert, severity-zone transition, technician response, parts replacement, and post-repair baseline reset is captured in iFactory's digital Shift Logbook against the affected vehicle. Incoming shifts see live fleet condition plus full intervention history. Operator observations from the floor — unusual noise from a specific AGV, charging-dock incidents, or near-miss safety events — are captured and correlated with telemetry data so qualitative observation enriches the quantitative analytics. No critical alert is lost between shifts; no operator observation goes unreviewed.
Battery SoH. Motor Thermal. Encoder Drift. SLAM Confidence. Automated Work Orders.
iFactory AI ingests AGV fleet manager and BMS telemetry, applies machine-learning anomaly detection across the six failure-mode signal groups, and generates structured CMMS work orders 48 to 96 hours before each AGV would go offline during a delivery shift. Latent defects surfaced inside the first three weeks of fleet-manager integration.
Stop Running AGV Fleets on Forklift-Era Maintenance Models. Deploy AGV Telemetry Analytics in 4–6 Weeks.
iFactory AI delivers AGV-specific predictive analytics across battery SoH, drive motor health, encoder accuracy, SLAM navigation confidence, safety scanner status, and charging contact behaviour — with automated CMMS work orders, predicted failure windows, and Shift Logbook continuity. Integrated with your fleet manager, WMS, CMMS, and ERP from day one.
48–96 hours advance warning on drive motor, battery, and encoder failures
SoH-driven battery replacement protecting against mid-shift capacity failures
Automated CMMS work orders with defect classification and predicted failure window
Latent fleet defects surfaced inside the first three weeks of integration