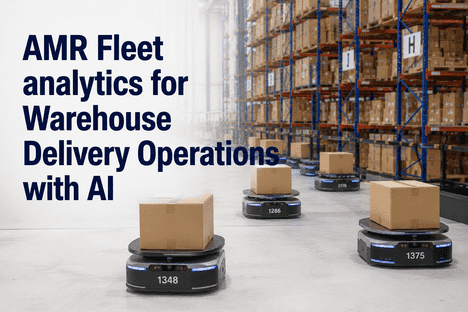
A fleet of 50 goods-to-person AMRs can replicate the productivity of 70 to 80 human pickers while running continuously across multiple shifts without fatigue — delivering pick-assist rates of 300 to 600 units per hour per robot high-velocity fulfilment environments. That throughput advantage is absolute when every robot is healthy. It collapses the moment wheels degrade, batteries drop below 80% capacity, LiDAR sensors accumulate contamination, or traction motors develop early-stage wear — and without AI telemetry analytics watching every robot in real time, those degradation curves are invisible until they become failures. A 15% route efficiency loss across just 20 AMRs translates to $90,000 or more in annual throughput reduction. A structured predictive maintenance programme keeping fleet uptime above 97% requires continuous sensor data and AI-driven degradation analysis — without it, uptime degrades to 80 to 85% within six months as wear accumulates across wheels, sensors, and batteries simultaneously. iFactory AI connects to AMR fleet telemetry to detect every degradation signal before it disrupts your warehouse-to-despatch pipeline. Book a Demo to see live AMR fleet health analytics mapped against your current delivery operations.
97%+
AMR fleet uptime achievable with structured AI predictive analytics programme
$90K+
Annual throughput loss from just 15% route efficiency degradation across 20 AMRs
68%
Improvement in battery capacity degradation with AI-driven maintenance scheduling
6 wks
Deployment timeline from fleet baseline audit to live AI AMR analytics monitoring
What AI AMR Fleet Analytics Actually Monitors — and Why It Matters for Delivery Speed
Autonomous mobile robots operate 24/7 across warehouse floors that cover hundreds of thousands of square feet, executing millions of navigation decisions per shift. The six component categories — drive wheels, LiDAR sensors, battery systems, traction motors, charging contacts, and communication modules — account for 95% of all AMR downtime events. Each degrades continuously under operational load, and each degrades at a rate that has no relationship to the fixed service intervals most fleets use. iFactory AI integrates directly with AMR fleet telemetry via OPC-UA, robot controller APIs, and fleet management system data feeds, establishing healthy operating baselines per robot and detecting degradation curves 2 to 6 weeks before they reach functional failure threshold.
When a wheel tread degrades from specification, the robot starts experiencing positioning errors. When a battery drops below 80% capacity, that robot returns to charge more frequently — effectively reducing active fleet size by 10 to 15% without a single alarm firing. When LiDAR contamination accumulates, navigation hesitation and path errors develop across high-traffic aisle intersections during peak pick windows. None of these degradation events announces itself. All of them are visible to AI analytics from the moment degradation begins. Book a Demo to see what your AMR fleet's current degradation profile looks like through iFactory AI.
Battery Degradation Analytics
AI tracks battery degradation curves across every robot in the fleet, modelling capacity decline rate, charge cycle count, and thermal history to predict when individual batteries will drop below 80% capacity — weeks before reduced capacity begins shrinking effective fleet size and degrading throughput during peak pick windows.
Drive Wheel and Traction Motor Health
Continuous monitoring of wheel wear rates, tread depth degradation, and traction motor current signatures detects the positioning errors, traction loss on smooth warehouse floors, and motor aging that cause navigation failures and delivery window misses — providing 2 to 6 weeks advance warning before mobility failure occurs.
LiDAR Sensor Contamination Detection
AI monitors LiDAR detection range, scan consistency, and navigation confidence scores to detect sensor contamination and degradation before dust accumulation reduces detection range below safe operational thresholds — preventing the navigation hesitation, speed reductions, and path errors that reduce throughput across high-traffic zone intersections.
Route Efficiency and Throughput Analytics
Real-time analysis of travel time per mission, route deviation frequency, collision near-miss events, and task completion rate per robot detects developing route inefficiencies and fleet-wide throughput degradation — surfacing the specific robots and zones where performance is declining before it impacts carrier cut-off achievement rates.
Charging Dock Utilisation Optimisation
Analytics across charging dock utilisation rates, queue wait times, and charging contact degradation identifies overloaded dock positions and failing contacts — enabling dock rebalancing that reduces charging queue times by 25 to 40% and maximises the number of robots available during peak fulfilment windows.
WMS, FMS and CMMS Integration
iFactory connects to Manhattan Associates, Blue Yonder, SAP EWM, and Infor WMS platforms, fleet management systems from MiR, Geek+, Locus, and OTTO, plus IBM Maximo and SAP PM CMMS — auto-generating structured work orders with part lists, failure probability scores, and technician scheduling aligned to planned maintenance windows.
Why Manual AMR Fleet Reviews Miss What AI Telemetry Analytics Catches
Most AMR fleets operate on scheduled maintenance intervals — quarterly wheel checks, semi-annual battery assessments, periodic LiDAR calibration. Between scheduled visits, every robot in the fleet is degrading at a rate determined by actual operational load, floor conditions, ambient temperature, and pick density — none of which a calendar-based programme can account for. The comparison below illustrates what warehouse operators leave undetected under conventional fleet management versus what continuous AI telemetry analytics delivers across the same robot population.
| Fleet Management Parameter |
Scheduled PM + Manual Fleet Review |
iFactory AI Telemetry Analytics |
| Battery Capacity Monitoring |
Battery capacity assessed at scheduled service visits. Capacity degradation below 80% not detected between visits — affected robots return to charge more frequently, silently reducing active fleet size by 10–15% with no alarm generated. |
Continuous battery degradation curve monitoring per robot. AI predicts when capacity will breach 80% threshold weeks ahead. Battery replacement scheduled before throughput impact — effective fleet size protected across every peak window. |
| Wheel and Traction Detection |
Wheel tread checked at scheduled inspection. Positioning errors and traction loss on smooth floors develop undetected between visits — causing delivery window misses and pick accuracy errors that appear as operational issues, not maintenance failures. |
Wheel wear rate tracked continuously from traction motor telemetry. Tread degradation and positioning drift detected at 2–3mm — weeks before traction failure. Wheel replacement triggered during planned windows with zero operational impact. |
| LiDAR Sensor Health |
LiDAR calibration checked at scheduled intervals. Dust and contamination accumulation reducing detection range goes undetected between visits — causing navigation hesitation, speed reductions, and emergency stops during peak pick periods. |
LiDAR detection range verified continuously against baseline. Contamination detected before navigation confidence drops below threshold. Cleaning or recalibration scheduled before any throughput impact — zero unplanned navigation failures. |
| Route Efficiency Visibility |
Route performance visible in WMS reports with 15–60 minute lag. A 15% efficiency loss across the fleet develops over days or weeks with no flag — only identified when throughput KPIs decline or carrier cut-offs are missed. |
Real-time route efficiency dashboard by robot, zone, and shift. Efficiency degradation flagged within hours of onset with root cause identified — robot, aisle, or traffic pattern — before delivery performance is impacted. |
| Charging Dock Management |
Dock utilisation reviewed manually or not at all. Overloaded docks create charging queues that reduce available fleet size during peak shifts. Charging contact degradation discovered only at failure or scheduled maintenance. |
Dock utilisation analytics identify overloaded positions and idle capacity. Contact degradation monitored continuously. Rebalancing recommendations reduce charging queue time 25–40% — maximising robots available during carrier cut-off windows. |
| Fleet-Wide MTBF Tracking |
Mean time between failures calculated from breakdown logs after events occur. No predictive capability — fleet reliability planning based on historical averages that do not reflect actual current component condition across any individual robot. |
AI maintains live MTBF by component type across every robot. Failure probability scores updated continuously. Fleet-wide spare parts requirements forecast weeks ahead — zero emergency orders at 2–3× standard parts price. |
Every Degrading AMR in Your Fleet Is a Delivery Window at Risk — Invisible Without AI Analytics.
iFactory AI integrates with your AMR fleet telemetry to deliver 24/7 robot health monitoring, real-time degradation scoring by component, automated CMMS work orders, and charging dock optimisation — protecting 97%+ fleet uptime and every outbound carrier cut-off.
Book a Demo to see live fleet health analytics mapped against your delivery performance profile.
How iFactory AI Deploys Across AMR Fleet Analytics Programmes
iFactory follows a structured deployment process that delivers live AMR fleet health monitoring within the first two weeks and full predictive analytics integration by week six. Each phase has defined deliverables so operations and maintenance teams see measurable output — not months of configuration with no improvement to fleet uptime or delivery performance.
Weeks 1–2
AMR Fleet Baseline Audit and Telemetry Integration
Full asset register of all AMR units, battery history, wheel runtime hours, LiDAR calibration records, and charging dock configuration completed. Historical downtime and fault logs ingested. AI establishes per-robot health baselines and identifies highest-risk units for immediate attention. WMS, fleet management system, and CMMS integration initiated. AMR telemetry feeds connected via OPC-UA or robot controller API for each manufacturer platform in the fleet.
Weeks 3–4
Live Fleet Health Monitoring and First Degradation Predictions
AI models calibrated to fleet-specific operating conditions begin generating live health scores for every robot by component category. Battery degradation curves, wheel wear rates, and LiDAR performance trends updated continuously. First actionable degradation predictions generated — typically within days of telemetry activation. Maintenance teams trained on alert interpretation, work order response workflows, and charging dock rebalancing recommendations.
Weeks 5–6
Full Analytics Integration, CMMS Automation and Delivery Performance Dashboard
Fleet-wide predictive analytics live across all AMR units. Automated CMMS work order generation active with spare parts procurement triggered ahead of predicted failure timing. Route efficiency dashboard and delivery performance correlation enabled — carrier cut-off achievement rate tracked in real time against fleet health status. Peak window protection alerts configured to flag any high-risk robot ahead of critical despatch windows. Full handover to operations and maintenance leadership with monthly fleet performance reporting.
MEASURABLE OUTCOMES FROM WEEK 3: FIRST DEGRADATION PREDICTIONS GENERATED WITHIN DAYS OF TELEMETRY ACTIVATION
Warehouse operators completing iFactory's 6-week AMR analytics deployment report first actionable battery and wheel degradation predictions within days of telemetry activation — achieving 97%+ fleet uptime vs 80–85% without AI monitoring, eliminating $90,000+ in annual throughput losses from route efficiency degradation, and recovering 25–40% of charging queue time through dock rebalancing.
97%+
AMR fleet uptime with AI analytics vs 80–85% without structured monitoring
25–40%
Charging queue time reduction from AI-driven dock utilisation rebalancing
68%
Improvement in battery capacity degradation with AI maintenance-aware charge scheduling
AMR Fleet Analytics: Use Cases from Live Warehouse Deployments
The following outcomes are drawn from iFactory deployments at operating AMR-equipped warehouse and fulfilment facilities across e-commerce, 3PL, grocery, and FMCG distribution networks. Each use case reflects 9 to 14 month post-deployment performance data.
A 480,000 sq ft e-commerce fulfilment centre operating a fleet of 64 goods-to-person AMRs had been experiencing a gradual decline in peak-window pick rates over a 4-month period without a clear root cause. WMS throughput reports showed an 11% reduction in picks per hour during the 14:00 to 18:00 carrier preparation window — the facility's most critical four-hour despatch period. iFactory integrated with the fleet management system telemetry and identified that 14 robots had battery packs operating below 80% capacity, returning to charge 35 to 50% more frequently than fleet baseline. This had effectively reduced the active fleet to approximately 52 robots during peak windows without a single maintenance alert having fired. Replacement batteries installed on all 14 units within 3 weeks. Peak-window pick rate recovered from 89% to 103% of target. Fleet uptime stabilised at 97.4% across the 11 months following deployment.
Book a Demo to see how this applies to your AMR fleet.
103%
Peak-window pick rate vs target post-deployment — recovered from 89% baseline
97.4%
AMR fleet uptime stabilised over 11 months post-deployment
14 units
Sub-80% capacity batteries identified without a single maintenance alarm having fired
A national 3PL operating 38 AMRs across a multi-client ambient distribution centre had seen mission completion time per delivery point increase by an average of 18% over a 6-month period. No individual robot had faulted or triggered an alarm. iFactory integrated with fleet telemetry and identified systematic wheel tread degradation across 21 robots — traction loss on the facility's polished epoxy floor causing lateral position drift of 4 to 8mm per navigation cycle, forcing frequent recalculation loops that extended travel time per mission. Nine of the 21 robots were approaching traction failure threshold within an estimated 18 to 28 days based on degradation trend modelling. All 21 wheels replaced over a planned two-weekend maintenance period. Mission completion time returned to baseline within 72 hours of wheel replacement. Annual throughput loss from the 18% efficiency degradation — estimated at £112,000 across the affected fleet period — was not repeated in the 12 months following deployment.
£112K
Annual throughput loss eliminated by catching 18% route efficiency degradation before failure
21 robots
AMRs with wheel tread degradation identified — none had triggered a fault alarm
72 hrs
Time for mission completion rate to return to baseline after planned wheel replacement
A regional FMCG grocery distribution centre operating 28 AMRs across ambient and chilled zones was experiencing 12 to 18 unplanned emergency stops per week — robots halting due to navigation confidence failures in high-traffic aisle intersections, particularly during inbound receiving windows when forklift activity generated dust and debris. iFactory analytics identified LiDAR contamination as the primary root cause on 9 robots with detection range readings 18 to 32% below nominal across multiple shift periods. Additionally, dock utilisation analysis revealed that 4 of the facility's 8 charging docks were handling 76% of all charge events, creating queue delays that were reducing peak-window robot availability by an estimated 14%. Targeted LiDAR cleaning schedule implemented for the 9 affected robots. Three underutilised docks repositioned to high-demand zones. Emergency stop frequency reduced from 15 per week to 2. Charging queue delays eliminated across all peak windows. On-time outbound delivery rate improved from 91% to 98.6%.
87%
Reduction in emergency stops from 15 per week to 2 following LiDAR and dock remediation
98.6%
On-time outbound delivery rate post-deployment vs 91% baseline
14%
Peak-window robot availability recovered through charging dock rebalancing
Expert Perspective: What the Industry Gets Wrong About AMR Fleet Reliability
Industry Review — Warehouse Automation and Fleet Engineering Perspective
"The assumption most AMR fleet operators make is that because no robot has triggered a fault alarm, the fleet is performing at specification. That assumption is wrong — and it costs throughput every single day. Battery capacity below 80%, LiDAR contamination at 25% reduced range, wheel tread at 60% specification — none of these states triggers an alarm in any standard fleet management system. But collectively, they are silently reducing your effective fleet size, degrading your route efficiency, and accumulating toward the point where multiple robots fail in the same peak window. The operations that protect 97%+ uptime are the ones treating their AMR fleet as a continuous analytics problem, not a quarterly maintenance calendar."
Head of Warehouse Automation Engineering — Major UK 3PL and E-Commerce Fulfilment Operator (provided via iFactory deployment reference)
This assessment is consistent with what AMR fleet data consistently shows: without structured AI analytics, fleet uptime degrades to 80 to 85% within six months as wear accumulates across wheels, sensors, and batteries simultaneously. The global AMR warehouse market reached $5.3 billion in 2025 and is growing at 20.4% CAGR — the operations that extract the full ROI from that investment are those monitoring fleet health continuously, not those discovering degradation at the point of breakdown. Book a Demo to speak with iFactory's AMR fleet analytics specialists about your current fleet health profile.
Conclusion: AI Telemetry Analytics Is Now the Standard for AMR Fleet Performance, Not an Optional Enhancement
The business case for AI-driven AMR fleet analytics has moved beyond theoretical ROI models. With 97%+ uptime achievable through structured AI monitoring versus 80 to 85% without it, $90,000 or more in annual throughput losses documentable from a 15% route efficiency drop across just 20 robots, and the relentless throughput demands of same-day and next-day fulfilment making any silent fleet degradation a direct delivery performance risk, warehouse operators who continue managing AMR fleets through scheduled PM intervals and reactive fault response are leaving throughput, uptime, and delivery SLA performance on the floor.
iFactory's AMR analytics platform delivers the specific capabilities fleet operators require: continuous battery degradation tracking per robot, real-time wheel wear and traction motor health monitoring, LiDAR sensor performance surveillance, route efficiency analytics correlated to delivery performance, charging dock optimisation, and automated CMMS work order generation with spare parts forecasting — all integrated with your WMS, fleet management system, and CMMS within 6 weeks. Book a Demo to receive an AMR fleet health assessment specific to your robot population and delivery operations profile.
Frequently Asked Questions About AI AMR Fleet Analytics for Warehouse Delivery Operations
Which AMR manufacturers and fleet management systems does iFactory integrate with?
iFactory integrates with AMR platforms from MiR, Geek+, Locus Robotics, OTTO Motors (Rockwell), Hai Robotics, Seegrid, and other major manufacturers via OPC-UA, REST API, and robot controller telemetry feeds. Fleet management system integration covers OMRON FLOW, Locus Fleet Manager, and standard FMS platforms. WMS integration covers Manhattan Associates, Blue Yonder, SAP EWM, and Infor. Integration is confirmed during the baseline audit in weeks 1 to 2.
How does iFactory detect battery degradation before it impacts throughput?
iFactory monitors battery capacity, charge cycle count, discharge rate per mission, thermal history during charging, and charge-to-deployment time per robot. Machine learning models establish individual battery degradation curves and project when capacity will drop below 80% — the threshold at which a robot begins returning to charge significantly more frequently. This prediction is typically generated 3 to 6 weeks ahead of the threshold being crossed, providing sufficient time to schedule replacement during a planned maintenance window without any operational disruption.
Can iFactory track route efficiency and throughput per individual robot in real time?
Yes. iFactory generates real-time mission completion time, route deviation frequency, pick-per-hour rate, and task queue performance per individual robot — correlated with zone-level traffic data from the fleet management system. Efficiency degradation is flagged within hours of onset with root cause classification: battery, wheel, LiDAR, dock queue, or zone congestion. This gives operations teams the specific information needed to intervene before carrier cut-offs are affected.
Does iFactory automatically generate CMMS work orders when degradation is detected?
Yes. iFactory integrates with IBM Maximo, SAP PM, ServiceMax, and Infor EAM CMMS platforms. When degradation crosses a configurable threshold, a structured work order is auto-generated with robot ID, component classification, severity score, recommended action, part list, and estimated failure timeline — prioritised by fleet impact and proximity to peak window periods. Spare parts procurement is triggered in advance of the predicted failure date to eliminate emergency orders at premium cost.
How does iFactory help optimise charging dock utilisation?
iFactory analyses charging dock utilisation rates, queue wait times per dock, charge event distribution across the fleet, and individual dock contact degradation. When the analysis identifies dock imbalance — where a subset of docks is handling a disproportionate share of charge events — rebalancing recommendations are generated with specific dock repositioning or reallocation proposals. Dock contact wear is tracked continuously, with replacement scheduled before contact failure causes charge interruptions during live operations.
Real-Time AMR Fleet Health Intelligence. 97%+ Uptime. Delivery Performance Protected.
iFactory gives warehouse operators continuous AMR fleet health monitoring, battery degradation predictions, route efficiency analytics, charging dock optimisation, and automated CMMS work orders — integrated with your WMS, FMS, and CMMS in 6 weeks. First degradation predictions generated within days of telemetry activation.
Stop Discovering AMR Degradation After It Hits Your Delivery Performance. Deploy AI Fleet Analytics in 6 Weeks.
iFactory gives warehouse operators real-time AMR fleet health intelligence, battery and wheel degradation predictions, route efficiency analytics, dock optimisation, and automated work orders — integrated with your WMS, fleet management system, and CMMS in 6 weeks.
97%+ fleet uptime vs 80–85% without AI monitoring
68% improvement in battery capacity degradation rate
25–40% charging queue time reduction from dock rebalancing
6 week deployment with live fleet analytics from week 2