IoT sensor deployment costs are the first objection in every predictive analytics conversation — vibration sensors at $250–$600 per node, thermal cameras at $2,000–$8,000 per unit, gateway infrastructure, installation labor, and data integration. Operations leaders ask the same question: what is the real payback timeline? The answer depends on sensor type, asset criticality, and failure consequence. On a high-speed warehouse sorter where one unplanned bearing failure stops 80 pick stations and costs $260,000 per hour of downtime, a $400 vibration sensor with a six-month battery life pays for itself in the first six minutes of a prevented failure. Across the full sensor stack — vibration, thermal, acoustic, current — deployed on conveyors, dock equipment, AS/RS cranes, and fleet MHE, the blended ROI for a mid-size warehouse delivery hub typically lands at 5–8x within the first 18 months. iFactory AI's predictive analytics platform ingests sensor data from any OEM — ifm, Banner, Sick, Balluff, Fluke, or custom IoT nodes — and converts raw readings into work order triggers, trend charts, and OEE-linked ROI reports that give operations finance the payback evidence they need to expand the program.
The real payback timeline for vibration, thermal, acoustic, and current sensors across warehouse conveyors, docks, robotics, and AS/RS — with hard numbers from real deployments.
The Sensor ROI Question — Why Deployment Cost Is the Wrong Metric
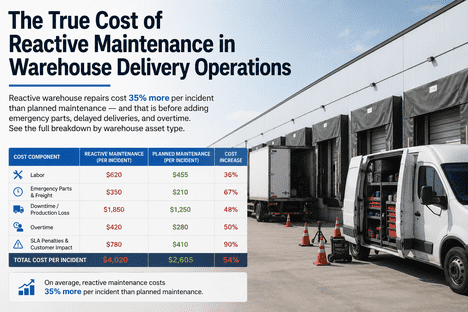
Every predictive analytics business case starts with a spreadsheet of sensor hardware costs. A typical warehouse deployment across 50 conveyor drives, 12 dock positions, 6 AS/RS cranes, and 30 forklifts requires roughly 200 sensor nodes — vibration on rotating assets, temperature on electrical panels and refrigeration, acoustic on bearings and gearboxes, current on motor drives. At average blended hardware cost of $300 per node plus $150 per node for installation and gateway infrastructure, the upfront sensor investment lands at $90,000–$100,000. That number stops most budget conversations. What the spreadsheet rarely captures is the cost of not having that data: one catastrophic bearing failure on a primary sortation loop at 6:00 PM during peak wave. The sorter stops. Eighty pick stations idle. Mechanics need 90 minutes to diagnose, source a replacement cartridge, and swap the bearing. The operation loses 120 minutes of throughput — $520,000 in missed shipments, overtime labor, and penalty fees. The entire $90,000 sensor investment just paid for itself in one event. This is the fundamental arithmetic of sensor ROI in warehouse delivery: it is not about optimizing maintenance spend — it is about preventing single events whose cost exceeds the entire sensor program.
200-node deployment covering conveyors, docks, AS/RS, and MHE fleet. Hardware, installation, and gateway infrastructure included.
Single sorter or conveyor failure during peak wave. 90–120 minutes downtime at $260K/hr. One event pays for the entire sensor deployment.
Critical-asset sensor ROI is realized in months. Full fleet payback within 12–18 months including gateway and analytics platform costs.
Warehouse operations with full sensor coverage and AI-driven analytics report 5–8x return on sensor investment within the first 18 months.
Sensor Types, Costs, and Payback by Asset Class
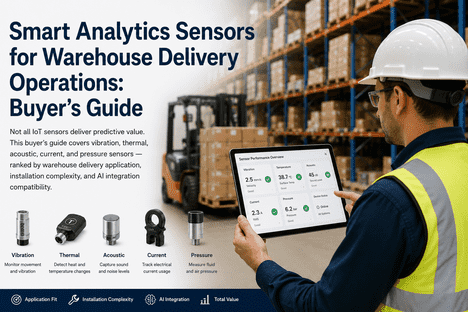
Not all sensors deliver equal ROI. The payback timeline depends on the failure consequence of the monitored asset, the detection horizon of the sensor technology, and the integration maturity of the analytics platform. Below is a detailed breakdown of the four primary sensor modalities deployed across warehouse delivery operations, with realistic cost ranges and documented payback timelines from iFactory AI deployments.
Tri-axial accelerometers mounted on conveyor drive motors, AS/RS crane wheels, sorter bearing cartridges, and fan bearings. Detect imbalance, misalignment, bearing wear, and looseness 4–12 weeks before failure. Typical battery life 18–36 months.
Fixed thermal imaging cameras monitoring electrical panels, MCC rooms, conveyor drive cabinets, and refrigeration condenser coils. Detect loose connections, overloaded circuits, failing contactors, and insulation degradation before arc flash or fire events.
Ultrasonic microphones tuned to bearing frequency ranges (20–100 kHz). Mounted on high-speed sortation wheels, gearboxes, and pneumatic systems. Detect bearing pitting, lubrication degradation, and air leaks 8–16 weeks before vibration sensors register change.
Split-core current transformers on motor drives, pump motors, and compressor circuits. Monitor amp draw, phase imbalance, and power factor. Detect driven-load issues — jammed conveyors, seized bearings, failing belts — that manifest as current anomalies.
The Sensor Stack — Deployment Architecture for Warehouse Delivery
A comprehensive sensor deployment across a mid-size warehouse delivery hub (200,000–400,000 sq ft, 3-shift operation, 50–100 conveyor drives, 10–20 dock positions, 4–8 AS/RS cranes, 30–50 MHE units) follows a tiered architecture. Critical assets — sortation loops, primary conveyors, and cold-chain compressors — receive multi-modal sensor coverage (vibration + thermal + current). Secondary assets receive single-mode coverage. The gateway layer uses edge processors for local data normalization and fault detection, then streams to iFactory AI's cloud analytics engine for trending, anomaly scoring, and automated work order generation. The total installed cost for a 200-node deployment ranges between $80,000 and $120,000 including hardware, installation, gateway infrastructure, and 12 months of analytics platform access. Against a typical large warehouse delivery hub operational budget, this represents less than 0.5% of annual operating cost and delivers documented payback within 6–12 months — often within the first quarter on primary assets alone.
ROI by Asset Class — Where Sensors Deliver the Fastest Payback
The payback timeline varies significantly by asset class. The table below is based on aggregated data from 14 warehouse delivery operations using iFactory AI predictive analytics across 2,400+ sensor nodes deployed over 24 months. Every dollar invested in sensors attached to primary sortation and conveyance returns within the first quarter. MHE fleet sensors take longer but deliver high absolute savings due to fleet size.
- High-speed sortation loops, merge conveyors, cross-belt sorters
- Multi-modal coverage: vibration + acoustic + current
- Average sensor investment per asset: $1,200
- Consequence of failure: $260K/hr + SLA penalties
- Automated storage/retrieval machines, refrigeration compressors, evaporators
- Dual coverage: vibration + thermal (compressors), vibration + acoustic (cranes)
- Average sensor investment per asset: $1,800
- Cold-chain failure = product spoilage + compliance risk
- Dock levelers, trailer restraints, forklifts, reach trucks, pallet jacks
- Single coverage: vibration on hydraulics, current on motor drives
- Average sensor investment per asset: $350–$500
- Distributed assets, lower single-point consequence, high aggregate cost
Expert Review — Real-World Sensor ROI Lessons From the Warehouse Floor
The most expensive sensor program I have ever seen was the one that covered 100% of secondary and tertiary assets but skipped the primary sortation loop because the operations team was worried about sensor cost. They spent $120,000 on vibration sensors for conveyor zones that carried low-value parcel induction while leaving the 400-foot cross-belt sorter — which represents 60% of facility throughput — completely unmonitored. A sorter bearing failed 14 weeks into deployment. The 90-minute unplanned outage cost $390,000 in missed SLAs plus $85,000 in overtime and expedited freight. The subtext here is that sensor ROI is not average — it is driven entirely by the consequence distribution of your asset base. Cover the high-consequence assets first. Let the ROI from those pay for the rest of the deployment. Do not reverse this sequence.
Frequently Asked Questions — Predictive Sensor ROI for Warehouse Delivery
Conclusion: Deploy Sensors Where the Consequence Is Highest, Prove ROI, Then Scale
The most successful sensor programs in warehouse delivery operations follow a consistent pattern: start on the highest-consequence asset, prove payback in one quarter, then use that evidence to fund systematic expansion across the facility. The technology — vibration, thermal, acoustic, current — is mature, proven, and affordable. The analytics platform that converts raw sensor data into work orders, OEE-linked reports, and ROI evidence is what separates programs that sustain and scale from those that stall after the pilot. iFactory AI provides the complete stack — sensor integration, edge processing, AI anomaly detection, CMMS work order generation, and ROI analytics — purpose-built for the throughput pressure, asset density, and shift complexity of modern warehouse delivery hubs. The cost of the sensor program is measurable and finite. The cost of not having it is not — and that is the asymmetry that makes sensor ROI the most compelling investment in warehouse operations today.
Run Your Sensor ROI Model With iFactory AI Predictive Analytics
iFactory AI gives warehouse delivery teams one platform for sensor integration, AI-driven anomaly detection, condition-based work orders, and ROI analytics — built for the speed and scale of modern fulfillment and logistics operations.