Reactive analytics in warehouse and delivery operations costs 3–5× more per incident than planned maintenance and that figure appears before you count emergency parts premiums, delayed delivery penalties, overtime labour, and accelerated asset degradation. Most warehouse managers see only the repair invoice. iFactory AI shows you the full cost picture and eliminates it. To see how planned analytics transforms your warehouse cost structure, book a demo with our team
WAREHOUSE · DELIVERY OPERATIONS · REACTIVE ANALYTICS COST BREAKDOWN
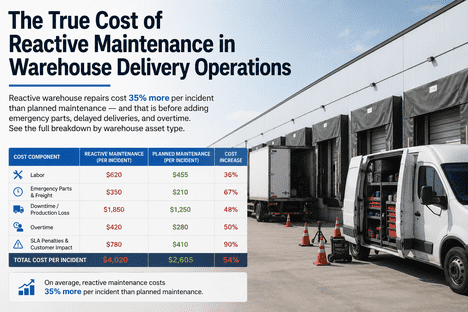
The True Cost of Reactive Analytics in Warehouse Delivery Operations
Reactive warehouse repairs cost 3–5× more per incident than planned analytics — before emergency parts, delivery delays, and overtime. iFactory AI replaces reactive fire-fighting with AI-driven planned maintenance across every warehouse asset.
3–5×Higher Cost Per Reactive Repair
$260KAvg. Unplanned Downtime Per Hour
326 hrsLost Annually to Unplanned Downtime
35%More Spend on Reactive vs Planned
93%of Warehouses Call Reactive Analytics Costly
Why Reactive Analytics Feels Cheaper — Until It Isn't
The case for reactive analytics seems straightforward on paper: don't spend money on maintenance until something actually breaks. No scheduled downtime, no labour hours on assets that appear fine, no parts inventory sitting unused. On a month-to-month budget, reactive looks efficient. The problem is that this logic ignores what happens the moment an asset fails and in warehouse and delivery operations, failures never happen at convenient times or on single assets.
When a forklift goes down at 3 AM during a peak dispatch window, you're not paying a scheduled repair rate. You're paying emergency callout rates, expedited freight on the part, overtime for three workers held back from dispatch, and absorbing the delivery penalties on the orders that missed cut-off. That single event costs 3–5× what a planned intervention would have cost and the repair invoice is the smallest line item.
The Full Cost Breakdown: What Reactive Analytics Actually Costs You
Most warehouse managers measure reactive maintenance cost as the repair invoice. The true cost has six distinct components — and only one of them shows up on a maintenance work order.
01
Emergency Labour Premium
Unplanned failures require immediate response — which means after-hours callouts, weekend rates, and technicians pulled from planned work. Emergency labour rates run 50–150% above standard scheduled rates. A repair that costs $800 in planned labour costs $1,600–$2,000 when it's reactive and unscheduled.
Visible on invoice
02
Expedited Parts Procurement
Planned maintenance uses standard-lead-time parts at normal pricing. Emergency repairs require whatever is available, wherever it can be sourced, shipped as fast as possible. Expedited freight on a critical part costs 5–10× standard ground shipping. Secondary-market sourcing adds another 20–40% premium on top.
Partially visible on invoice
03
Production & Throughput Loss
This is the largest single cost and the one least likely to appear on a maintenance budget. Aberdeen Group estimates unplanned downtime costs an average of $260,000 per hour across industrial sectors. A warehouse processing $50,000/hour in goods value that loses 4 hours to a conveyor failure absorbs $200,000 in throughput loss — before a single repair invoice arrives.
Almost never on maintenance report
04
Delayed Delivery Penalties
In delivery operations, equipment failures cascade into missed SLAs. Customer chargebacks, carrier penalties, and retailer compliance fees for late or incomplete shipments add direct financial cost on top of throughput loss. These costs are absorbed by commercial teams — they never appear in maintenance budgets — making the true reactive cost systematically invisible.
Never on maintenance report
05
Overtime & Workforce Disruption
When an asset fails mid-shift, workers are held back, redeployed, or sit idle while repairs proceed. Overtime is authorised to recover throughput after the asset comes back online. A single 4-hour failure event can generate 8–12 hours of overtime across the affected team. These costs hit the labour budget, not the maintenance budget — another category of invisible reactive cost.
Hidden in labour budget
06
Accelerated Asset Degradation
Assets run to failure consistently reach end-of-life faster than assets on planned maintenance schedules. Lubrication breakdown, contamination, misalignment, and thermal stress accumulate when inspection cycles are removed. Each reactive failure shortens remaining asset life — compressing capital replacement timelines and increasing lifetime total cost of ownership by 20–35%.
Invisible until capital budget
The repair invoice is the smallest part of reactive analytics cost. The largest costs — throughput loss, delivery penalties, overtime, accelerated depreciation — never appear on the maintenance budget. That's why reactive analytics always feels cheaper than it actually is.
Cost by Warehouse Asset Type: Where Reactive Analytics Hurts Most
Not all assets carry equal reactive risk. These are the highest-cost failure points in warehouse and delivery operations — and what reactive analytics actually costs per incident on each one.
Forklift Fleet
Planned service intervalEvery 500 operating hours
Planned service cost$400–$800 per service
Reactive failure cost (full)$8,000–$25,000 per incident
Cost multiplier10–30× planned cost
Primary reactive riskHydraulic failure, mast damage, transmission failure during peak dispatch
Conveyor Systems
Planned inspection intervalWeekly + monthly deep inspection
Planned maintenance cost$2,000–$5,000 per quarter
Reactive failure cost (full)$30,000–$150,000 per incident
Cost multiplier15–75× planned cost
Primary reactive riskBelt failure, motor burnout, sensor fault causing full line stoppage at peak volume
Loading Dock Doors & Equipment
Planned service intervalQuarterly inspection + annual overhaul
Planned maintenance cost$500–$1,500 per door annually
Reactive failure cost (full)$5,000–$40,000 per incident
Cost multiplier8–40× planned cost
Primary reactive riskDoor seal failure in cold chain, leveller failure blocking dock during peak dispatch
Refrigeration & Cold Chain Units
Planned service intervalMonthly compressor checks + quarterly full service
Planned maintenance cost$3,000–$8,000 per unit annually
Reactive failure cost (full)$40,000–$180,000 per incident
Cost multiplier20–60× planned cost
Primary reactive riskCompressor failure causing product loss, regulatory non-compliance, customer chargebacks
Delivery Vehicles
Planned service intervalEvery 5,000–10,000 km or 3 months
Planned maintenance cost$800–$2,000 per service
Reactive failure cost (full)$10,000–$60,000 per incident
Cost multiplier12–30× planned cost
Primary reactive riskRoadside breakdown, missed delivery window SLAs, recovery towing, rental vehicle cost
Reactive vs. Planned Analytics: The Annual Cost Comparison
Reactive Analytics — Typical Mid-Size Warehouse (Annual)
Emergency labour premium (est. 12 unplanned events)+$18,000–$36,000
Expedited parts procurement premium+$15,000–$30,000
Throughput loss (est. 80 unplanned downtime hours)+$200,000–$800,000
Delivery penalty & SLA chargeback costs+$25,000–$90,000
Overtime to recover lost throughput+$20,000–$50,000
Accelerated asset replacement (compressed lifecycle)+$30,000–$80,000
Total Reactive Analytics Cost$308,000–$1,086,000/year
Planned Analytics with iFactory AI — Same Warehouse (Annual)
Scheduled maintenance labour (planned rates, normal hours)$40,000–$70,000
Parts at standard pricing, planned procurement$20,000–$40,000
Throughput loss (est. 8–12 hours planned downtime)$20,000–$60,000
Delivery penalties: near-zero (planned maintenance windows)$0–$5,000
Overtime: eliminated (planned windows, no recovery mode)$0–$5,000
Asset replacement on full planned lifecycle$15,000–$25,000
Total Planned Analytics Cost$95,000–$205,000/year
Switching from reactive to planned analytics with iFactory AI delivers documented maintenance cost reductions of 18–35% within the first 18 months — with the largest savings appearing in throughput, delivery, and overtime: the costs that never show up on the maintenance budget.
How iFactory AI Eliminates Reactive Analytics Costs
iFactory AI replaces reactive fire-fighting with an AI-driven planned maintenance system that monitors every warehouse asset continuously, detects failure signatures weeks before breakdown, and schedules interventions at planned cost — not emergency cost.
1
Predictive Failure Detection
AI monitors sensor data from every asset — vibration, temperature, current draw, cycle counts — and detects failure signatures 3–8 weeks before breakdown. You fix the bearing at a planned cost of $400, not at an emergency cost of $12,000 after it fails during peak dispatch.
2
Planned Work Order Generation
When AI detects a developing fault, it auto-generates a work order with priority level, recommended intervention, parts needed, and suggested maintenance window. Technicians arrive with the right parts at the right time — no emergency procurement, no expedited freight.
3
Maintenance Window Optimisation
iFactory AI schedules planned maintenance during low-throughput windows — overnight, between dispatch cycles, during shift changes. Assets go offline when it costs the least, not when they choose to fail. Throughput loss drops from 80+ unplanned hours to 8–12 planned hours per year.
4
Asset Health Dashboard
Every warehouse asset — forklift, conveyor, dock door, refrigeration unit, delivery vehicle — has a live health score visible on a single dashboard. Managers see which assets are at risk before operators report problems. Reactive surprises become planned interventions.
5
Parts Inventory Intelligence
iFactory AI tracks parts consumption patterns and failure frequencies across your asset fleet. It flags when critical parts should be stocked before they're needed — eliminating emergency procurement premiums and the expedited freight costs that inflate every reactive repair invoice.
6
Full Cost Visibility Reporting
iFactory AI reports the full cost of every maintenance event — labour, parts, downtime, throughput impact — not just the repair invoice. For the first time, managers see the actual cost of every reactive event, the actual saving from every planned intervention, and the total ROI of shifting their analytics posture.
PLANNED ANALYTICS · COST REDUCTION · iFactory AI
Stop Paying 3–5× More for Every Reactive Repair.
iFactory AI detects failure signatures weeks before breakdown, schedules planned interventions at normal cost, and eliminates the emergency premiums, delivery penalties, and overtime that make reactive analytics the most expensive strategy in your operation.
The Hidden Cost Multiplier: What Reactive Analytics Does to Your Assets Over Time
Every reactive failure shortens the remaining useful life of the affected asset. This is the slowest-moving and most expensive cost of reactive analytics — and the one that almost never appears on any budget until it's too late.
Year 1
ReactiveForklift runs with undetected bearing wear. 3 unplanned failures. Emergency repairs: $36,000. Each failure creates micro-damage in hydraulics and transmission. Asset health quietly declining.
Planned (iFactory AI)AI detects bearing wear in Month 3. Planned replacement: $1,200. Asset restored to full health. Hydraulics and transmission protected. No cascading damage.
Year 3
ReactiveAccumulated micro-damage results in hydraulic system failure. Emergency replacement: $22,000. Asset now at 60% of planned useful life remaining. Capital replacement timeline compressed by 2–3 years.
Planned (iFactory AI)3 years of planned maintenance at $4,800 total. Asset at 100% planned useful life. No compressed replacement timeline. No capital budget surprise.
Year 5
ReactiveAsset reaches end-of-life 2–3 years early. Capital replacement: $40,000. 5-year total reactive cost including replacement: $140,000+. Equivalent asset on planned maintenance has 3 years of useful life remaining.
Planned (iFactory AI)Asset operating at designed lifecycle. 5-year total planned maintenance cost: $8,000. Asset has 3 years of remaining useful life. No capital replacement until Year 7–8.
Over a 5-year window, a single forklift on reactive analytics costs $140,000+. The same asset on planned analytics with iFactory AI costs $8,000 in maintenance — and is still running when the reactive asset needs replacement. To see how iFactory AI calculates this across your full asset fleet,
book a demo with our team.
Frequently Asked Questions
How does iFactory AI detect failure before it happens on warehouse assets?
iFactory AI connects to sensors on your equipment — vibration sensors, temperature probes, current monitors, cycle counters — and continuously analyses the data against known failure patterns. When readings trend toward a failure signature, iFactory AI raises an alert and generates a planned work order, typically 3–8 weeks before breakdown would have occurred.
Our maintenance team is already stretched. Won't planned analytics add more work?
Planned analytics reduces total maintenance work, not increases it. Instead of emergency callouts, reactive repairs, and post-failure reconstruction, your technicians work on scheduled interventions during low-throughput windows. The same team handles more assets more efficiently — because they're doing the right work at the right time, not scrambling to respond to failures.
How quickly does the cost saving show up after implementing iFactory AI?
The first emergency repair you avoid pays for months of iFactory AI. Most operations see measurable cost reduction within 60–90 days as the first predicted failures are caught and resolved at planned cost. Full programme ROI — including throughput recovery, delivery penalty elimination, and overtime reduction — typically documents within 6–12 months. To see the ROI calculation for your specific operation,
book a demo with our team.
Does iFactory AI integrate with our existing WMS and ERP systems?
Yes. iFactory AI integrates with existing warehouse management systems, ERP platforms, and equipment control systems. It acts as an intelligence and analytics layer on top of your current infrastructure — no rip-and-replace required. Integration typically completes in 2–4 weeks depending on the number of systems involved.
Can iFactory AI handle a multi-site warehouse and delivery hub operation?
Yes. iFactory AI provides centralised asset health visibility across multiple warehouses, distribution centres, and delivery hubs from a single dashboard. Asset health trends, maintenance costs, and reactive vs. planned analytics ratios are all comparable across sites — giving operations directors the full cost picture across their entire network.
What's the first step to shifting from reactive to planned analytics with iFactory AI?
The first step is a walkthrough of your current asset fleet and failure history. iFactory AI's team maps your highest-risk assets, calculates your current reactive analytics cost (full cost, not just repair invoices), and shows you exactly where planned analytics will deliver the fastest and largest cost reduction.
Book a demo with our team to start that conversation.