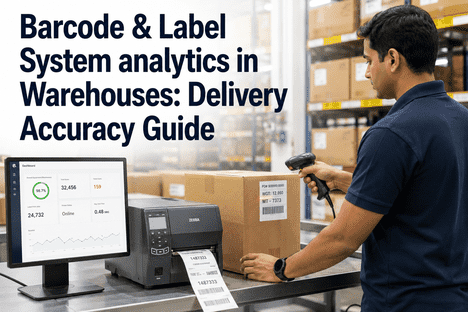
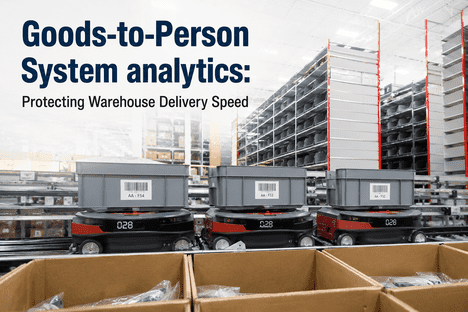
Every outbound carton, every put-away pallet, every cross-dock parcel, every returns receipt every single inventory movement inside a modern warehouse is gated by a barcode scan and a printed label. A typical mid-size delivery hub runs 200+ barcode scanners and 50+ thermal label printers across multiple shifts, with each printer producing 5,000 to 15,000 labels per day under dusty conditions, mechanical cycling, and temperature swings. Thermal print heads have a rated life of 1 to 3 million inches of label stock and degrade predictably but catastrophically once they cross threshold. A handheld scanner that has drifted from its baseline read rate. A print head producing labels that grade C or D on the ANSI/ISO scale instead the B-grade (3.0+) minimum carriers require. A label printer running with worn ribbons that pass internal QA but fail at the carrier sortation hub. Each one of these silently broken devices generates misroutes, carrier chargebacks, returns, manual reprints, and customer complaints at an industry cost of $15 to $40 per incident before factoring carrier chargebacks and downstream customer-service spend. AI-scheduled analytics on the scanner and label-printer fleet keeps that entire chain inside the precision band that 99.7%+ delivery accuracy actually requires. Book a Demo to see how iFactory AI deploys barcode and label system analytics within 6 weeks.
99.7%+
Delivery accuracy sustainable only with continuous scanner and label-printer analytics
$15–40
Industry cost per scan or label failure incident before carrier chargebacks
B / 3.0+
ANSI/ISO barcode grade minimum required by carrier sortation networks
4–6 wks
Deployment timeline from device audit to live AI scanning and label analytics
What Barcode and Label System Analytics Actually Monitors
The barcode and label system in a modern warehouse is not one asset it is distributed fleet. Handheld RF scanners and ring scanners at the pick face. In-line scan tunnels at induction, sortation, and pack-out. Vision-guided cameras at receiving and putaway. Thermal direct and thermal-transfer label printers at every pack station, every dock door, and every returns station. The wireless network that ties them all together. The WMS that consumes the scan events and triggers the next labels. Any single device in this fleet drifting outside its operating tolerance breaks the integrity of every downstream delivery that depends on it — and most of these devices are degrading silently while still passing internal visual checks.
iFactory AI's barcode and label analytics layer monitors every scanner and every printer in the fleet independently, against per-device healthy baselines. Read-rate trends, no-read percentage, multiple-read incidence, scanner battery and trigger-cycle health, print-head temperature, ribbon condition, ANSI/ISO label grade scores, and check-digit decode failures are tracked continuously per device, per shift, and per SKU class. The maintenance team works against actual degradation signatures — not a calendar PM that has no relationship to which specific print head is about to fall below the B-grade threshold or which specific scanner is producing the no-reads that the WMS is silently absorbing as "try again" events. Book a Demo to see live barcode and label analytics mapped against your scanning and printing estate.
Scanner Read-Rate and Decode Analytics
Per-scanner read rate, no-read percentage, multiple-read incidence, decode time, and check-digit failure patterns tracked continuously across RF handheld, ring, and in-line scanner fleets. Drift detected at sub-SLA threshold per device so cleaning and recalibration are condition-triggered, never reactive.
ANSI/ISO Label Grade Monitoring
Continuous ANSI/ISO grading on contrast, edge determination, modulation, and decodability tracked per printer. Labels falling below the B-grade (3.0+) carrier-required threshold flagged automatically — preventing sub-grade labels from reaching the carrier sortation network where they generate chargebacks.
Thermal Print Head Life Analytics
Print-head linear-inch count, temperature, ribbon condition, label-stock consumption, and per-print quality scores tracked per printer. Print-head replacement scheduled before the 1–3 million inch life window expires — replacing 99.7%+ accuracy interruption with planned PM at the end of validated head life.
Multi-Carrier Label Compliance Validation
Per-carrier label requirements monitored automatically — size, format, barcode placement, address formatting, and routing-data integrity validated against FedEx, UPS, USPS, DHL, and regional carrier specifications before the label is applied. Carrier rejection and chargeback exposure addressed at the source.
AI-Scheduled CMMS Work Orders
Device-level degradation signatures above threshold push structured work orders into IBM Maximo, SAP PM, ServiceMax, Infor EAM, or eMaint — with device ID, location, severity score, recommended part (print head, ribbon, scanner module), and ANSI grade trend. Replaces calendar PM on 200+ scanners and 50+ printers with condition-triggered intervention.
WMS, TMS and Shift Logbook Integration
iFactory connects to Manhattan Associates, Blue Yonder, SAP EWM, Infor WMS, Oracle TMS, BluJay, and Descartes — plus IBM Maximo, SAP PM, ServiceMax, Infor EAM, and eMaint CMMS via OPC-UA, MQTT, and REST. The Shift Logbook captures every scanner alert, label-grade exception, print-head replacement, and intervention across operations, maintenance, and despatch handovers.
Why Visual Checks and Calendar PM Miss What Barcode-Label Analytics Catches
The conventional model — visual operator inspection on every shift, scheduled OEM scanner calibration, ribbon and print-head replacement on fixed-hour intervals — was built for a different generation of warehouse volume. At 5,000 to 15,000 labels per printer per day across 50+ printers and 200+ scanners running 24/7, the math does not survive. The table maps where the inherited model breaks.
| Device Parameter |
Visual Inspection + Calendar PM |
iFactory AI Barcode-Label Analytics |
| Label Print Quality Verification |
Operators visually check labels at the print station. Labels that look acceptable but grade C or D on the ANSI/ISO scale ship anyway — passing internal checks but failing at carrier sortation. Discovered only as carrier chargebacks weeks later. |
Continuous ANSI/ISO grading on contrast, edge determination, modulation, and decodability per label. Sub-B-grade prints flagged before application; print head flagged for service before grade falls further. |
| Scanner Read-Rate Performance |
Scanner calibration during scheduled OEM service. Between visits, drift accumulates silently — re-scans absorbed by operators as "try again" without surfacing the underlying device degradation. |
Per-device read rate, no-read percentage, multiple-read incidence, and decode time tracked continuously. Drift detected at sub-SLA threshold per scanner so cleaning or recalibration happens before mis-routes appear. |
| Thermal Print Head Life Tracking |
Print heads replaced on fixed-hour or fixed-cycle schedule that ignores actual label-stock consumption. Heavy-traffic printers under-serviced; light-traffic printers over-serviced. Heads fail mid-shift just as a peak wave commits. |
Linear-inch consumption tracked per print head against the 1–3 million inch validated life window. Replacement scheduled during planned overnight windows — never during peak despatch. |
| Multi-Carrier Compliance |
Carrier-specific label requirements managed manually in the WMS or shipping software. Non-compliant labels (wrong size, format, placement) discovered when the carrier rejects the package or assesses a chargeback. |
Per-carrier requirements (FedEx, UPS, USPS, DHL, regional) validated automatically before the label is applied. Address formatting, barcode placement, and check-digit math verified at print time. |
| Failure-Rate Root Cause Visibility |
Mis-routes and chargebacks reported monthly. Root cause attribution to the specific scanner, printer, station, or shift driving them requires manual reconciliation weeks after the impact has already landed. |
Mis-routes and chargebacks tied automatically to the specific device, station, shift, and SKU class driving them. Device-driven errors separated from process-driven errors so the right intervention happens in the right place. |
| Reprint and Manual Handling Cost |
$15 to $40 per incident in labor, materials, customer service, and carrier-handling overhead absorbed silently across thousands of incidents per year. Carrier chargebacks layered on top. |
Device-driven incident reduction translates directly into reprint, manual-handling, and chargeback cost recovery with attribution to the specific intervention that addressed it. |
Every Sub-Grade Label Is a Carrier Chargeback Already in Motion.
iFactory AI delivers warehouse delivery operations device-level analytics across handheld scanners, ring scanners, in-line scan tunnels, thermal label printers, and multi-carrier compliance — with AI-scheduled CMMS work orders, ANSI/ISO grading, and Shift Logbook continuity. Integrated with your WMS, TMS, and CMMS in 4 to 6 weeks.
Book a Demo to see live scanning and label analytics against your current device fleet.
How iFactory AI Deploys Barcode and Label System Analytics
iFactory follows a structured deployment process that delivers live per-device telemetry within the first two weeks and full AI-scheduled analytics with carrier-compliance validation by week six. Each phase produces a measurable deliverable to operations, maintenance, and despatch leadership.
Weeks 1–2
Device Audit and System Integration
Scanner and label-printer fleet inventoried by manufacturer, model, location, shift assignment, and SKU-class exposure. Existing telemetry capability scoped across RF handheld scanners, ring scanners, in-line scan tunnels, and thermal direct/thermal transfer printers. Integration initiated with the operator's WMS (Manhattan, Blue Yonder, SAP EWM, Infor), TMS (Oracle, BluJay, Descartes), and CMMS (Maximo, SAP PM, ServiceMax, Infor EAM, eMaint). Tier 1 devices supporting peak outbound waves prioritised.
Weeks 2–4
Baseline Calibration and ANSI/ISO Grading Activation
Machine-learning models calibrated to per-device healthy baseline under representative load. Continuous read-rate, no-read, and multiple-read telemetry brought online across the scanner fleet. ANSI/ISO grading on contrast, edge determination, modulation, and decodability activated across the printer fleet. First sub-grade label and drifting-scanner alerts surface within the first 3 weeks — typically including latent devices that calendar PM had passed.
Weeks 4–6
Carrier Compliance, AI Scheduling and Shift Logbook
Multi-carrier label compliance validation activated for FedEx, UPS, USPS, DHL, and operator-specific regional carriers. AI-scheduled CMMS work orders with device ID, severity score, recommended part, and predicted failure window pushed into the CMMS. Mis-route and chargeback attribution to device-level root cause live. Shift Logbook integrated so every scanner alert, label-grade exception, print-head replacement, and intervention is captured across operations, maintenance, and despatch handovers.
DEPLOYMENT OUTCOME: SUB-GRADE PRINTERS AND DRIFTING SCANNERS SURFACE WITHIN 3 WEEKS
Warehouses completing iFactory's 4–6 week barcode and label analytics deployment consistently surface device-level accuracy root causes within the first 3 weeks of telemetry flow — print heads with rising ANSI-grade exception rates, scanners with read-rate drift, ribbons running past their condition window, multi-carrier compliance gaps producing chargebacks. Programmes typically deliver sustained 99.7%+ delivery accuracy, recover $15 to $40 per avoided incident, and convert lumped calendar PM into device-level condition-triggered intervention across the 200+ scanner and 50+ printer fleet.
99.7%+
Sustained delivery accuracy from device-level scanning and label analytics
$15–40
Per-incident cost recovered in reprints, manual handling, and customer-service overhead
B / 3.0+
ANSI/ISO label grade sustained across carrier sortation networks
Barcode and Label Analytics: Use Cases from Live Deployments
The following outcomes are drawn from iFactory barcode and label analytics deployments at operating warehouse delivery hubs across e-commerce fulfilment, 3PL, retail distribution, and parcel sortation networks. Each use case reflects 9–14 month post-deployment performance against the specific scanning or labelling problem the analytics layer was deployed to solve.
An e-commerce fulfilment operator running 42 thermal label printers across 14 pack-out stations had been absorbing approximately 8,400 carrier-chargeback events per year tied to sub-grade labels — primarily on the FedEx and UPS networks where automated sortation rejected labels grading C or below. Quarterly OEM ribbon and print-head service had been treating all printers identically regardless of label-stock consumption. iFactory deployed continuous ANSI/ISO grading and linear-inch tracking across all 42 printers. Within 5 weeks the model had identified 11 print heads past the 1-million-inch threshold producing degrading grade scores, 6 ribbons with consumption above baseline, and 3 printers with chronically sub-B-grade output. Condition-triggered intervention replaced quarterly PM. Carrier chargeback events dropped 78% across the following quarter, eliminating approximately $186,000 in annual chargeback exposure.
Book a Demo to see how this applies to your printer fleet.
78%
Reduction in carrier chargeback events post-deployment
$186K
Annual carrier chargeback exposure eliminated
11 heads
Print heads past life threshold identified in first 5 weeks
A 3PL operating 240 RF handheld scanners and 38 ring scanners across 3 shifts had been running an accepted "background" mis-route rate of 0.94% that the operations team attributed to picker variability. Quarterly OEM scanner cleaning and calibration had not moved the trend. iFactory deployed continuous read-rate, no-read percentage, multiple-read incidence, and decode-time telemetry across the full scanner fleet. Within 6 weeks the model had identified 31 scanners running below the operator's read-rate threshold and 4 ring-scanner battery packs producing erratic decode times — concentrated on second-shift devices that had been silently absorbing the highest re-scan workload. Condition-triggered intervention replaced calendar cleaning. Mis-route rate dropped from 0.94% to 0.22% across the following quarter, recovering approximately $310,000 in annual mis-route remediation cost.
77%
Reduction in mis-route rate, from 0.94% to 0.22%
$310K
Annual mis-route remediation cost recovered
35 devices
Scanners and battery packs identified with drift that calendar PM had missed
A retail distribution operator shipping across FedEx, UPS, USPS, DHL, and four regional carrier networks had been absorbing inconsistent carrier-specific label compliance — barcode placement issues, address formatting variation, and check-digit failures generating roughly 14,200 manifest-mismatch and reprint events per year across the operator's network. iFactory deployed continuous per-carrier label compliance validation at print time across all 28 label-printer stations. Carrier requirement libraries for FedEx, UPS, USPS, DHL, and the regional carriers were maintained automatically. Within 4 weeks, sub-compliant labels were intercepted at the print station rather than at the carrier hub. Manifest-mismatch and reprint events dropped 82% across the following quarter; carrier chargebacks tied to label-format issues effectively went to zero.
82%
Reduction in manifest-mismatch and reprint events post-deployment
8 carriers
Carrier-specific label compliance libraries maintained automatically
≈0
Carrier chargebacks tied to label format and compliance issues
Expert Perspective: What the Industry Gets Wrong About Scanner and Label Maintenance
Industry Review — Warehouse Operations and Identification Systems Engineering Perspective
"The barcode and the printed label are the only two things in the entire delivery chain that the carrier actually trusts. The carton, the manifest, the customer expectation — all of it routes off a millimetre-scale printed pattern that has to grade B or better, and a scanner that has to decode it the first time. When a print head crosses 1.5 million inches and the grade quietly drops from B to C, the operator does not see it. The carrier sees it, charges the operator back for manual handling, and routes the package late. When a handheld scanner drifts and starts producing re-scans, the picker absorbs the extra second as 'a bad scan' rather than reporting a failing device. The operations leadership that has reached 99.7% sustained accuracy has stopped treating 200 scanners and 50 printers as consumables and started running them as a precision-instrument fleet — with continuous ANSI grading, per-device read-rate telemetry, and AI-scheduled intervention before the next chargeback arrives."
Head of Warehouse Identification Systems Engineering — Major International Logistics Operator (provided via iFactory deployment reference)
The supporting data confirms it. Thermal print heads degrade predictably across the 1 to 3 million inch life window, with grade collapse typically occurring in the final 10 to 15% of head life — invisible to visual inspection, catastrophic to carrier acceptance. Scanner read-rate drift produces re-scans that pickers absorb silently before mis-routes appear at the carrier hub. Multi-carrier compliance variation between FedEx, UPS, USPS, DHL, and regional networks produces label-format chargebacks that no internal QA process catches. AI-scheduled device-level analytics is the only structural correction to a precision-instrument fleet operating at modern volume. Book a Demo to speak with iFactory's barcode and label analytics specialists about your current operation.
Device-Level Scanner and Label Intelligence. 99.7%+ Sustained Accuracy. Live in 4–6 Weeks.
iFactory gives warehouse operations continuous scanner read-rate analytics, ANSI/ISO label grading, thermal print-head life tracking, multi-carrier compliance validation, AI-scheduled CMMS work orders, and Shift Logbook continuity. Results measurable within 30 days of telemetry activation.
Conclusion: Device-Level Analytics Is the Standard for Delivery Accuracy
The case for AI-scheduled barcode and label system analytics has moved well past pilot deployments. The brutal cost of $15 to $40 per scan or label failure incident, the ANSI/ISO B-grade (3.0+) minimum that carrier sortation networks structurally require, the 1 to 3 million inch validated life window on thermal print heads, the 99.7%+ delivery accuracy floor that modern e-commerce and 3PL operations are measured against, and the structural impossibility of visual inspection keeping pace with 5,000 to 15,000 labels per printer per day across 50+ printers and 200+ scanners running 24/7 have made calendar PM and visual QA on a precision-instrument fleet operationally and financially indefensible.
iFactory's platform delivers the specific capabilities warehouse delivery operations require: scanner read-rate and decode analytics, ANSI/ISO label grade monitoring, thermal print-head life analytics, multi-carrier label compliance validation, AI-scheduled CMMS work orders, mis-route and chargeback root cause attribution, and a digital Shift Logbook carrying every device alert and intervention across handovers — integrated with Manhattan, Blue Yonder, SAP EWM, Infor WMS, Oracle TMS, BluJay, Descartes, IBM Maximo, SAP PM, ServiceMax, Infor EAM, and eMaint via OPC-UA, MQTT, and REST. The 4–6 week deployment timeline means measurable delivery-accuracy intelligence begins within weeks. Book a Demo to receive a barcode and label analytics assessment specific to your device fleet and carrier mix.
Frequently Asked Questions About AI Barcode and Label System Analytics
Which scanner and label-printer classes does iFactory's analytics cover?
iFactory covers RF handheld scanners, ring scanners, in-line scan tunnels, vision-guided cameras at receiving and putaway, direct-thermal label printers, and thermal-transfer label printers — across all major OEM platforms. Coverage scope is finalised during the week 1–2 audit. Modern delivery hubs typically run 200+ scanners and 50+ printers, and iFactory tracks each device independently against its specific healthy baseline.
How does ANSI/ISO label grading work in the platform?
Every printed label is graded continuously against the ANSI/ISO scale (A=4.0 through F=0.0) on four dimensions — contrast, edge determination, modulation, and decodability. Carrier sortation networks structurally require a B-grade (3.0+) minimum for reliable automated handling. iFactory flags sub-grade prints before application and pushes a CMMS work order against the affected print head before grade falls further. This prevents the silent grade-drift in the final 10 to 15% of print-head life that produces carrier chargebacks.
How does the platform handle multi-carrier label compliance?
iFactory maintains per-carrier label requirement libraries for FedEx, UPS, USPS, DHL, and operator-specific regional carriers. Size, format, barcode placement, address formatting, and check-digit integrity are validated automatically at print time before the label is applied. Sub-compliant labels are intercepted at the print station rather than at the carrier hub — eliminating the chargebacks and manual-handling fees that label-format issues generate.
How does the platform connect device health to mis-route and chargeback rates?
iFactory ingests mis-route and chargeback data from the WMS and TMS and ties each event back to the specific scanner, printer, station, shift, and SKU class that handled it. Statistical models then identify which devices are structurally driving the error rate against baseline. The output gives operations leadership device-driven errors separated from process-driven errors, so the right intervention happens in the right place — print-head replacement, scanner recalibration, or carrier-library update.
How is AI scheduling different from calendar PM on scanners and printers?
Calendar PM treats 200+ scanners and 50+ printers as a uniform population — same cleaning cycle, same ribbon replacement schedule, same print-head replacement interval. AI scheduling treats every device independently against actual usage signatures: linear-inch consumption per print head, decode-time trend per scanner, read-rate per shift, ANSI-grade trend per printer. Heavy-utilisation devices get serviced at the right interval; light-utilisation devices are safely stretched. Emergency intervention during peak waves is structurally eliminated.
How does the Shift Logbook fit into the barcode and label analytics workflow?
Every scanner alert, label-grade exception, print-head replacement, ribbon change, multi-carrier compliance event, technician response, and post-intervention recheck is captured in iFactory's digital Shift Logbook against the affected device and station. Incoming operations, maintenance, and despatch shifts inherit a complete view of which devices are healthy, which are flagged, and which interventions are pending. Floor observations from pickers and packers — intermittent scanner reads, faint print quality, ribbon noise — are correlated with device telemetry so qualitative observation enriches the device-level analytics record.
Stop Running Scanners and Label Printers on Calendar PM. Deploy AI Device-Level Analytics in 4–6 Weeks.
iFactory gives warehouse delivery operations continuous read-rate analytics, ANSI/ISO label grading, thermal print-head life tracking, multi-carrier compliance validation, AI-scheduled CMMS work orders, mis-route and chargeback root cause attribution, and Shift Logbook continuity across operations, maintenance, and despatch handovers.
99.7%+ sustained delivery accuracy from device-level scanner and label analytics
ANSI/ISO B-grade (3.0+) label compliance sustained across carrier networks
$15 to $40 per avoided incident in reprints and carrier chargebacks
4–6 week deployment with first device-level root causes in week 3