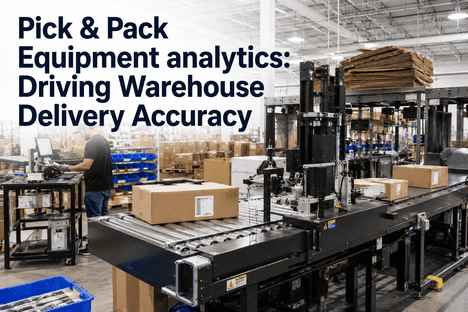
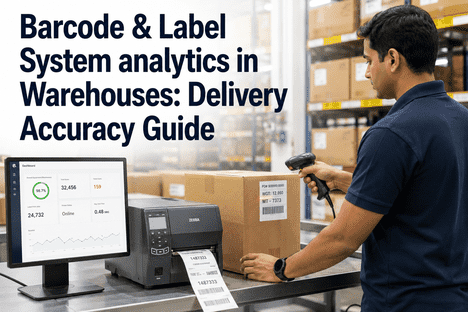
The pick-and-pack zone is where every warehouse delivery promise is either kept or broken. Pick-to-light controllers, voice-picking terminals, scanning stations, dimensioning systems, in-line scales, label printers, pack-out conveyors, and AS/RS interfaces all have to operate within tight tolerances for an order to leave the building accurate. Industry benchmark error rates sit between 1% and 3%; mature operations target 99.5% to 99.7% pick accuracy as the floor. The financial gap between those numbers is brutal — on 500,000 annual orders, a 2.5-percentage-point accuracy gap translates to 12,500 additional mispacked orders, and the average cost per pick error sits between $42 and $300 once returns, customer service, re-ships, and lifetime-value damage are counted. A driver cannot fix a wrong order at the customer's door. The error has to be eliminated before the carton leaves the warehouse. AI-driven pick-and-pack equipment analytics maintains the equipment chain in the precision state that 99.7% accuracy actually requires surfacing scanner drift, scale calibration loss, pick-to-light controller faults, and label-printer degradation before they push errors into the despatch stream. Book a Demo to see how iFactory AI deploys pick-and-pack equipment analytics within 6 weeks.
99.7%
Order accuracy sustainable only with AI-maintained pick-and-pack equipment
$42–300
Industry cost per pick-pack error once returns and customer service are counted
12,500
Additional mispacks per year from a 97% vs 99.5% accuracy gap on 500K orders
4–6 wks
Deployment timeline from equipment audit to live AI pick-and-pack analytics
What Pick-and-Pack Equipment Analytics Actually Monitors
Pick-and-pack accuracy is not delivered by a single device. It is the output of a coordinated equipment chain pick-to-light controllers and modules, voice-picking infrastructure, RF and barcode scanners at every confirmation point, in-line scales for weight verification, dimensioning and cubing systems, label printers, pack-out conveyors, and the WMS-WCS integration layer that ties them all together. Every device in that chain has its own drift, its own degradation curve, and its own contribution to mis-pick and mispack error. When a scanner read rate quietly degrades from 99.8% to 97.4%, the resulting pick errors do not appear with a label saying "scanner fault" — they appear as customer complaints two weeks later.
iFactory AI's pick-and-pack analytics layer monitors every device in the equipment chain independently, generates per-device condition scores, and projects time-to-failure against each device's healthy baseline. The maintenance team works against actual degradation signatures scanner read-rate trends, pick-to-light response timing and confirmation rate, scale calibration drift, label-print quality, and dimensioner accuracy — rather than against a calendar PM that has no relationship where the next mispack is actually about to come from. Book a Demo to see live pick-and-pack equipment analytics mapped against your operation.
Pick-to-Light and Put-to-Light Health
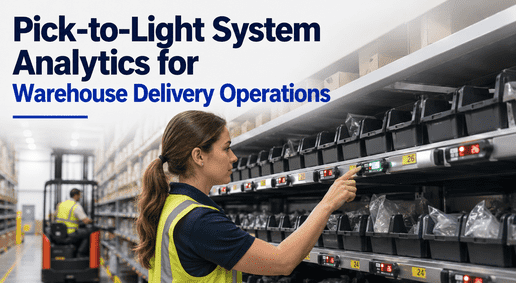
Per-module response timing, confirmation rate, button-press reliability, LED brightness, and controller-bus integrity tracked across the pick face. Failing modules and degrading controllers flagged before pickers start working around them — eliminating the silent error accumulation that lumped-system PM cannot catch.
Voice-Picking System Performance
Voice-terminal recognition accuracy, headset response, command-confirmation latency, and per-picker session-level error rates tracked continuously. Headset and terminal degradation flagged per device; SKU-classes driving recognition errors surfaced for vocabulary tuning before pick error rates rise.
Scanner and Barcode Read-Rate Analytics
RF handheld scanners, ring scanners, in-line scan tunnels, and label-quality scores monitored per device and per SKU. Read-rate decline, no-read percentage, and multiple-read incidence flagged at sub-SLA threshold — protecting the multiple barcode confirmation checkpoints that drive 99.99% inventory and process accuracy.
Weight Check Scales and Dimensioner Calibration
In-line scale calibration drift, dimensioner accuracy, and weight-vs-expected exception patterns tracked per station. The weight-check station that drifts off baseline becomes the device that lets a missing-item mispack slip through to despatch — catching that drift early is the entire purpose of the analytics layer.
Label Printer and Pack-Out Conveyor Analytics
Print-head temperature, ribbon and label-stock condition, print-quality scores, and pack-out conveyor motor and belt health tracked per station. Print-quality degradation surfaced before unreadable labels begin generating despatch exceptions, returns, and carrier rejection events.
WMS, WCS and Shift Logbook Integration
iFactory connects to Manhattan Associates, Blue Yonder, SAP EWM, Infor WMS, and the WCS platforms running pick-to-light and voice infrastructure — plus IBM Maximo, SAP PM, ServiceMax, Infor EAM, and eMaint CMMS. The Shift Logbook carries every equipment alert, calibration event, and intervention across operations, maintenance, and despatch handovers.
Why Calendar PM Misses What Pick-and-Pack Analytics Catches
Calendar PM on pick-and-pack equipment was built for an era where 1% to 2% error rates were acceptable as "industry average." Modern e-commerce and 3PL operations are measured against 99.5% to 99.7% accuracy floors — and the operational math of that floor has nothing to do with quarterly walkthroughs of the pick face. The table maps where the inherited model breaks against what AI analytics delivers on the same equipment.
| Equipment Parameter |
Calendar PM + Reactive Repair |
iFactory AI Pick-and-Pack Analytics |
| Pick-to-Light and Voice Health |
Modules and terminals tested during quarterly walkthrough. Between visits, failing modules drive pickers to work around them, accumulating silent pick errors visible only in monthly accuracy reporting. |
Per-module response timing, confirmation rate, and per-terminal recognition accuracy tracked continuously. Failing devices flagged before pickers adapt around them and before error rate spikes appear in despatch data. |
| Scanner Read-Rate Performance |
Scanner calibration completed during scheduled OEM service. Read-rate decline only investigated when downstream error reporting surfaces a pattern. |
Read rate, no-read, and multiple-read incidence tracked per scanner and per SKU. Drift detected at sub-SLA threshold so cleaning or recalibration is scheduled during planned downtime, never during peak pick hours. |
| Weight-Check and Dimensioner Calibration |
Scales calibrated on a fixed cycle. Calibration drift between events lets weight-vs-expected exceptions silently degrade — the missing-item mispack rate creeps up before it triggers an investigation. |
Live calibration-drift and weight-exception pattern analytics. Drift flagged at sub-tolerance level before missing-item mispacks slip through to despatch, with the specific station and station-load profile surfaced. |
| Label Print Quality |
Print heads and ribbons replaced on a fixed-cycle schedule. Print-quality degradation discovered when carrier label-rejection rates spike or returns arrive with unreadable labels. |
Print-head temperature, ribbon condition, and per-label print-quality scores tracked continuously. Degradation flagged before label readability crosses the carrier's acceptance threshold. |
| Error-Rate Root Cause Visibility |
Pick-and-pack error rates reported monthly. Root cause attribution to specific equipment, station, or shift requires manual reconciliation across systems weeks after the impact has landed. |
Pick and pack errors tied automatically to the device, station, shift, and SKU class driving them. Equipment-driven errors separated from process-driven errors so the right intervention happens in the right place. |
| Returns and Re-Delivery Cost |
Cost per pick error sits at $42 to $300 once returns, customer service, re-ships, and LTV damage are counted. The cost lives outside the warehouse P&L and is rarely attributed back to equipment health. |
Equipment-driven error reduction translates directly into returns and re-delivery cost reduction with attribution to the specific intervention that addressed it. The warehouse operations P&L finally sees the equipment health-to-customer-cost connection. |
Every Unmonitored Pick-and-Pack Device Is a Return Already Accumulating.
iFactory AI delivers warehouse operations device-level analytics across pick-to-light, voice picking, scanners, scales, dimensioners, label printers, and pack-out conveyors — with automated CMMS work orders, error-rate root cause attribution, and Shift Logbook continuity. Integrated with your WMS and WCS in 4 to 6 weeks.
Book a Demo to see live equipment analytics against your current pick-and-pack operation.
How iFactory AI Deploys Across a Pick-and-Pack Operation
iFactory follows a structured deployment process that delivers live device-level telemetry within the first two weeks and full pick-and-pack analytics by week six. Each phase produces a measurable deliverable to operations, maintenance, and quality leadership — with first predictive alerts and error-rate root cause attribution typically surfacing inside the first 3 weeks.
Weeks 1–2
Equipment Audit and System Integration
Pick-and-pack equipment inventoried across pick-to-light controllers and modules, voice-picking infrastructure, scanners, scales, dimensioners, label printers, and pack-out conveyors. Existing telemetry capability scoped. Integration initiated with the operator's WMS (Manhattan, Blue Yonder, SAP EWM, Infor), WCS platforms, and CMMS (Maximo, SAP PM, ServiceMax, Infor EAM, eMaint). Tier 1 stations running peak pick waves prioritised.
Weeks 2–4
Baseline Calibration and Device-Level Anomaly Detection
Machine-learning models calibrated to per-device healthy baseline under representative load. Anomaly detection activated across pick-to-light response, voice recognition accuracy, scanner read rates, scale calibration, and print quality. First device-level alerts and error-rate root cause attribution surface within the first 3 weeks — typically including latent issues that lumped equipment PM had missed for months.
Weeks 4–6
CMMS Automation, Error Attribution and Shift Logbook
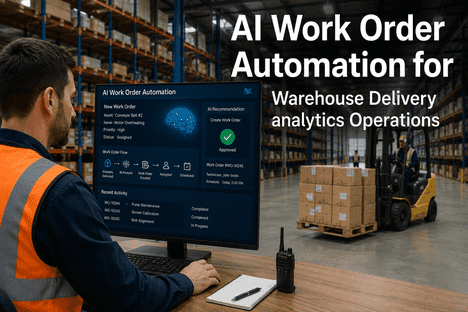
Automated CMMS work order generation activated with device ID, station, failure class, severity score, and predicted failure window. Pick-and-pack error rate attribution to specific equipment, station, shift, and SKU class live. Shift Logbook integrated so every equipment alert, calibration event, intervention, and accuracy exception is captured across operations, maintenance, and quality handovers. Full handover with monthly accuracy and equipment-health reporting in place.
DEPLOYMENT OUTCOME: ACCURACY ROOT CAUSES SURFACE WITHIN THE FIRST 3 WEEKS
Warehouses completing iFactory's 4–6 week pick-and-pack analytics deployment consistently surface device-level accuracy root causes within the first 3 weeks of telemetry flow — scanners with read-rate drift, pick-to-light modules with degraded confirmation rates, scales drifting off calibration, label printers with rising print-quality exception rates. Programmes typically deliver 99.5% to 99.7% sustained pick-and-pack accuracy, recover $42 to $300 per avoided error in returns and customer-service cost, and convert lumped PM into device-level condition-triggered intervention.
99.5–99.7%
Sustained pick-and-pack accuracy from device-level analytics
$42–300
Cost per avoided pick-pack error in returns, re-ships, and customer-service spend
12,500
Annual mispacks eliminated per 500K orders from a 2.5-point accuracy lift
Pick-and-Pack Analytics: Use Cases from Live Deployments
The following outcomes are drawn from iFactory pick-and-pack analytics deployments at operating warehouse delivery hubs across e-commerce fulfilment, 3PL, retail distribution, and health-and-beauty operations. Each use case reflects 9–14 month post-deployment performance against the specific accuracy and equipment problem the analytics layer was deployed to solve.
An e-commerce fulfilment operator processing roughly 520,000 orders per year was running at 96.8% pick-and-pack accuracy — well below the 99.5% modern target and translating to approximately 16,640 mispacked orders annually at an average $90 cost per error. Quarterly OEM scanner calibration had not moved the trend. iFactory deployed continuous read-rate, no-read percentage, and multiple-read telemetry across 78 handheld and in-line scanners at the pick and pack stations. Within 5 weeks the model had flagged 14 scanners with read-rate trending downward, concentrated at 4 specific pack-out stations. Condition-triggered cleaning and recalibration replaced the fixed-frequency programme. Accuracy lifted from 96.8% to 99.4% across the following quarter, eliminating approximately 13,500 mispacks per year worth $1.2M in returns and customer-service spend.
Book a Demo to see how this applies to your scanning infrastructure.
96.8% → 99.4%
Pick-and-pack accuracy improvement post-deployment
$1.2M
Annual returns and customer-service cost eliminated
14 scanners
Drifting scanners identified that quarterly OEM calibration had missed
A health-and-beauty fulfilment operator running 2,400 pick-to-light modules across 14 pick zones had been absorbing intermittent pick-error patterns concentrated on specific aisles that the operations team attributed to "training variability." iFactory deployed per-module response-timing, confirmation-rate, and controller-bus integrity analytics across the full pick face. Within 4 weeks the model had identified 187 modules with degraded confirmation rates and 6 controllers with bus-integrity issues — all concentrated on the aisles where pickers had been silently working around the failing devices. Module-level intervention replaced the lumped quarterly PM. Aisle-level pick-error rate dropped 71% across the following quarter, returning to the operation's 99.6% accuracy target.
71%
Reduction in aisle-level pick-error rate post-deployment
187 modules
Degraded pick-to-light modules identified in first 4 weeks
99.6%
Pick accuracy target re-established after lumped PM had let it drift
A 3PL operator running 18 weight-check stations on the pack-out lines had been experiencing a chronic missing-item mispack rate of 0.42% — items missing from outbound cartons that the weight-check stations should have flagged at pack-out. Calibration on a fixed monthly cycle had passed every scale within tolerance at the prior service event. iFactory deployed continuous calibration-drift and weight-vs-expected exception analytics across all 18 stations. Within 6 weeks the model had identified 5 scales operating off-baseline despite passing fixed-cycle calibration, with 3 stations producing consistently high weight-tolerance windows that effectively rendered them inactive checkpoints. Targeted re-calibration and tolerance retuning dropped missing-item mispack rate from 0.42% to 0.09% across the following quarter, eliminating approximately 7,500 missing-item incidents per year on the operator's order volume.
79%
Reduction in missing-item mispack rate, from 0.42% to 0.09%
5 scales
Drifting weight-check stations identified despite passing fixed-cycle calibration
7,500
Missing-item incidents per year eliminated through scale-drift detection
Expert Perspective: What the Industry Gets Wrong About Pick-and-Pack Accuracy
Industry Review — Warehouse Operations and Quality Engineering Perspective
"Most operations leadership treats pick-and-pack accuracy as a training and process problem. The data tells a different story. When you look at where the error rate is actually leaking into the despatch stream, an enormous share traces back to specific pieces of equipment — the scanner with the falling read rate, the pick-to-light module with the slow confirmation, the scale that drifted off calibration two weeks ago. These devices are not failing visibly. They are degrading silently inside the tolerance band that quarterly PM passes, and the pickers and packers are absorbing the cost in customer complaints and returns weeks later. The operators sustaining 99.5% to 99.7% accuracy are not the ones with the best-trained labour. They are the ones running device-level analytics on every piece of pick-and-pack equipment in the chain."
Head of Warehouse Operations and Quality — Major International Fulfilment Operator (provided via iFactory deployment reference)
The supporting market data confirms it. Industry pick-and-pack error rates of 1% to 3% are not driven primarily by labour variability — they are driven by equipment chains operating outside the precision band that 99.5% accuracy requires. The cost asymmetry is brutal: $42 to $300 per error once returns, customer service, re-ships, and lifetime-value damage are counted, against pennies per intervention to keep the scanner, the pick-to-light module, or the scale inside its accuracy tolerance. Modern fulfilment operations have moved past the assumption that accuracy is a training problem. Book a Demo to speak with iFactory's pick-and-pack analytics specialists about your current operation.
Device-Level Pick-and-Pack Intelligence. 99.7% Sustained Accuracy. Live in 4–6 Weeks.
iFactory gives warehouse operations continuous pick-to-light, voice, scanner, scale, dimensioner, label printer, and pack-out conveyor analytics — with automated CMMS work orders, error-rate root cause attribution, and Shift Logbook continuity across handovers. Results measurable within 30 days of telemetry activation.
Conclusion: Device-Level Equipment Analytics Is the Standard for Pick-and-Pack Accuracy
The case for AI device-level analytics across the pick-and-pack equipment chain has moved past pilot deployments. The structural fact that a driver cannot fix a wrong order at the customer's door, the brutal cost asymmetry of $42 to $300 per pick error against pennies per device-level intervention, and the documented gap between 97% industry-average accuracy and 99.5% to 99.7% modern-target accuracy on the same equipment chain have made lumped calendar PM operationally and financially indefensible at any meaningful order volume.
iFactory's platform delivers the specific capabilities pick-and-pack operations require: pick-to-light and put-to-light health analytics, voice-picking system performance monitoring, scanner and barcode read-rate analytics, weight-check scale and dimensioner calibration tracking, label printer and pack-out conveyor analytics, automated CMMS work order generation with error-rate root cause attribution, and a digital Shift Logbook carrying every device alert and intervention across handovers — integrated with Manhattan, Blue Yonder, SAP EWM, Infor WMS, the WCS platforms running pick infrastructure, and IBM Maximo, SAP PM, ServiceMax, Infor EAM, and eMaint CMMS. The 4–6 week deployment timeline means measurable accuracy intelligence begins within weeks. Book a Demo to receive a pick-and-pack analytics assessment specific to your equipment chain and order volume.
Frequently Asked Questions About AI Pick-and-Pack Equipment Analytics
Which pick-and-pack equipment classes does iFactory cover?
iFactory covers pick-to-light and put-to-light modules and controllers, voice-picking terminals and headsets, RF handheld and ring scanners, in-line scan tunnels, weight-check scales, dimensioning and cubing systems, thermal and direct-thermal label printers, pack-out conveyors, and the WMS-WCS integration layer tying them together. Coverage scope is finalised during the week 1–2 equipment audit based on the operator's specific equipment estate.
How does AI analytics differ from the diagnostics our WCS already provides?
WCS provides real-time device-state information. AI analytics applies machine-learning models to that data plus historical operating context to project time-to-failure, identify degradation signatures, and attribute downstream pick-pack errors to the specific device, station, shift, and SKU class driving them. The output is not "device X is running" — it is "device X is degrading and will start producing pick errors at the following rate within the following window."
How does the platform connect equipment health to pick-and-pack error rates?
iFactory ingests pick-and-pack error data from the WMS and ties each error back to the equipment chain that handled the order — the specific scanner, scale, pick module, and label printer in that order's pack-out sequence. Statistical models then identify which equipment is structurally driving error rate against baseline. The output gives operations leadership equipment-driven errors separated from process-driven errors, so the right intervention happens in the right place.
Does the platform support both voice-picking and pick-to-light operations?
Yes. iFactory provides parallel analytics for both. Voice-picking analytics covers terminal recognition accuracy, headset response, command-confirmation latency, and per-picker session-level error rates. Pick-to-light analytics covers per-module response timing, confirmation rate, LED brightness, and controller-bus integrity. Operators running hybrid pick environments receive unified analytics across both technologies.
How does AI analytics reduce returns and re-delivery cost specifically?
Pick-and-pack errors translate directly into returns, re-ships, customer service tickets, and lifetime-value damage at an industry cost of $42 to $300 per error. iFactory reduces error rate by keeping the equipment chain inside the precision band that 99.5% to 99.7% accuracy requires — scanner read rates, pick-to-light confirmation rates, scale calibration, and label print quality maintained continuously rather than degrading silently between PMs. Each percentage point of accuracy improvement on a 500,000-order operation translates to approximately 5,000 avoided errors per year.
How does the Shift Logbook fit into the pick-and-pack analytics workflow?
Every equipment alert, calibration event, technician response, accuracy exception, and post-intervention recheck is captured in iFactory's digital Shift Logbook against the affected device and station. Incoming operations, maintenance, and quality shifts inherit a complete view of which devices are healthy, which are flagged, and which interventions are pending. Floor observations from pickers and packers — intermittent scanner reads, sluggish pick modules, unreadable labels — are correlated with device telemetry so qualitative observation enriches the device-level analytics.
Stop Running Pick-and-Pack on Lumped Calendar PM. Deploy AI Equipment Analytics in 4–6 Weeks.
iFactory gives warehouse operations device-level analytics across pick-to-light, voice picking, scanners, scales, dimensioners, label printers, and pack-out conveyors — with automated CMMS work orders, error-rate root cause attribution, and Shift Logbook continuity across operations, maintenance, and quality handovers.
99.5% to 99.7% sustained pick-and-pack accuracy from device-level analytics
$42 to $300 per avoided error in returns and customer-service cost
Equipment-driven errors separated from process-driven errors with root cause attribution
4–6 week deployment with first accuracy root causes in week 3