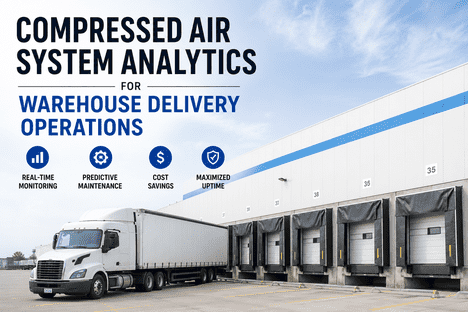
Compressed air is the invisible backbone of warehouse delivery operations pneumatic sorters divert 80+ packages per minute, conveyor actuators index pallets into accumulation lanes, dock levelers raise and lower under every trailer, and air-powered strapping heads seal thousands of outbound cartons per shift. Yet most warehouses treat compressed air as a free utility rather than a critical asset class. A single 3 mm orifice leak at 100 psi costs $1,200–$2,500 per year in wasted electricity, and the average warehouse distribution center loses 25–35% of its compressed air output through undetected leaks. Beyond energy waste, a compressor failure during a sort wave stops every pneumatic actuator on the sortation system stalling package flow across the entire facility until the backup compressor spins up or maintenance clears the fault. AI-powered compressed air system analytics fuses pressure sensor telemetry, flow meter data, compressor motor current draw, dew point readings, and acoustic leak detection with adaptive ML models that identify developing leaks, predict compressor failures, and optimize system pressure setpoints in real time reducing energy spend by 18–30%, extending compressor service life, and eliminating the unplanned production stops caused by pneumatic system failures. Book a Demo to see how iFactory connects your compressed air telemetry to predictive analytics, leak management work orders, and Shift Logbook documentation.
Stop treating compressed air as a free utility. AI analytics cuts leak waste 30% and prevents pneumatic system failures that stall your sortation lines.
iFactory ingests your compressor telemetry, flow data, and acoustic sensor feeds to detect leaks, predict failures, and optimize pressure setpoints — connected to CMMS work orders and Shift Logbook documentation. Pilot in 6–12 weeks.
The Hidden Cost of Blind Compressed Air Systems
Most warehouse facilities monitor compressed air at the compressor room level — total pressure, total flow, and maybe a high-level alarm. But a compressor room gauge tells you nothing about what is happening across 500,000 square feet of distribution space where leaks, pressure drops, and demand spikes occur. A pneumatic sorter actuator that starts sticking at 90 psi because a corroded fitting is bleeding 12 cfm upstream will show as a sortation jam — not a compressed air problem. A filter that is clogged and causing a 15 psi drop across the line will be diagnosed as "low pressure at the tool" and ignored until a production stop occurs. The real cost of blind compressed air is not just the electricity wasted on leaks — it is the downtime events that no one traces back to the pneumatic system. iFactory's compressed air analytics platform makes every cubic foot of compressed air visible, measured, and actionable across your entire distribution network.
What Blind Compressed Air Costs Your Warehouse Every Month
These costs are real and measurable. Most warehouses write them off as "utility overhead" — but every dollar of compressed air waste hits the P&L the same as any other operating expense.
Leak energy waste
A distribution center with 500,000 sq ft of pneumatically actuated sortation, conveyor diverters, and dock equipment typically has 50–80 active leaks. Average leak size: 2–4 mm. Annual energy cost per leak: $800–$2,500. Combined waste: $60,000–$150,000 per year in electricity.
Unplanned compressor failures
A main compressor failure during a 3M-package sort wave stops every pneumatic actuator on the sortation system. Packages back up into induction. Dispatch stalls. Recovery time: 45–90 minutes. Cost per event: $18,000–$36,000 in lost throughput and overtime labor.
Over-pressurization waste
Most warehouses run compressors at 110–120 psi to compensate for undetected pressure drops. Every 2 psi reduction saves 1% in energy. A 15 psi unnecessary overhead — typical for facilities without analytics — wastes 7.5% of total compressed air energy spend.
Moisture and contamination damage
Undetected dew point excursions allow water and oil aerosol into pneumatic lines, accelerating actuator seal wear, clogging solenoid valves, and contaminating air-powered strapping heads. Replacement parts and accelerated rebuild costs add $8,000–$15,000 per year across the facility.
Six compressed air analytics capabilities that protect your warehouse operations
Each module is pre-integrated and ready to connect to your existing compressor controls, flow meters, pressure sensors, and acoustic monitoring infrastructure.
AI-Powered Leak Detection & Localization
iFactory fuses acoustic sensor data, flow meter trends, and pressure decay analysis to detect and localize compressed air leaks across your facility. The platform estimates leak size, flow rate, and annual energy cost for every detected leak — prioritized by financial impact for repair scheduling.
Compressor Health & Failure Prediction
Motor current draw, discharge temperature, oil pressure, vibration, and run hours are monitored continuously. Adaptive ML models predict remaining useful life for compressor pumps, drive motors, and control systems — providing 2–4 weeks advance warning of impending failures.
System Pressure & Setpoint Optimization
iFactory analyzes demand-side pressure requirements at every pneumatic drop and recommends the minimum reliable system pressure setpoint. The platform identifies areas where pressure drops exceed acceptable limits and flags the specific pipe, fitting, or filter causing the restriction.
Dew Point & Air Quality Monitoring
Continuous dew point, particulate, and oil aerosol monitoring at critical points in the distribution network. Alerts trigger when compressed air quality parameters approach thresholds that would damage pneumatic actuators or contaminate product-contact air applications.
Auto Work Order Generation
Every detected leak, predicted failure, or quality excursion generates a structured work order in your connected CMMS with asset ID, location, estimated repair time, and recommended parts. Leak repairs are prioritized by energy cost impact — the $2,500 leak gets scheduled before the $800 leak.
Shift Logbook & Energy Reporting
Every compressed air event — leak detection, repair completion, compressor health alert, pressure setpoint change — is logged in the Shift Logbook with immutable timestamps. Energy savings reports quantify leak repair ROI and pressure optimization impact for sustainability compliance and utility rebate applications.
From compressor room to actionable analytics in four steps
iFactory is designed for facilities teams, not data scientists. The deployment is turnkey and non-disruptive to ongoing operations.
Connect compressor & distribution data
iFactory ingests data from your compressor controllers, flow meters, pressure sensors, acoustic monitors, and dew point transmitters — typically through existing BAS, SCADA, or IoT gateway infrastructure.
Establish baseline & detect leaks
The platform learns normal flow, pressure, and acoustic patterns over a 2-week baseline period. Leak detection models identify active leaks and estimate their size, flow rate, and energy cost.
Generate prioritized action plan
iFactory delivers a prioritized leak repair plan sorted by energy cost impact, a compressor health forecast with recommended maintenance windows, and pressure optimization recommendations.
Execute, track, and save
Work orders flow to your CMMS. Repairs are tracked in the Shift Logbook. Energy savings are calculated automatically and reported for sustainability compliance and utility rebate applications.
Real ROI from compressed air analytics deployment
Across warehouse and distribution operations that have deployed iFactory's compressed air analytics platform, the results are consistent and measurable within the first quarter of operation.
Your warehouse compressed air system is leaking money every shift. Book a 30-min walkthrough and we'll show you the leaks and savings opportunities hiding in your compressor data.
Common questions about compressed air analytics for warehouse operations
Stop leaking money through your compressed air system. Deploy AI-powered analytics in weeks.
Book a 30-minute demo and we'll show you how iFactory connects to your existing compressor infrastructure, identifies leaks, predicts failures, and optimizes pressure setpoints — cutting energy waste 18–30% and preventing pneumatic system failures that stall your sortation lines.