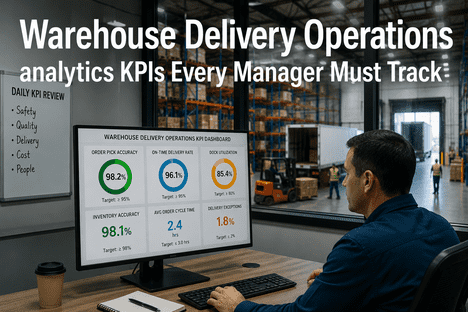
Most warehouse delivery operations track the wrong KPIs at the wrong time. On-time delivery percentage tells you what went wrong yesterday; replenishment lag rate tells you what is about to go wrong in the next four hours. The gap between those two questions is the gap between reactive warehouses and predictive ones. Operations managers running 24/7 fulfillment, distribution, and last-mile dispatch operations need a balanced KPI framework — leading indicators that surface emerging risk hours before it hits delivery performance, and lagging indicators that prove the program is working. The dominant failure mode in warehouse analytics is not missing KPIs but the latency between data and decision: when OEE is calculated weekly from spreadsheet exports, an operations manager sees yesterday's bottleneck on Monday morning, six days too late to prevent it. AI-powered analytics platforms collapse this measurement gap by streaming live equipment, labor, and order data into a single dashboard where every KPI breach triggers root-cause analysis automatically. Book a Demo to see how iFactory AI deploys warehouse delivery analytics in 4 to 6 weeks.
85%
World-class OEE benchmark for warehouse equipment and material handling
95-97%
Target on-time delivery rate for high-performing fulfillment operations
45%
OEE improvement reported by warehouses deploying AI-driven KPI dashboards
4-6 wks
Deployment timeline from baseline KPI audit to live AI analytics dashboard
The Warehouse Delivery KPI Framework Every Operations Manager Needs in 2026
Warehouse delivery KPIs fall into three operational layers — equipment health, execution performance, and delivery outcome — and a balanced program tracks all three with the right mix of leading and lagging indicators. Equipment health KPIs (OEE, MTBF, MTTR, unplanned downtime rate) surface the conditions that will determine whether tomorrow's pick waves run cleanly. Execution KPIs (pick rate per labor hour, replenishment lag, dock-to-stock cycle time, order accuracy) reveal whether labor, layout, and system logic are converting orders into shipments efficiently. Delivery outcome KPIs (on-time delivery, fill rate, perfect order rate, cost per order) measure what customers actually experience.
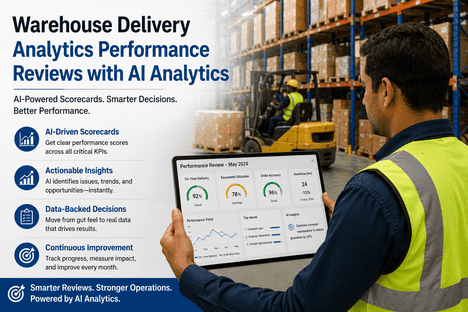
The fundamental problem with most warehouse KPI programs is not the metrics themselves — it is the time between data and action. iFactory's AI analytics platform eliminates this lag by streaming SCADA, IoT, WMS, CMMS, ERP, and MES data into a unified KPI engine that updates continuously and flags breaches in real time, with AI-generated root-cause analysis and recommended interventions delivered before the breach affects delivery performance.
Real-Time OEE and Equipment Availability Tracking
Continuous OEE calculation across conveyors, sorters, AS/RS, dock equipment, and packaging lines — broken down by availability, performance, and quality components. Operators see live shift performance vs world-class 85% targets, not weekly reports.
Leading Indicator Detection
AI surfaces replenishment lag rate, cycle count deferral, equipment health anomaly trends, and pick-face stockout risk — predicting downstream delivery delays 4 to 8 hours before they hit on-time delivery KPIs.
Role-Specific KPI Dashboards
Operators see machine-level and shift-level metrics; supervisors see zone and wave performance; managers see facility-level KPIs; executives see network and financial summaries — all driven from the same unified data model.
Automated Root-Cause Analysis
When a KPI breaches threshold, AI traces the cause across equipment, labor, and process data — surfacing "Line 4 throughput drop driven by conveyor tension loss" rather than just an alert that throughput is down.
Shift Handover Continuity Through Digital Logbook
iFactory's AI-powered Shift Logbook captures every KPI deviation, equipment issue, and pending exception with AI-generated summaries — ensuring KPI context transfers cleanly across shifts and operations managers never inherit blind spots.
Automated Shift, Daily, and Weekly Reporting
KPI reports auto-generate at shift change, end of day, and end of week — delivered to operations managers, plant leadership, and executives without manual data assembly. Compliance and performance documentation always audit-ready.
Lagging vs Leading Warehouse Delivery KPIs: What Every Operations Manager Must Track
A balanced warehouse delivery KPI program tracks both what already happened and what is about to happen. Lagging indicators measure outcomes; leading indicators predict them. Operations managers running solely on lagging metrics are always one cycle behind reality. The following comparison shows the core KPI pairs every warehouse delivery operation should track — and what continuous AI monitoring adds to each.
| KPI Domain |
Lagging Indicator (Outcome) |
Leading Indicator with AI (Prediction) |
| Equipment Performance |
Unplanned downtime hours, MTTR (mean time to repair) — measured after the breakdown has already cost shift throughput. |
Equipment health anomaly score, MTBF trend, vibration and motor current deviation — surface failures 10 to 18 days before breakdown. |
| Throughput and Productivity |
Units shipped per shift, OEE, picker productivity — calculated after the shift ends. |
Real-time pick-face replenishment lag, idle labor time per zone, current cycle time vs ideal — flag throughput risk in the current hour. |
| Inventory Accuracy |
Cycle count variance, inventory accuracy percentage — discovered after picking errors occur. |
Cycle count deferral rate, scan exception frequency, replenishment shortfall — predict inventory accuracy decay before it triggers stockouts. |
| Order Fulfillment |
Order accuracy rate, perfect order rate, fill rate — measured at the customer experience layer, after dispatch. |
Predictive delivery risk score per outbound order, real-time SLA exposure flagging — recommend intervention before the cutoff is missed. |
| On-Time Delivery (OTIF) |
OTD percentage, late shipment count, carrier hand-off compliance — measured after the dispatch window closes. |
Live dock door utilization, staging lane backlog, predicted dispatch readiness vs carrier ETA — surface OTD risk 4 to 8 hours ahead. |
| Cost and Financial |
Cost per order, labor cost per shipment, emergency procurement spend — calculated weekly or monthly. |
Live overtime trajectory, expedited shipping trigger rate, energy consumption per unit shipped — visible during the shift, not after the month closes. |
Every Lagging KPI Is a Failure You Already Paid For. Every Leading KPI Is a Failure You Can Still Prevent.
iFactory AI gives warehouse operations managers real-time OEE tracking, leading indicator detection, automated root-cause analysis, and role-specific KPI dashboards — integrated with your existing WMS, CMMS, MES, and ERP in 4 to 6 weeks.
Book a Demo to see live KPI dashboards built around your delivery operation.
How iFactory AI Deploys Warehouse Delivery Analytics Across Operations
iFactory follows a structured deployment process that delivers live KPI visibility within the first two weeks and full AI analytics by week six. Each stage has defined deliverables so operations managers see measurable change — not multi-quarter analytics projects that produce dashboards no one uses.
Weeks 1–2
KPI Baseline Audit and Data Source Mapping
Current KPI definitions, calculation methods, and reporting cadence catalogued. Data sources mapped across WMS, CMMS, MES, ERP, SCADA, and IoT systems. Connectivity established via OPC-UA, MQTT, and REST APIs without disrupting running systems. Digital Shift Logbook deployed for handover continuity.
Weeks 3–4
Live KPI Dashboards and Role-Based Views
Real-time OEE, throughput, on-time delivery, and inventory accuracy dashboards activated. Role-specific views configured for operators, supervisors, managers, and executives. AI begins learning KPI baselines, normal ranges, and shift-specific patterns. First leading indicator alerts deliver to operations managers.
Weeks 5–6
Predictive Analytics and Automated Root-Cause Analysis
AI anomaly detection live across equipment, labor, and order data. Automated root-cause analysis activated — KPI breaches now arrive with diagnostic context, not just alerts. Automated shift, daily, and weekly reports deliver to operations managers and leadership. Multi-site rollout templates configured for additional facilities.
MEASURABLE OUTCOMES FROM WEEK 3: KPI VISIBILITY GAINS BEGIN IMMEDIATELY
Warehouse operators completing iFactory's 4 to 6 week deployment report decision-speed improvements within the first 30 days and downtime reduction of 25–40% within the first 90 days — delivering measurable OEE gains, on-time delivery improvements, and $15K per month in energy savings per facility, with full analytics intelligence producing 25% downtime reduction and 156+ prevented failures annually by month 6.
45%
OEE improvement reported across deployed warehouse operations
25%
Reduction in unplanned downtime within first 90 days
156+
Equipment failures prevented annually per facility
Warehouse Delivery Analytics: Use Cases from Live Deployments
The following outcomes are drawn from iFactory deployments at operating distribution centers and fulfillment facilities across e-commerce, retail, 3PL, and industrial distribution. Each use case reflects 9 to 12 month post-deployment performance data.
A regional e-commerce fulfillment operator was running blind on real OEE — pulling weekly throughput reports from a WMS export and reconciling with manual downtime logs. Estimated OEE hovered at 58% with no visibility into whether availability, performance, or quality was the dominant loss driver. iFactory deployed real-time OEE tracking across 6 sortation lines and 14 induction conveyors, breaking the metric into availability, performance, and quality components. Within 30 days, the dashboard revealed that 22% of "downtime" was actually micro-stops under 90 seconds — invisible to manual logs but compounding into 4.2 hours of lost shift capacity per day. Targeted fixes to induction timing and divert calibration lifted OEE to 79% within 6 months, recovering 22% additional throughput from existing equipment. Annual capacity value recovered exceeded $2.8M without capital expenditure.
Book a Demo to see real-time OEE applied to your fulfillment operation.
79%
OEE achieved within 6 months vs 58% pre-deployment baseline
$2.8M
Annual throughput value recovered with no capital expenditure
22%
Additional capacity recovered from micro-stop elimination
A national 3PL operator was running 91.4% on-time delivery against a 96% SLA target across 8 distribution centers, with monthly reviews identifying root causes weeks after the fact. iFactory introduced leading indicator dashboards tracking pick-face replenishment lag, staging lane backlog, dock door utilization, and predicted dispatch readiness vs carrier ETA. Within 60 days, supervisors were receiving SLA-risk alerts 4 to 6 hours before dispatch windows closed, with AI-recommended interventions (labor reallocation, dock reassignment, expedited routing) attached to each alert. On-time delivery improved to 97.1% across the network within 5 months, and SLA penalty exposure dropped 78% — delivering $1.4M in annual penalty cost avoidance.
Book a Demo to see leading indicator detection applied to your OTD program.
97.1%
On-time delivery rate vs 91.4% pre-deployment baseline
$1.4M
Annual SLA penalty cost avoidance across 8-facility network
78%
Reduction in SLA penalty exposure from predictive risk alerts
A retail distribution operator's operations managers were spending 6 to 9 hours per week assembling KPI reports from disparate systems and manually diagnosing the previous day's performance issues. iFactory's automated root-cause analysis correlated every KPI deviation across equipment, labor, and order data — producing diagnostic context like "Wave 3 cycle time spike driven by Zone 4 pick-face stockout traced to replenishment lag from Bay 12 reslotting." The Shift Logbook captured every KPI alert and intervention with photo evidence and AI-generated summaries. Operations manager reporting time dropped from 8 hours per week to 35 minutes, decision speed on KPI breaches improved from average 4 hours to 18 minutes, and corrective action quality measurably improved as diagnoses arrived with full context rather than raw alerts.
Book a Demo to recover operations manager time and accelerate KPI response in your facility.
35 min
Weekly KPI reporting time vs 8 hours pre-deployment
18 min
Average decision time on KPI breaches vs 4 hours pre-deployment
93%
Reduction in manual report assembly across operations management
Expert Perspective: Why Leading Indicators Separate High-Performing Warehouses
Industry Review — Warehouse Operations Performance Perspective
"The single biggest difference between a 95% on-time delivery operation and a 99% one is not better equipment or more labor — it is the time gap between data and decision. Operations managers running on weekly KPI reports are diagnosing failures that already affected customers. Operations managers running on real-time leading indicators are preventing those failures during the shift they emerge. The shift from lagging to leading is not a technology upgrade, it is an operational philosophy change. AI just makes the philosophy executable at scale across multi-site networks."
Warehouse Operations Performance Director — Multi-Site Distribution Network (provided via iFactory deployment reference)
This perspective aligns with what operations leaders report consistently across iFactory deployments: the highest-ROI gains come not from adding more KPIs but from collapsing the latency between KPI breach and operational response. AI creates that closed loop by treating warehouse delivery analytics as a continuous control problem rather than a retrospective reporting exercise. Book a Demo to speak with iFactory's warehouse analytics specialists about your current KPI program.
Real-Time KPIs. Predictive Alerts. Automated Root-Cause Analysis. Live in 4 to 6 Weeks.
iFactory gives warehouse operations managers role-specific dashboards, leading indicator detection, AI-driven root-cause analysis, and Shift Logbook continuity — integrated with your WMS, CMMS, MES, and ERP without rip-and-replace. Results measurable within 30 days.
Conclusion: AI Analytics Is Now the Standard for Warehouse Delivery KPIs
The case for AI-driven warehouse delivery analytics has moved beyond debate. With world-class OEE benchmarks at 85% while average warehouses operate at 60%, on-time delivery expectations consistently running at 95–97%, and operations managers losing 6–9 hours per week to manual KPI assembly that could be automated, the warehouses continuing to manage performance through weekly spreadsheet reviews and lagging indicators are accepting structural disadvantage that AI eliminates. Customer expectations for next-day and same-day delivery will not tolerate reactive operations indefinitely.
iFactory's platform delivers the specific capabilities warehouse operations managers require: real-time OEE and equipment availability tracking, leading indicator detection across replenishment, dock, and labor zones, role-specific KPI dashboards for every level of the organization, automated root-cause analysis, AI-powered Shift Logbook continuity, and integration with WMS, CMMS, MES, and ERP through OPC-UA, MQTT, and REST APIs. The 4 to 6 week deployment program means measurable KPI intelligence begins within weeks — not the multi-quarter analytics rollouts that historically produced dashboards no one trusted. Book a Demo to receive a warehouse delivery analytics assessment specific to your facility and current KPI program.
Frequently Asked Questions About Warehouse Delivery Analytics KPIs
Which warehouse KPIs should an operations manager prioritize first?
Start with OEE and unplanned downtime rate. These two metrics have the highest immediate financial impact and are the clearest indicators of where capacity is being lost. Once baselines stabilize, layer in MTBF, MTTR, on-time delivery, perfect order rate, and inventory accuracy as monitoring coverage expands across the operation.
What is the difference between leading and lagging warehouse KPIs?
Lagging KPIs measure outcomes after they happen (on-time delivery, OEE, order accuracy). Leading KPIs predict outcomes before they happen (replenishment lag, equipment health anomaly score, predicted dispatch readiness). A balanced program tracks both — leading for prevention, lagging for proof.
Does iFactory replace our existing WMS or CMMS to deliver KPI analytics?
No. iFactory integrates alongside existing systems via OPC-UA, MQTT, and REST APIs. Your WMS, CMMS, MES, and ERP continue running unchanged while the analytics layer adds AI-powered KPI intelligence on top. AI-generated recommendations and work orders can feed back into your existing systems automatically.
How does the AI-powered Shift Logbook support warehouse KPI tracking?
The Shift Logbook captures every KPI deviation, intervention, and outstanding exception across shifts with AI-generated summaries and photo evidence. Operations managers inherit full diagnostic context at every handover — eliminating the blind spots that occur when KPI history lives only in one shift's memory or paper logs.
What team resources are required to deploy AI warehouse analytics?
Typical deployments require 1–2 operations engineers (part-time) for KPI definition and asset selection, plus an IT resource for 2–4 weeks of integration work. iFactory handles model configuration, dashboard setup, and ongoing AI tuning. Most facilities go live with live KPI visibility within 2 weeks and full analytics by week 6.
Deploy AI Warehouse Delivery Analytics in 4 to 6 Weeks.
iFactory gives warehouse operations managers real-time OEE tracking, leading indicator detection, and AI-driven root-cause analysis — integrated with your existing WMS, CMMS, MES, and ERP.
45% OEE improvement across deployed operations
25% downtime reduction within 90 days
156+ failures prevented annually per facility