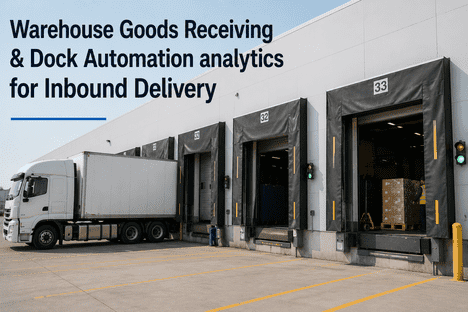
Warehouse Inbound Automation analytics Receiving & Putaway Systems
By Arel Dixon on May 29, 2026
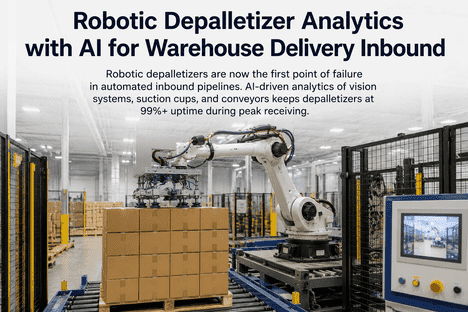
Inbound automation is the fastest-growing investment frontier in warehousing and the most analytics-intensive. Depalletizers, AI vision inspection systems, autonomous mobile robots for case and pallet transport, and automated putaway systems are now being deployed at scale across distribution centers handling millions of SKUs. The problem is not the hardware. The problem is that every one of these inbound assets generates failure signatures days before it breaks and almost no warehouse operation has a single platform reading all of them at once. A depalletizer that stalls during a peak inbound window does not just stop itself: it backs up the entire receiving dock, delays putaway AMRs, and propagates through the WMS as an inventory accuracy gap that takes hours to resolve. iFactory AI closes that gap by ingesting every inbound automation asset's sensor feed depalletizers, vision stations, receiving conveyors, putaway robots and surfacing failure signatures before they cascade into unplanned downtime during your most critical receiving windows.
Inbound Automation · Receiving Analytics · Putaway AI · 2026
Your Inbound Automation Is Only as Reliable as the Analytics Watching It.
iFactory AI ingests telemetry from every inbound asset — depalletizers, vision systems, receiving conveyors, and putaway robots — and predicts failures before they reach your receiving dock. On-premise. No rip-and-replace. Live in 6–10 weeks.
Why Inbound Is Now the Highest-Stakes Automation Zone in Your Warehouse
For years, warehouse automation investment focused almost entirely on outbound fulfillment — picking, sorting, and shipping systems drew the capital and the engineering attention. Inbound was the manual frontier: forklifts, hand-scanning, labor-intensive receiving dock workflows. That has changed fundamentally. Hy-Tek Intralogistics' 2026 warehouse automation report identifies inbound automation as the fastest-growing ROI frontier in warehousing — driven by robotic depalletizers, AI-enabled vision inspection, load exchangers, and putaway AMRs that together eliminate labor in what has historically been the warehouse's toughest, highest-error-rate zone.
But inbound automation creates a new category of operational risk that outbound systems don't share: cascade failure. When a sorter in your outbound zone goes down, it affects one part of your fulfillment flow. When your depalletizer goes down during a peak inbound window, it stops every downstream process simultaneously — receiving conveyors back up, putaway AMRs sit idle, dock doors queue, and inventory accuracy in your WMS begins to degrade as the manual workarounds kick in. The entire inbound process is a sequential pipeline, and the depalletizer is the valve at the top. Every minute of downtime during peak receiving costs, by industry estimate, $10,000 or more in lost fulfillment capacity. iFactory AI monitors every asset in that pipeline — and predicts which one is about to fail before it takes the rest down with it.
The Inbound Automation Investment Surge — 2026
#1
Inbound automation is now the top ROI frontier in warehousing — surpassing outbound for the first time in 2026
Major investments are flowing into robotic depalletizing, AI vision inspection, pallet-building robots, and putaway AMRs. The result: higher throughput, better ergonomics — and a new class of predictive analytics requirement that most facilities are not yet equipped to address.
Cost of unplanned downtime during peak inbound windows — a single depalletizer failure cascades to dock queues, idle AMRs, and WMS accuracy gaps within minutes
48%
of surveyed warehouses now use some form of robots — up from 23% in 2022. Inbound is the fastest-growing segment of this deployment wave
30%
reduction in unplanned downtime achievable through AI-driven predictive maintenance on warehouse automation assets — with 18% improvement in throughput forecast accuracy
200+
Pre-trained ML models in iFactory's library — covering depalletizers, vision stations, receiving conveyors, putaway AMRs, and dock equipment in one unified analytics engine
Five Inbound Automation Asset Categories. Five Different Failure Modes. One AI Platform.
Each inbound automation asset fails differently — different sensors, different degradation signatures, different upstream and downstream consequences. iFactory monitors all five simultaneously through a unified on-premise analytics engine, correlating signals across the entire inbound pipeline rather than watching each asset in isolation.
Asset 01
Robotic Depalletizers
Key Failure Modes
Suction cup degradation reducing grip consistency on mixed-pallet SKUs, arm joint torque drift causing positioning errors, vision calibration drift causing misidentification of irregular pallet stacks, conveyor infeed timing misalignment
What iFactory Monitors
Arm joint torque trends and positional accuracy deviation
Vacuum pressure cycle consistency per pick event
Cycle time drift indicating mechanical or vision degradation
Error-rate trend per SKU category and pallet configuration
Asset 02
AI Vision Inspection Stations
Key Failure Modes
Camera lens contamination reducing barcode read rates, lighting degradation causing misidentification, model drift as new packaging variations arrive, scan-station conveyor speed mismatches creating missed reads
What iFactory Monitors
Barcode read-rate trending per hour and per SKU type
No-read exception rate as proxy for lens or lighting degradation
Vision model confidence score distribution over time
Throughput rate vs. exception rate correlation alerts
Asset 03
Inbound Receiving Conveyors
Key Failure Modes
Drive roller wear creating timing gaps that cause product jams, motor temperature spikes from overload during peak inbound surges, belt tension drift, photo-eye misalignment causing false zone stops that idle the depalletizer upstream
What iFactory Monitors
Motor current draw and temperature trending per zone
Photo-eye timing consistency — 200ms gap signals worn roller
Belt tension sensor feeds and VFD frequency variance
Zone-level jam frequency rate trending by shift and SKU load
Asset 04
Putaway AMRs & AGVs
Key Failure Modes
Battery discharge curve degradation reducing per-shift capacity, drive wheel wear causing navigation drift in narrow aisle environments, charging dock connector wear, lift mechanism hydraulic pressure loss on heavy pallet loads
What iFactory Monitors
Battery discharge efficiency curve per charging cycle
Navigation error rate and positional correction frequency
Hydraulic pressure trends on lift mechanism cycles
Task completion latency trending against fleet baseline
Asset 05
Dock Levelers & Vehicle Restraints — The Inbound Entry Point
Key Failure Modes
Hydraulic pressure drift in leveler actuators causing slow cycle times, vehicle restraint engagement delay from sensor wear, dock door actuator wear, pit floor damage from overloaded inbound pallet staging
What iFactory Monitors
Leveler hydraulic cycle time vs. baseline — 0.8s drift signals actuator wear before failure
Dock door actuator current draw and cycle count trending
Inbound automation failures don't stay contained — they cascade. iFactory AI connects every asset in your receiving pipeline into a single cross-asset correlation model so you see the full failure chain, not just the individual alarm. Book a Demo and we'll map your inbound asset layout to a live predictive model in under two hours.
How iFactory Connects Your Inbound Data to Predictive Action in Four Steps
iFactory doesn't require a data migration, a cloud subscription, or a team of data scientists. Your inbound automation assets already produce the failure signals — the NVIDIA appliance reads them all and connects them into one predictive operations layer.
iFactory Inbound Analytics — Deployment Sequence
Week 1
CONNECT
NVIDIA appliance installed; top three inbound data sources connected
iFactory installs on your plant floor network and connects to your existing data sources — depalletizer PLC, receiving conveyor VFDs, putaway AMR telematics gateway, and dock equipment sensors — via native OPC-UA, Modbus, MQTT, or REST API. No sensor retrofits required. All data stays on your network from day one.
Weeks 2–4
BASELINE
200+ pre-trained ML models build your inbound-specific baselines within 72 hours
iFactory's library of pre-trained machine learning models — including depalletizer cycle analytics, vision system read-rate models, conveyor timing signatures, and AMR battery curve analysis — learns the normal operating envelope for your specific facility, SKU mix, and inbound shift patterns. Anomaly detection begins before the pilot is complete.
iFactory expands coverage to all inbound asset categories and activates cross-asset correlation — detecting, for example, that your putaway AMR task latency is rising because a receiving conveyor zone is creating micro-jams upstream, or that depalletizer error rate spikes correlate with a specific supplier's pallet configuration arriving on Tuesday morning runs. These pipeline-level patterns are invisible to any single-asset monitoring tool.
Week 10+
ACT
Auto-generated CMMS work orders and WMS-linked dispatch alerts
iFactory surfaces prioritised alerts, auto-generates CMMS work orders, and pushes shift-level dispatch recommendations to your operations team via email, SMS, or direct API to your existing systems. Predicted failures are scheduled for maintenance during planned downtime windows — not during the morning inbound rush when the first truck arrives at bay 4.
Which Inbound Asset Will Take Your Receiving Dock Down This Week?
iFactory builds predictive models from your existing inbound sensor data — depalletizer PLCs, vision system logs, conveyor VFDs, and AMR telematics — and shows you the failure signatures your team is currently missing. Book a Demo to see the inbound pipeline model live on your facility data.
The Cost of Siloed Inbound Analytics — What Disconnected Data Costs You Every Quarter
When each inbound asset reports to its own dashboard — depalletizer to the OEM portal, AMRs to the fleet management system, conveyors to the CMMS, vision stations to the WMS exception log — nobody is correlating the signals until something breaks. Here is what that looks like in numbers for a typical facility processing 8,000 inbound pallets per day.
$
Depalletizer Cascade Downtime During Peak Inbound
A single depalletizer failure during morning peak locks the entire inbound pipeline for an average of 47 minutes — backing up 6–8 trucks, idling 12+ putaway AMRs, and creating WMS accuracy exceptions that take a further 90 minutes to resolve. At $10,000+ per minute of peak inbound downtime, one event per week is a material operational cost.
$240K+/yr
$
Vision System No-Read Accumulation and Inventory Accuracy Loss
A vision station degrading from 99.2% to 97.1% read rate on an 8,000 pallet/day facility generates 168 unidentified items per day. Each requires manual exception handling averaging 8 minutes of labor and introduces inventory location errors that compound through the pick cycle. Facilities with manual quarterly cleaning schedules miss the gradual degradation entirely.
$180K/yr
$
AMR Battery Degradation and Inbound Putaway Capacity Loss
Putaway AMRs running at 78% battery efficiency complete fewer putaway cycles per shift than their nominal capacity — but the degradation is gradual enough that no single shift triggers an alert. Over a quarter, a fleet of 15 AMRs running 10% below nominal capacity represents 14 lost production-hours of putaway capacity — invisibly absorbed as increasing inbound staging queue depth.
$160K/yr
ROI: What iFactory Delivers on Your Inbound Automation Investment in Year One
These figures are drawn from iFactory deployments across distribution centers in consumer packaged goods, automotive parts, and third-party logistics — all running on-premise with no cloud dependency.
Depalletizer Uptime
+47%
Predictive alerts on joint torque drift and vacuum pressure degradation catch failures 8–14 days before they pull the depalletizer offline during an inbound run.
Vision Read Accuracy
99.6%
Continuous read-rate monitoring triggers cleaning and calibration alerts before degradation reaches the threshold that creates inventory accuracy exceptions in the WMS.
AMR PM Accuracy
92%
Condition-based scheduling replaces calendar PMs. Putaway AMRs get service when battery and mechanical data indicate it — not too early, not too late, and never during a peak inbound window.
First-Year ROI
4.5x
Combined savings from reduced pipeline downtime, improved inventory accuracy, and optimized PM labor. Average payback period: 5.4 months.
Frequently Asked Questions
Your WMS tracks inventory transactions and your CMMS tracks work orders — but neither applies predictive ML models to your inbound asset sensor data, and neither correlates signals across assets. A depalletizer arm torque drift that correlates with a conveyor photo-eye timing gap that correlates with an AMR task latency increase is a pipeline-level failure pattern that is completely invisible to both systems individually. iFactory sits on top of both, ingesting the raw sensor telemetry they never see and surfacing the failure 8–14 days before it creates a work order in your CMMS or an exception in your WMS. Book a Demo to see this cross-asset model live.
Yes. iFactory connects to any inbound automation asset that exposes telemetry via PLC (OPC-UA, Modbus), MQTT, or REST API — which covers every major depalletizer OEM, vision system platform, and AMR provider including Crown, Toyota, Raymond, Locus, Fetch, and 6 River Systems. For assets with proprietary data formats, we build normalization adapters during the pilot phase. The typical multi-OEM inbound integration — depalletizer PLC, vision station API, AMR telematics gateway, and conveyor SCADA — is complete within weeks 1–4 of deployment. You see predictive analytics before the full rollout is finished.
Seasonal SKU mix changes are one of the core scenarios iFactory's inbound models are built for. The platform tracks depalletizer performance separately for different pallet configuration profiles — learning that your Q4 consumer electronics pallets require different grip pressure settings than your Q1 apparel boxes, and that vision read rates drop on promotional packaging changes. When the inbound mix shifts, iFactory detects the new load profile within 72 hours and re-baselines the relevant anomaly thresholds automatically. You get accurate predictive alerts through every seasonal transition without manual model retraining.
Completely on-premise. iFactory runs on an NVIDIA appliance that sits on your facility floor network — no cloud dependency, no data egress, no third-party data processing. All sensor ingestion, ML model training, and alert generation happen inside your firewall. Your IT team manages the appliance as a standard network device. For facilities with export control, ITAR, or air-gap requirements, we offer a fully disconnected configuration with zero external network connectivity. Your inbound automation vendor portals continue to operate as they always have — iFactory reads the same sensor streams from your side of the network boundary.
When iFactory detects an inbound asset anomaly that exceeds its learned baseline threshold, it auto-generates a work order in your CMMS via REST API or native integration — including the asset ID, anomaly description, sensor evidence, recommended action, urgency level, and suggested maintenance window (defaulting to your next planned downtime slot, not during the morning inbound peak). The work order appears in your CMMS within 30 seconds of threshold breach. No manual data entry, no handoff lag between the sensor alert and the maintenance team. The integration is configured during weeks 2–4 of the pilot, before the full coverage rollout is complete. Book a Demo to see this auto-generated work order flow live on your CMMS.
Your Inbound Pipeline Is Already Generating the Failure Signals. iFactory Makes Them Visible.
Every depalletizer, vision station, receiving conveyor, and putaway AMR in your facility is broadcasting telemetry your operations team has never seen in one place. iFactory connects every stream, correlates every signal, and surfaces inbound failures before they reach your morning receiving window. On-premise. No cloud. No rip-and-replace. Live in 6–10 weeks.