AI-Powered Delivery Route Optimization | Smart Logistics & Fleet Efficiency

By David Cook on February 27, 2026

ai-delivery-route-optimization

A regional grocery chain operating 47 delivery vehicles across three metro areas was spending $2.3 million annually on fuel — and 19% of their orders were arriving outside the promised delivery window. Their dispatch team started at 5:30 AM every day manually building routes in spreadsheets, a process that took 2.5 hours and produced routes that ignored live traffic, vehicle capacity variations, and driver shift constraints simultaneously. When iFactory AI's machine learning route optimization went live, the same routing process took 4 minutes. Fuel spend dropped 23% in the first 90 days. On-time delivery rate climbed from 81% to 97.4%. And the two dispatchers who spent their mornings on route building moved to exception management and customer escalation — the work that actually required human judgment. This is what machine learning in delivery operations actually looks like: not a futuristic concept, but a measurable operational transformation happening at delivery businesses right now.

AI & Logistics  ·  Blog Post

AI in Delivery Operations: How Machine Learning is Optimizing Routes and Efficiency

Machine learning has moved from a buzzword to a measurable operational advantage in delivery. Fleets using AI routing are outperforming manual planning competitors by margins that compound every quarter. This guide explains how it works — and what it takes to implement it.

27%
Average reduction in cost per delivery with AI route optimization

40%
Fewer miles driven per delivery cycle when ML continuously re-optimizes

98.2%
On-time delivery rate achievable with real-time AI rerouting vs. 85–90% industry average

3.4×
Average ROI reported by delivery fleets in first 12 months of ML deployment
The Manual Routing Problem

Why Manual Route Planning Is Costing Your Fleet More Than You Realize

The hidden cost of manual routing isn't just the dispatcher's time — it's the compounded inefficiency of every suboptimal decision that cascades through the rest of the day. Here's where that money actually goes.

25%
Fuel waste from suboptimal routing
Static routes planned without live traffic data add 15–25% unnecessary mileage daily. At $4.20/gallon across a 30-vehicle fleet, that's $180,000–$300,000 per year in avoidable fuel cost.
$17.78
Average cost of one failed delivery
Re-attempt fuel and labor, customer service handling, and dispatch time. At a 5% failure rate on 2,000 weekly deliveries, that's $92,456 in annual failed delivery costs — before customer churn.
2.5 hrs
Daily dispatch time on manual route building
Two dispatchers spending 2.5 hours per morning on route building at $28/hr represents $36,400 annually in labor that produces no customer-facing output — and still generates suboptimal routes.
43%
of customers never return after a delivery failure
Customer lifetime value in repeat delivery relationships averages $2,400. A 5% failure rate across 2,000 monthly deliveries means $240,000 in potential LTV erosion — caused entirely by preventable operational failures.
How It Works

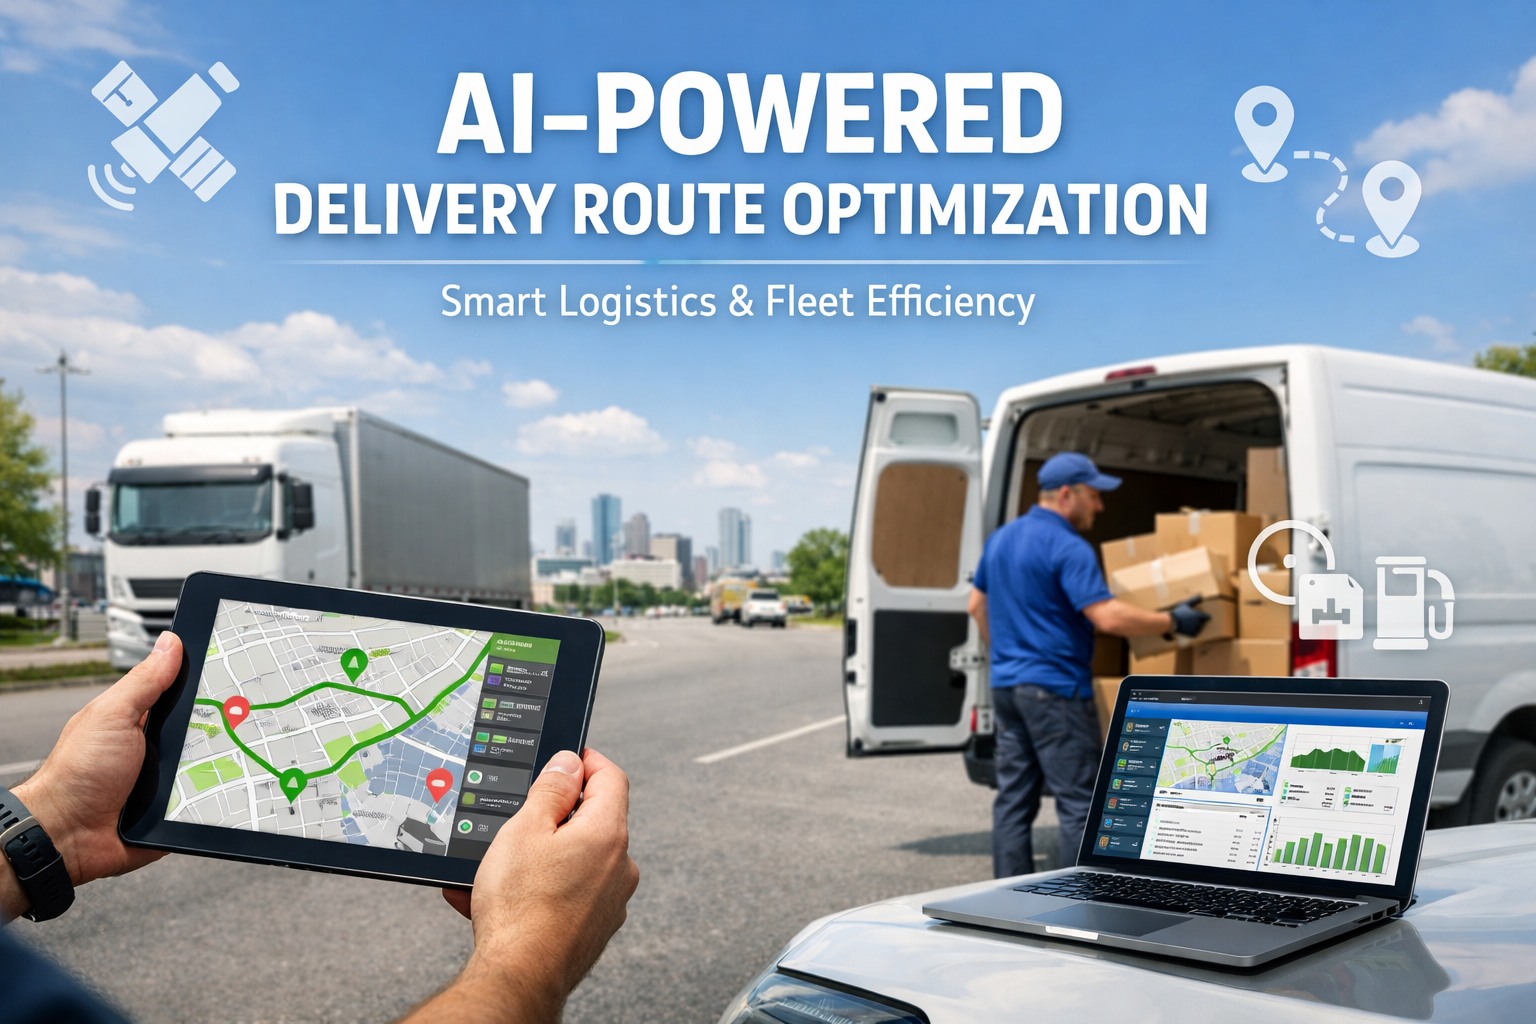
How Machine Learning Optimizes Delivery Routes — The 5-Step Intelligence Pipeline

ML route optimization is not a smarter GPS. It's a decision engine that processes hundreds of variables simultaneously and continuously — producing route plans no human dispatcher can match in speed or accuracy. Here's exactly how it works.

01
Data Ingestion — Real-Time & Historical
The ML engine continuously ingests data from every connected source: live GPS positions from all fleet vehicles, traffic API data updated every 90 seconds, historical delivery time data by stop location and time of day, vehicle capacity and load status, driver hours-of-service remaining, customer delivery window requirements, and weather data affecting road conditions. This data layer is what makes ML categorically different from static routing software — the inputs update continuously, so the output updates continuously.
Live GPSTraffic APIHistorical Stop TimesVehicle CapacityHOS DataWeather
02
Constraint Optimization — Solving the Impossible Puzzle
Each delivery route is a combinatorial optimization problem: sequence N stops across M vehicles subject to delivery windows, vehicle capacities, driver availability, and cost objectives simultaneously. ML solvers — specifically vehicle routing problem (VRP) algorithms enhanced with gradient-descent learning — evaluate millions of candidate solutions in seconds and find near-optimal arrangements that human planning consistently misses. For a 50-vehicle fleet with 20 stops each, the ML engine identifies solutions that save an average of 340 combined driving minutes per day versus dispatcher-built routes.
VRP AlgorithmTime WindowsLoad BalancingMulti-objective Optimization
03
Continuous Re-Optimization Throughout the Day
Static routing software produces a plan in the morning and holds it. ML-powered routing re-optimizes every time a new variable enters the system: a driver completes a stop early, a customer reschedules, traffic backs up on a key arterial, a vehicle develops a fault, or a new same-day order drops. Each event triggers a re-evaluation of all remaining routes — the engine redistributes stops across available vehicles to maintain the most efficient sequence for the rest of the day. This continuous re-optimization is where the largest efficiency gains occur.
Event-TriggeredReal-Time RebalancingSame-Day Order IntegrationDriver Recall Handling
04
Predictive ETA Generation & Customer Notification
The ML engine generates ETAs from learned historical travel time distributions for each road segment by time of day, day of week, and weather condition — producing ETAs accurate to ±8 minutes vs. the ±45–90 minute estimates static routing provides. Accurate ETAs feed automated customer notification workflows: delivery confirmation when the driver departs, a 30-minute alert when approaching, and a completion notification with POD documentation — all triggered automatically without dispatcher involvement.
Historical Travel Times±8 Min AccuracyAuto Customer AlertsLive Position Feed
05
Learning Loop — Every Route Makes the System Smarter
After each route completes, the ML engine compares predicted performance against actual: were ETAs accurate? Did the planned stop sequence prove optimal? Were there consistent delays at specific locations? This post-route learning updates the model's parameters — meaning every delivery cycle completed makes the next predictions more accurate. After 90 days, iFactory AI's ML engine's route predictions are 15–20% more accurate than day one. This compounding improvement is the advantage that widens over time — manual planning doesn't get better; ML routing does.
Predicted vs. ActualParameter Updates90-Day Accuracy GainCompounding Improvement
See iFactory AI's ML Route Optimization in a Live Demo
Watch the routing engine process a real fleet scenario — live traffic, delivery windows, vehicle constraints — and generate an optimized route plan in under 4 minutes.
AI Capabilities

The 5 AI Capabilities Transforming Delivery Operations in 2026

ML route optimization is the headline capability — but it's one of five interconnected AI capabilities that iFactory AI brings to delivery operations. Each one addresses a specific cost driver that manual systems cannot solve.

AI Route Optimization
27% lower cost per delivery
Multi-objective VRP solver balancing delivery windows, vehicle capacity, driver HOS, fuel cost, and customer priority simultaneously. Re-optimizes in real time as conditions change throughout the day.
Stop sequencing:Optimal across entire fleet
Re-optimization:Any status change event
Planning time:4 min vs. 2.5 hrs manual
Predictive Vehicle Maintenance
30% fewer breakdowns
OBD-II and telematics data feeds ML models that predict component failures 2–6 weeks before they occur — allowing PM scheduling that costs $380 vs. the $4,200 average unplanned repair.
Prediction window:2–6 weeks ahead
Planned vs. unplanned:$380 vs. $4,200
Downtime savings:$760/day per vehicle
Demand Forecasting
18% better fleet utilization
ML models trained on order history, seasonal patterns, and external demand signals forecast daily delivery volume by zone — allowing fleet pre-positioning and driver scheduling that prevents over- and under-staffing.
Forecast horizon:7-day rolling prediction
Accuracy:±8% on 7-day horizon
Applies to:Driver scheduling, fleet positioning
Real-Time Exception Handling
68% faster exception response
When a delivery exception occurs, the AI engine calculates impact on all remaining routes and proposes the optimal resolution in under 90 seconds. Manual exception analysis that took 15–20 minutes is replaced by an automated recommendation dispatchers can approve in one tap.
Manual resolution time:15–20 min per exception
AI resolution time:Under 90 seconds
Failed delivery reduction:45% fewer failures
Driver Performance Analytics
22% more deliveries per driver per day
ML models analyze driver behavior — idle time, route adherence, stop duration variance, fuel consumption — and identify both high performers to learn from and specific coaching opportunities that improve fleet-wide efficiency.
Metrics tracked:Idle, stop time, route adherence
Benchmark:vs. fleet average + top performers
Output:Coaching report + trend dashboard
Performance Comparison

Manual Routing vs. AI-Powered Delivery Operations — Every Metric

The performance gap between AI-powered and manually operated delivery fleets compounds across every operational dimension that determines profitability and customer retention.

Metric
Manual Operations
iFactory AI-Powered
Route planning time
2–3 hours daily (dispatchers building in spreadsheets)
4 minutes (AI optimization, all constraints applied)
On-time delivery rate
85–90% industry average with static routing
97–98.2% with continuous AI re-optimization
Failed delivery rate
4–8% — each costs $17.78 in direct recovery
Under 1% — exceptions resolved in under 90 seconds
Fuel cost per mile
15–25% excess from suboptimal stop sequencing
27% lower — mileage-minimized routes all day
ETA accuracy
±45–90 minutes — best guess from static speed assumptions
±8 minutes — learned from historical travel time data
Vehicle downtime
Reactive repairs — $4,200 avg cost, $760/day downtime
Predictive — $380 planned cost, 30% fewer breakdowns
Fleet utilization
60–70% — poor load balancing across vehicles
82–88% — ML-balanced stop distribution across fleet
Industry Applications

How Different Delivery Industries Apply ML — What Each Gains

The ML capabilities are the same — the application priorities differ. Here's how iFactory AI addresses the specific ML use cases that matter most in each sector.

Grocery & Food Delivery
Primary: Time-window optimization + cold chain compliance
Grocery delivery has the tightest window requirements — 30-minute precision and cold chain monitoring throughout. ML routing sequences stops to minimize window violations while ML-driven temperature sensors alert when cold chain conditions drift — preventing the $28,000/month cold chain violation losses that reactive monitoring allows.
94% of deliveries within 30-min window vs. 71% industry average
B2B & Wholesale Distribution
Primary: Multi-stop optimization + demand forecasting
B2B distribution routes involve 20–40 stops per vehicle with dock scheduling constraints and variable order volumes. ML optimization applied to multi-stop B2B routing consistently reduces route count by 12–18% — the same delivery volume handled by fewer vehicles with lower cost per drop.
18% fewer vehicles needed for same delivery volume
Pharmaceutical & Healthcare
Primary: Chain-of-custody tracking + temperature compliance
ML-driven chain-of-custody automation logs every custody handoff with GPS-timestamped proof, while temperature ML models detect cold chain drift before a threshold violation occurs. Delivery dispute resolution that previously required 47-minute documentation searches resolves in 4 minutes from the unified audit trail.
100% chain-of-custody documentation, 0 compliance violations
E-Commerce & Retail
Primary: Same-day routing + customer notification automation
ML same-day routing ingests orders in real time and slots them into active routes dynamically without requiring a new dispatch cycle. Automated customer notifications generated from live position data eliminate the "where's my order" support calls that occupy 40–60% of customer service capacity in reactive operations.
81% reduction in customer service call volume
Deployment Timeline

Deploying AI in Your Delivery Operations — The First 90 Days

The most common concern delivery operations managers raise about ML deployment is implementation complexity. iFactory AI's deployment is structured to minimize disruption and deliver measurable results within the first 30 days.

Week 1–2
Data Integration & System Connection
Connect iFactory AI to your existing GPS telematics provider (Samsara, Geotab, Verizon Connect, KeepTruckin, or 30+ others), import vehicle and driver master data, and configure your delivery zones. The ML engine begins learning your operating environment immediately from the first connected GPS feeds. Historical data import from your previous routing system seeds the model for faster accuracy. Most fleets complete integration in 3–5 business days without IT department involvement.
GPS connectedVehicle data importedDriver accounts configuredML learning begins
Week 2–4
Parallel Run & Team Training
For 7–14 days, iFactory AI generates AI-optimized routes alongside your existing manual routing process. Dispatchers compare the AI output against their manual routes daily — this parallel period consistently shows AI routes outperforming manual routes by 15–22% on mileage and delivery window compliance. Dispatchers who see the performance difference firsthand become advocates for full transition. Driver mobile app training runs during this period — typically complete in a 45-minute session.
AI vs. manual daily comparisonDriver app trainingDispatcher onboarding complete
Week 4+
Full AI Operation & Continuous Learning
Manual routing is retired. iFactory AI becomes the sole route planning system. Dispatchers shift from route building to exception management — the high-value work that requires human judgment. The ML model continues to improve: week 12 accuracy is materially better than week 4. The analytics dashboard begins generating fleet performance data — cost per delivery, on-time rates, driver performance rankings, vehicle maintenance predictions — that makes continuous improvement possible. Most fleets see measurable ROI within the first 30 days of full operation.
Full live operationDispatchers on exceptionsAnalytics dashboard livePredictive maintenance active
Frequently Asked Questions

AI in Delivery Operations — Detailed Questions Answered

These are the questions delivery operations managers, fleet directors, and logistics technology leads ask when evaluating ML-powered delivery optimization.

What exactly does machine learning do in delivery routing that GPS routing software doesn't?
Traditional GPS routing software finds a route from point A to point B using current traffic data. Machine learning delivery optimization solves a fundamentally different problem: it optimizes the sequence and assignment of hundreds of stops across a fleet of vehicles with different capacities, different delivery windows, different driver shift lengths, and different cost objectives — simultaneously and in real time. The key differences are: (1) Multi-objective optimization — ML balances fuel cost, delivery windows, driver overtime, vehicle capacity utilization, and customer priority all at once. (2) Fleet-wide optimization — rather than optimizing each route independently, ML considers all routes together, redistributing stops across drivers to minimize total fleet cost. (3) Continuous re-optimization — when any condition changes, ML re-evaluates all remaining routes simultaneously and rebalances the fleet's workload. (4) Learning from history — ML builds models of how long deliveries actually take at specific locations by time of day and day of week, producing ETA accuracy that static routing cannot achieve. The combined effect is why fleets using ML routing see 27% lower cost per delivery — it's not incremental improvement, it's a different class of optimization entirely.
How does iFactory AI integrate with our existing GPS telematics system?
iFactory AI integrates with your existing GPS telematics system through direct API connections — you do not need to replace your current hardware or telematics subscription. iFactory has pre-built integrations with Samsara, Geotab, Verizon Connect, KeepTruckin/Motive, Lytx, Fleet Complete, Teletrac Navman, and 25+ additional telematics providers. For each provider, the integration pulls real-time GPS positions, live odometer readings, engine fault codes, engine hours, idle time, and driver behavior events directly into iFactory AI's data layer. Setup for supported providers takes 15–30 minutes: you provide your telematics API credentials, iFactory connects, and data begins flowing immediately. For telematics providers not on the pre-built list, iFactory AI accepts data in standard GPS formats via open API. The integration is hardware-agnostic by design — iFactory does not sell proprietary hardware and does not require replacement of devices already deployed. Book a demo to verify integration compatibility with your specific telematics provider.
How long does it take for the ML models to learn our fleet's specific patterns?
The ML learning timeline has three phases. In the first week, iFactory AI's models operate with general priors — already optimizing better than manual routing because the multi-objective VRP optimization is superior to human dispatching even without fleet-specific learning. From weeks 2–4, the models learn your fleet's actual delivery time patterns: they learn that the industrial complex on the east side of your zone always runs 12 minutes longer than GPS predicts, or that a specific driver consistently completes stops 15% faster than average. After 90 days, iFactory AI's fleet-specific prediction accuracy is 15–20% higher than day one. To accelerate this learning curve, historical data import at deployment seeds the model with prior delivery time distributions — fleets that import 90+ days of historical stop time data from their previous systems see the 90-day accuracy level achieved in approximately 30 days.
How does the AI handle delivery exceptions — customer unavailable, address issues, vehicle problems?
When a delivery exception occurs, the ML engine's response begins within seconds. The driver submits the exception through the iFactory AI mobile app — selecting the exception type (customer unavailable, access issue, address incorrect, refused delivery, vehicle problem) and optionally attaching a photo. The engine immediately calculates the impact on that driver's remaining route and on all other active routes in the fleet. For most exception types, the optimal resolution is identified and proposed in under 90 seconds — the dispatcher either approves the AI recommendation or selects an alternative, and the affected routes update immediately on all driver apps. Vehicle problem exceptions automatically generate a maintenance work order in iFactory AI's CMMS layer, assigned to the appropriate shop technician — ensuring the vehicle condition is addressed regardless of whether a dispatcher manually follows up. Every exception event is automatically logged with GPS timestamp, exception type, resolution chosen, and outcome, creating the audit trail that customer disputes require to resolve quickly.
How does iFactory AI's predictive maintenance connect to route optimization?
iFactory AI's predictive maintenance and route optimization share the same vehicle data layer — meaning maintenance intelligence directly influences routing decisions in ways that siloed tools cannot achieve. Practically: vehicles flagged for imminent maintenance are marked in the routing engine's vehicle eligibility list, so the AI does not assign new multi-day routes to vehicles within 48 hours of a predicted maintenance event. When the ML maintenance engine predicts a failure, it automatically schedules the vehicle's last full route before the maintenance appointment. Driver behavior data that feeds driver performance analytics also feeds vehicle health models, connecting behavior to wear patterns. And if a vehicle develops an active fault code during a route, the exception layer triggers immediately — the routing engine proposes stop redistribution to other vehicles and generates a maintenance work order simultaneously. This is what makes iFactory AI different from using separate routing and maintenance tools — the data silos between those tools are precisely what allows vehicle failures to disrupt routes unexpectedly.
What ROI should we realistically expect and how quickly does payback occur?
ROI from ML-powered delivery optimization has five measurable components. Fuel savings: 27% average reduction. For a 30-vehicle fleet at $180,000 annual fuel spend, that's $48,600. Failed delivery reduction: moving from 5% to under 1% failure rate at $17.78 per failure on 2,000 weekly deliveries saves $74,676 annually. Dispatch labor recovery: eliminating 2.5 hours daily of manual route building at $28/hr across 2 dispatchers saves $36,400 per year. Vehicle downtime prevention: predictive maintenance reducing unplanned breakdowns by 30% — at $4,200 per prevented failure across a 30-vehicle fleet averaging 4 annual breakdowns each — saves $50,400. Customer retention: preventing failed deliveries at a 43% churn rate preserves substantial LTV in repeat-delivery relationships. Combined, a 30-vehicle fleet realistically achieves $210,000–$280,000 in first-year measurable savings. At iFactory AI's pricing model, most fleets achieve payback within 45–75 days of full deployment. The 3.4× first-year ROI benchmark is consistent across deployments in this size range. Book a demo to run the calculation with your specific fleet metrics.
Your fleet data already contains the intelligence to cut delivery costs 27%. iFactory AI unlocks it.

AI route optimization, predictive maintenance, demand forecasting, real-time exception handling, and driver performance analytics — unified in a single platform that connects to your existing telematics in days and delivers measurable ROI within the first month.


Share This Story, Choose Your Platform!