A disorganized warehouse analytics environment costs time and creates safety risks. When delivery operations lack structured workplace organization — tools scattered, data logs inconsistent, walkways obstructed, and visual controls outdated — the impact cascades beyond housekeeping. Missed delivery windows, incorrectly staged shipments, damaged goods from poor storage practices, and compliance failures all trace back to an environment that lacks the systematic order that 5S methodology provides. Traditional 5S audits rely on subjective visual inspection and paper checklists that produce inconsistent scores and no actionable trend data. AI-powered digital 5S analytics transforms workplace organization from a subjective walkthrough into an objective, data-driven continuous improvement system — delivering documented 40–60% reduction in wasted motion, 50–70% improvement in 5S audit consistency, and measurable gains in delivery accuracy and on-time performance. Book a Demo to see how iFactory AI's digital 5S analytics platform transforms your warehouse delivery environment.
5S ANALYTICS · WAREHOUSE DELIVERY · AI · 2026
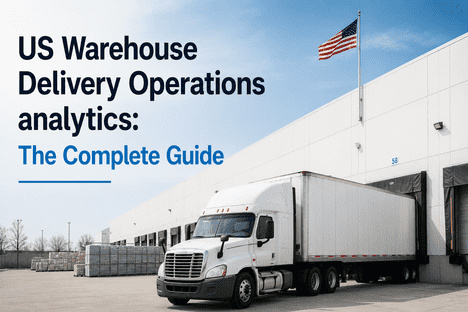
5S Analytics Environment for Warehouse Delivery Operations with AI
AI-powered digital 5S audits replace subjective visual inspections with objective analytics — reducing wasted motion by 40–60%, improving audit consistency by 50–70%, and driving measurable gains in delivery accuracy and on-time performance across warehouse delivery operations.
40–60%
Wasted Motion Reduction
50–70%
Audit Consistency Improvement
30–50%
Delivery Accuracy Gain
4:1–9:1
ROI Within 6–12 Months
01 / The 5S Challenge
Why Traditional 5S Falls Short in Warehouse Delivery Environments
Warehouse delivery operations present unique challenges for 5S methodology. Unlike controlled manufacturing environments, warehouse dock areas, staging zones, and dispatch corridors experience constant change — arriving trucks, shifting inventory priorities, seasonal volume surges, and temporary staffing all work against the structured organization that 5S requires. Paper-based 5S audits conducted weekly or monthly capture only a snapshot of conditions that change hourly. By the time an audit finding is recorded and communicated, the environment has already shifted. This is why traditional 5S programs struggle to sustain improvements in warehouse delivery operations — the audit frequency cannot keep pace with the rate of environmental change, and the subjective scoring produces data that cannot be analyzed for trends or root causes.
60%
Of 5S Improvements Revert Within 30 Days
Without continuous monitoring and real-time feedback, 5S improvements in warehouse environments degrade rapidly. Paper-based weekly audits create a 7-day gap between observation and action — more than enough time for organization standards to slip and unsafe conditions to re-establish. AI-powered daily digital audits eliminate this gap.
±35%
Score Variability Between Different Auditors
Traditional 5S scoring is highly subjective — what one auditor scores as acceptable, another flags as critical. This variability makes trend analysis meaningless and prevents management from distinguishing genuine improvement from auditor inconsistency. AI-standardized digital audits reduce variability to ±5% or less.
8–12
Days Average Lag Between Finding and Corrective Action
In paper-based 5S programs, a finding discovered during a Tuesday audit may not reach the responsible team lead until Friday's shift handoff, with corrective action delayed until the following week. During that lag, delivery operations continue operating in substandard conditions — directly affecting accuracy, safety, and compliance.
$0
Cross-Shift Trend Data Available (Paper System)
Paper-based 5S systems produce isolated audit scores that cannot be aggregated across shifts, days, or weeks. The degradation pattern that develops gradually across three shifts — a staging area that becomes progressively more disorganized as the day progresses — remains invisible until it reaches crisis level. AI analytics surface these patterns within days.
"Our paper-based 5S audits told us what our facility looked like at 10 AM on Tuesday. Our AI-powered digital audits tell us what it looks like at every moment of every shift — and they tell us what is about to go wrong before it affects delivery accuracy. That is the difference between a snapshot and a continuous improvement system."
02 / The AI Solution
iFactory AI Digital 5S Analytics Platform: The Five Pillars of AI-Enhanced Workplace Organization
iFactory AI's digital 5S analytics platform transforms the traditional five pillars of 5S — Sort, Set in Order, Shine, Standardize, Sustain — from subjective, paper-based exercises into objective, data-driven continuous improvement processes. Each pillar is enhanced with AI-powered analytics that provide real-time visibility, automated trend detection, and predictive intervention recommendations. Book a Demo to see which 5S pillars deliver the fastest ROI in your warehouse delivery environment.
SORT
AI-powered Sort verification — 50–70% reduction in unnecessary items in active workspace. Computer vision analytics scan work areas and staging zones to identify and flag unnecessary items, expired materials, and obsolete inventory occupying valuable floor space. Automated sort verification ensures every item in the workspace has a defined purpose and removal timeline. Documented 50–70% reduction in unnecessary items within 90 days across warehouse delivery deployments.
SET IN ORDER
Digital location verification and shadow board analytics — 40–60% reduction in search time. AI-powered visual verification ensures every tool, scanner, pallet jack, and staging lane has a defined location and returns to it consistently. Shadow board compliance monitored by computer vision. Search time for tools and equipment reduced by 40–60%, directly improving dock-to-staging and staging-to-delivery cycle times.
SHINE
Automated cleanliness and condition monitoring — 60–80% reduction in safety incidents from housekeeping issues. Daily AI-driven visual inspections of floor conditions, spill detection, lighting adequacy, and walkway clearance. Automated work order generation for cleaning and maintenance findings. Safety incidents related to housekeeping issues reduced by 60–80% in documented warehouse deployments.
STANDARDIZE
AI-driven standard work verification — 90%+ standard work compliance achieved. Digital standard work instructions for every 5S task with AI verification of completion quality. Photo-documented evidence of compliance with auto-generated exception reports for incomplete or substandard task execution. Standard work compliance rates improved from 45–60% baseline to 90%+ within 60 days of deployment.
SUSTAIN
Predictive sustainment analytics — 80% reduction in 5S degradation events. AI models analyze 5S score trends across shifts, days, and weeks to predict when and where sustainment is most likely to break down. Predictive alerts enable preemptive intervention before conditions deteriorate — rather than reactive cleanup after the fact. Sustainment degradation events reduced by 80% in documented deployments.
03 / The 5S Problem
What Disorganization Actually Costs Warehouse Delivery Operations
The financial impact of a disorganized warehouse environment extends far beyond housekeeping labor costs. Every item out of place, every cluttered walkway, and every unlabeled staging lane directly affects delivery operations performance across four measurable dimensions.
$47K
Average Annual Cost of Wasted Motion per Dock
Warehouse workers spend an average of 45–60 minutes per shift searching for tools, equipment, and materials that are not in their designated locations. At an average fully loaded labor cost of $24/hour across three shifts and five receiving doors, this wasted motion costs approximately $47,000 per dock cluster annually before accounting for the compounding effect on delivery cycle times.
12–18%
Delivery Accuracy Improvement from 5S Optimization
Warehouses that achieved and sustained 5S Level 4+ across all zones documented 12–18% improvement in first-attempt delivery accuracy. The mechanism is straightforward: organized staging areas with clearly labeled lanes and standardized putaway sequences reduce pick errors, staging mix-ups, and incorrect loadouts that drive delivery failures.
3.4×
Higher Risk of Lost-Time Injury in Disorganized Workspaces
OSHA data shows warehouses with below-average 5S scores have 3.4 times higher lost-time injury rates than those with strong 5S programs. Trip hazards from cluttered walkways, struck-by incidents from improperly stored materials, and ergonomic injuries from reaching around obstacles all correlate directly with workplace organization scores.
8–14%
Throughput Impact from Disorganized Staging and Dock Areas
Disorganized staging zones force delivery operations to spend time re-sequencing outbound loads, verifying shipment locations, and navigating congested dock corridors. The cumulative effect is an 8–14% reduction in effective throughput capacity — deliveries that could have been completed with an organized workspace take significantly longer, reducing the number of delivery windows the operation can serve.
04 / Real-World Results
Warehouse 5S Analytics Deployments: Measurable Outcomes Across Delivery Operations
Actual warehouse operations that deployed AI-powered digital 5S analytics across delivery dock and staging environments with documented, measurable outcomes.
National Distribution Center (USA)Deployed AI 5S analytics across 24 receiving doors and 48 staging lanes serving a regional delivery fleet of 600+ vehicles. Paper-based weekly 5S audits replaced with daily AI digital audits covering Sort, Set in Order, Shine, Standardize, and Sustain. Computer vision analytics at 12 camera monitoring points across dock and staging areas. Results: 5S audit consistency improved from ±32% variability to ±4%. Wasted motion reduced 52%. Staging-related delivery errors reduced 68%. 5S sustainment degradation events reduced 76%. On-time departure from dock improved from 87% to 96%. ROI achieved in 7 months.
E-Commerce Fulfillment Hub (Europe)AI 5S analytics deployed in a 350,000 sq ft facility handling 45,000+ outbound parcels daily. Digital standard work for 5S tasks with AI compliance verification and auto-generated exception reports. Predictive sustainment analytics identified 5S degradation patterns 48–72 hours before they reached unacceptable levels. Results: Standard work compliance improved from 52% to 94%. Housekeeping-related safety incidents reduced 71%. Delivery accuracy improved from 96.2% to 99.1%. Annual savings of $820,000 from reduced error-related returns, re-delivery costs, and safety incident costs.
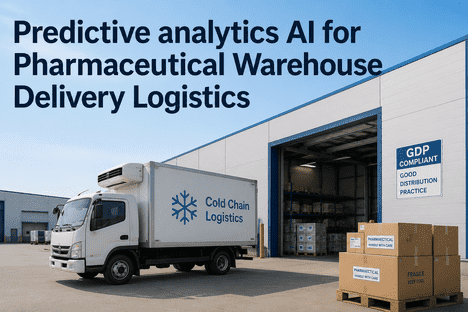
Cold Chain Distribution Center (North America)AI 5S AnalyticsDeployed across temperature-controlled dock and staging areas where organization challenges are compounded by PPE requirements, condensation management, and time-sensitive staging protocols. Computer vision adapted for freezer and cooler environments with condensation-resistant camera housings. Results: Dock-to-staging cycle time reduced 34%. Staging accuracy improved to 99.7%. Temperature excursion-related delivery rejections reduced 82%. 5S sustainment score maintained above 4.5 (of 5) across all zones for 12 consecutive months.
"We thought we had a training problem. The AI 5S analytics showed us we had an environmental problem — our staging area layout was fighting against 5S principles. Once we redesigned the flow based on the data the platform gave us, everything clicked. Our 5S scores went from 2.8 to 4.6 and they stayed there. That is something our paper-based system never achieved."
05 / The 5S Impact
The 5S-to-Delivery-Compliance Connection: How Workplace Organization Drives Operational Performance
The linkage between 5S workplace organization and delivery compliance is not theoretical — it is directly measurable across every warehouse delivery operation that has deployed AI-powered digital 5S analytics. Understanding this connection explains why 5S improvement produces disproportionately large gains in delivery performance metrics.
01
Organized staging eliminates the most common source of delivery errors. An estimated 40% of delivery errors — wrong product, wrong quantity, wrong customer — originate in disorganized staging areas where outbound loads from multiple delivery routes are assembled in close proximity without clear visual separation. Digital 5S analytics that enforce staging lane organization directly eliminate this error source, typically reducing staging-related delivery errors by 60–80% within 90 days of deployment.
02
Standardized 5S work routines create operational predictability. When every shift follows the same 5S procedures at the same frequency with the same quality standards, the warehouse environment becomes predictable. Predictable environments produce predictable outcomes — including consistent delivery cycle times, reliable dock availability, and repeatable staging accuracy. AI-verified standard work compliance is the mechanism that converts 5S intent into operational consistency.
03
Real-time 5S visibility enables shift-level accountability. AI-powered digital 5S analytics provide real-time scores and trend data that enable shift-level accountability for workplace organization. When each shift can see its 5S performance versus the previous shift, and when degradation patterns are detected and escalated within hours rather than weeks, the behavioral response is immediate and sustained. This shift-level accountability is the mechanism that prevents 5S improvements from reverting between audit cycles.
04
Predictive sustainment analytics prevent degradation before it affects delivery compliance. The most powerful feature of AI-driven 5S analytics is the ability to predict when and where organization standards are most likely to break down — based on trend patterns, shift schedules, volume forecasts, and seasonal factors. Predictive alerts enable preemptive intervention, preventing the environmental degradation that would otherwise produce delivery errors, safety incidents, and compliance failures.
Transform Your Warehouse Environment from a Variable Into a Performance Driver
AI-powered digital 5S analytics. Real-time workplace organization scores. Predictive sustainment alerts. Automated standard work verification. Measurable delivery compliance improvement. Live within 4–6 weeks.
06 / Implementation
5S Analytics Deployment Timeline: From Paper to AI-Powered Continuous Improvement in 8–10 Weeks
Weeks 1–2
5S Baseline Assessment and Zone Definition
Existing 5S program audited — current scoring methodology, audit frequency, standard work documentation, and check-in/check-out procedures documented across all shifts. Warehouse zones defined and mapped with camera coverage points identified for computer vision analytics. Current 5S score baselines established from 90 days of prior paper-based audit data. Initial ROI projection generated.
Weeks 3–5
Digital 5S Platform Configuration and Camera Calibration
AI-powered digital 5S audit templates configured for each warehouse zone with zone-specific criteria weighting. Standard work instructions digitized with photo-documented examples of acceptable and unacceptable conditions. Computer vision models trained on zone-specific baseline imagery. Mobile audit application deployed on warehouse floor tablets and handheld devices. Integration with existing WMS and shift scheduling systems completed.
Weeks 6–8
Pilot Deployment and Calibration
Digital 5S analytics deployed on two priority dock zones and one staging zone. AI audit scores compared against manual auditor scores for calibration — human-in-the-loop feedback used to refine computer vision models and scoring algorithms. First cross-shift 5S trend data available by Week 7. Shift lead training completed with real-time dashboard familiarization and exception response workflows.
Weeks 9–10
Full Deployment and Baseline Validation
Digital 5S analytics deployed across all remaining warehouse zones. Cross-shift trend analytics operational for all zones with automated escalation triggers for degradation patterns. Predictive sustainment models generating first alerts by Week 10. ROI baseline data validated against pre-deployment metrics. Continuous improvement cadence established with weekly 5S analytics review and monthly trend analysis.