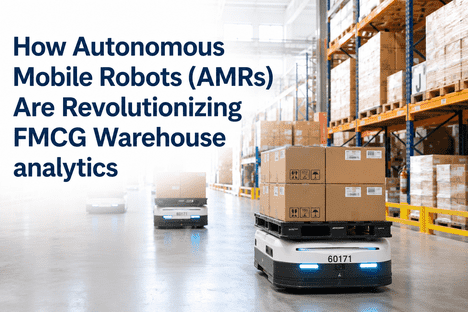
The most expensive hour in an FMCG warehouse is not the hour when a forklift breaks down or a conveyor jams. It is the hour when every worker is present, every picking station is staffed, every shipping dock is open — and the materials have not arrived. The autonomous mobile robot that was supposed to deliver the next pallet of finished goods from the production line to the staging area is waiting at a congested intersection. The fleet management system shows all 38 AMRs as operational, but throughput has dropped 22% in the last 90 minutes because the fleet's traffic management algorithm is routing every robot through the same aisle, creating a gridlock that no individual robot can detect or resolve. The production line keeps running, the warehouse workers keep waiting, and the material-related idle time accumulates at a cost of $4,800 per hour — invisible to every production monitoring system that tracks machine uptime but blind to the material flow interruptions that determine whether those machines stay productive. For FMCG warehouse and logistics managers who have invested in autonomous mobile robots to eliminate material-handling delays, book a demo with iFactory to discover how AMR analytics reveals the fleet coordination gaps that reduce AMR material-related idle time by 60 to 80% and turns a collection of individual robots into a synchronised warehouse logistics system.
AMR Fleet Analytics · Traffic Optimisation · Mission Monitoring · Uptime Prediction
FMCG Warehouses Achieving 60-80% Material Idle Time Reduction Are Not Buying Better Robots — They Are Applying Analytics to the Robots They Already Have.
iFactory's Robotics and Cobot Analytics Tracking platform gives FMCG warehouse operators real-time visibility into every AMR's mission status, battery health, traffic congestion patterns, and material transfer completion rates — converting a fleet of individual transport robots into a synchronised, analytics-optimised material flow system.
60-80%
Reduction in material-related idle time achieved by FMCG warehouses that deploy fleet-level analytics to optimise AMR routing and mission sequencing
22-35%
Increase in effective AMR fleet throughput when traffic congestion patterns are identified and rerouting strategies are applied based on real-time intersection analytics
40%
Reduction in unplanned AMR downtime when battery health trends, motor current signatures, and wheel wear patterns are monitored at the individual robot level
8-12%
Improvement in overall warehouse OEE from eliminating material-flow interruptions that cause production line starvation and worker idle time
The AMR Analytics Gap: Why Fleet Management Systems Alone Cannot Prevent Material-Flow Interruptions
Every autonomous mobile robot in an FMCG warehouse comes with a fleet management system that tracks robot location, battery level, mission status, and error states. These systems are essential for real-time robot control — they tell you where every AMR is and what it is doing at this moment. But they are structurally incapable of answering the three questions that determine whether your material flow is efficient or interrupted: which traffic intersections are becoming congested before the congestion causes a deadlock, which robots are consuming more energy per mission than their fleet peers and are at risk of premature battery failure, and which material transfer points are experiencing chronic wait times that the individual robot missions are designed to tolerate but that cumulatively degrade warehouse throughput by 15 to 25%.
The gap between having a fleet management system and having fleet analytics is the difference between knowing that a robot is waiting at an intersection and knowing that the same intersection has generated 47 minutes of cumulative wait time across 12 robots in the last hour — reducing effective throughput by 18% and creating a material starvation condition at the production line that no individual robot mission status will flag. iFactory's Robotics and Cobot Analytics Tracking platform fills this gap by ingesting data from the fleet management system's API, the warehouse execution system, and the AMR's onboard sensors to build a continuous, multi-robot analytics layer that identifies traffic, battery, mission, and material flow patterns that are invisible at the individual robot level.
VISIBLE TO FLEET MANAGEMENT SYSTEM
Individual Robot Status
AMR location, battery %, and current mission assignment per robot
Error codes and fault states at the individual robot level
Mission completion status — success, failure, or timeout per assignment
Battery charging status and estimated runtime remaining at current power draw
VISIBLE ONLY WITH FLEET ANALYTICS
Multi-Robot Fleet Patterns
Traffic intersection congestion heatmap — cumulative wait time per zone across the entire fleet
Robot-level energy consumption trending — battery degradation rate, charge cycle efficiency, and range drift
Material transfer point wait time analysis — chronic delays at specific handoff locations that no individual mission flags
Predictive maintenance alerts — motor current signature deviation, wheel wear patterns, and navigation accuracy drift
The Four Dimensions of AMR Fleet Analytics
Effective AMR fleet analytics in an FMCG warehouse environment requires simultaneous measurement across four interdependent dimensions. Improving any single dimension in isolation produces limited throughput gain — the fleet's performance is determined by the weakest of the four dimensions at any given moment. iFactory's platform tracks all four dimensions continuously and identifies which dimension is currently constraining overall warehouse material flow.
1
Traffic & Congestion
Real-time intersection congestion heatmap identifying zones where cumulative AMR wait time exceeds the threshold that triggers production line starvation. Dynamic rerouting recommendations generated when congestion at any intersection exceeds 5 minutes of cumulative wait time per 15-minute window.
Primary metric: Zone wait time / 15 min
2
Battery & Energy Health
Per-robot battery degradation trending — charge cycle efficiency, capacity fade rate, and energy consumption per mission compared against fleet baseline. Robots exceeding 15% energy consumption deviation from fleet mean flagged for battery health assessment before unexpected failure occurs during a critical mission.
Primary metric: kWh / mission deviation
3
Mission & Throughput
Mission completion rate and average cycle time per robot, per zone, and per route type. Missions exceeding 1.5x the baseline cycle time flagged for root cause analysis — traffic congestion, navigation error, blocked path, or material transfer point delay.
Primary metric: Mission cycle time deviation
4
Mechanical Health
Motor current signature analysis, wheel encoder deviation, navigation accuracy drift, and chassis vibration patterns per robot. Predictive maintenance alerts generated when any parameter crosses the adaptive threshold — enabling maintenance intervention before the robot fails during a shift.
Primary metric: Composite health score
Six AMR Failure Patterns That Fleet Analytics Detects Before They Cause Downtime
Autonomous mobile robots in FMCG warehouses fail along six predictable patterns — each with a distinct detection signature that fleet analytics identifies days or weeks before the failure causes unplanned downtime. These patterns are invisible to fleet management systems that monitor individual robot status because they emerge only when fleet-level data is analysed across time, across robots, and across warehouse zones.
Intersection Gridlock
Multiple AMRs converge on the same intersection within a narrow time window. The fleet management system resolves each individual conflict sequentially, but the cumulative delay propagates across the fleet as robots queue at upstream intersections.
Fleet analytics identifies the intersection as a hot spot when cumulative wait time exceeds 5 minutes per 15-minute window. Dynamic rerouting or intersection-based traffic scheduling reduces the congestion pattern before it propagates.
Battery Degradation
Battery capacity fades gradually over charge cycles. The fleet management system still shows the robot operational because battery % reads correctly at full charge, but the usable runtime between charges has decreased by 25%, causing the robot to run out of power mid-mission during extended shifts.
Fleet analytics tracks charge cycle efficiency and energy consumption per mission. A robot consuming 18% more energy per mission than the fleet baseline is flagged for battery health assessment before mid-mission discharge occurs.
Transfer Point Starvation
A specific material transfer point — conveyor handoff, pallet staging area, or production line input buffer — experiences chronic AMR wait times because the receiving station is occupied or the handoff process is slower than the AMR arrival rate. Individual robots wait their turn and move on, but the cumulative material flow through that point is degraded.
Fleet analytics calculates transfer point throughput rate and average wait time per delivery. Points exceeding 3 minutes average wait time are flagged for process improvement or AMR mission rebalancing to match arrival rate to processing rate.
Navigation Drift
AMR navigation accuracy degrades gradually as wheel encoder calibration drifts, floor surface changes, or SLAM reference landmarks shift. The robot still completes its missions, but with increasing path deviation that causes it to stop and reorient, reducing travel speed and increasing congestion risk at intersections.
Fleet analytics tracks path deviation per mission per robot. Deviation exceeding 15% from the planned path triggers navigation health assessment — encoder recalibration or SLAM map update scheduled before the navigation error causes a collision or mission abort.
Wheel & Motor Wear
Drive wheel tread wears unevenly or motor bearing degrades over thousands of operating hours. The robot still moves, but with increasing vibration, higher current draw, and reduced traction that causes it to slip on smooth warehouse floors — consuming more energy and moving slower than its fleet peers.
Fleet analytics monitors motor current signature, vibration pattern, and per-mission energy consumption trend. Motor current deviation exceeding 12% from baseline triggers wheel and motor inspection work order before the degradation causes a drive system failure.
Mission Sequencing Inefficiency
The fleet management system assigns missions to the nearest available AMR, but this greedy assignment strategy creates long-term inefficiency. A robot delivering to the far end of the warehouse receives a return mission to the near end while another robot travels empty in the opposite direction — doubling total empty travel distance across the fleet.
Fleet analytics calculates empty travel distance ratio per shift. Ratio exceeding 30% triggers mission sequencing optimisation — reassigning the return leg of delivery missions to minimise total empty travel across the fleet. Typical reduction: 12-18% of total fleet travel distance eliminated.
The Digital Dashboard — What AMR Fleet Analytics Looks Like in an FMCG Warehouse
For warehouse and logistics managers, the platform delivers a single management view that aggregates fleet health, traffic congestion, mission performance, and material flow efficiency across all AMRs and warehouse zones. The design principle mirrors the one that makes production line OEE dashboards effective: the most critical constraint must be immediately visible, the financial impact must be quantified in real time, and every metric must link to the root cause and the corrective action available.
94.2%
Fleet Availability (30-Day)
Percentage of scheduled AMR operating time during which the fleet had sufficient operational robots to meet material demand. Three robots currently in yellow health status — battery degradation trend on unit AMR-12, motor current deviation on AMR-27, navigation drift on AMR-31.
4.2 min
Average Mission Cycle Time
Fleet-wide average from mission assignment to completion. Three zones above baseline: Zone C (conveyor handoff) at 6.8 min due to transfer point congestion. Rerouting recommendation active for AMR routes through Zone C intersection.
18.3 hrs
Material Idle Time Avoided (Month)
Cumulative production line and worker idle time prevented through fleet analytics-driven interventions this month. Equivalent to $87,800 in recovered labour and line utilisation value at current throughput and cost-per-idle-hour rates.
Traffic Analytics · Battery Health · Mission Monitoring · Predictive Maintenance
Your AMR Fleet Is Already Generating the Data That Eliminates Material Idle Time. iFactory's Analytics Platform Makes It Readable and Actionable at Fleet Scale.
iFactory's Robotics and Cobot Analytics Tracking platform fuses AMR fleet management data, warehouse execution system metrics, and robot-level sensor streams into a single analytics layer — identifying traffic congestion, battery degradation, navigation drift, and mission inefficiency patterns without replacing your existing fleet management infrastructure.
From Fleet Management to Fleet Analytics: The Operational Shift
The transition from AMR fleet management to fleet analytics is not primarily a technology deployment — it is an operational model change that shifts the warehouse logistics team from reactive robot troubleshooting to proactive material flow optimisation. Three structural shifts determine whether the analytics platform delivers its full material idle time elimination potential.
1
From Robot-Level to Fleet-Level Metrics
Warehouse logistics teams historically measure AMR performance at the individual robot level — missions completed per robot, uptime per robot, battery cycles per robot. The analytics shift requires adding fleet-level metrics that quantify the coordination efficiency of the entire robot population: fleet-wide empty travel ratio, intersection congestion index, transfer point throughput rate, and material flow completion percentage. Operations that adopt fleet-level metrics alongside robot-level metrics achieve 3-4x faster identification of material flow bottlenecks than those that track robot performance alone.
2
From Reactive Repair to Predictive Maintenance
AMR maintenance in most FMCG warehouses follows a reactive or fixed-interval model — robots are serviced when they fail or on a calendar schedule regardless of actual condition. Fleet analytics enables condition-based maintenance at the individual robot level: battery replacement triggered by capacity fade rate rather than cycle count, wheel replacement triggered by tread wear measurement rather than operating hours, and motor inspection triggered by current signature deviation rather than vibration threshold breach. The result is a 40% reduction in unplanned AMR downtime and a 25% extension in component replacement intervals.
3
From Static Routes to Dynamic Optimisation
Most FMCG warehouses deploy AMRs with static route maps that were established during commissioning. Warehouse layout changes, seasonal throughput variation, and production line reconfigurations gradually degrade the optimality of these routes over time. Fleet analytics continuously evaluates route efficiency against actual traffic and mission completion data, recommending route map updates when travel time on any route segment exceeds 1.3x the baseline. Operations that implement quarterly route optimisation cycles maintain AMR throughput within 5% of peak efficiency year-round.
"
We deployed 42 AMRs across our FMCG warehouse two years ago and achieved the expected labour reduction in material transport. But we hit a plateau at about 60% of the projected throughput improvement — the robots were running, the missions were being assigned, but the material flow interruptions kept happening because we were managing robots instead of managing the fleet. The fleet management system showed every robot as operational, but our OEE data showed that production line idle time due to material starvation had only improved by 34% — far below the 70% we had projected. When we deployed iFactory's fleet analytics, the first thing we discovered was that one intersection near the pallet wrapping station was generating 22 minutes of cumulative AMR wait time per hour — effectively creating a material bottleneck that no individual robot mission could route around because every route passed through that intersection. The second discovery was that three of our oldest AMRs had battery capacity fade of 28 to 32% — they were reaching low-battery charge mode two hours before the end of each shift, reducing the available fleet size during the peak shipping window. Six months of fleet analytics interventions — intersection-based traffic scheduling, battery replacement on the degraded units, and route map updates — reduced material-related idle time by 71% and pushed our overall warehouse OEE from 72% to 83%. The analytics deployment paid for itself in the first quarter through recovered production time alone.
— Director of Warehouse Operations, FMCG Distribution Centre — 42 AMRs, 280,000 sq ft Facility
Implementation Pathway — Six Weeks to Production-Grade AMR Fleet Analytics
Warehouse and logistics managers evaluating AMR fleet analytics consistently ask the same question: how long before the platform is generating actionable fleet intelligence? The implementation pathway follows a consistent structure regardless of warehouse size or AMR vendor, and does not require replacing existing fleet management or warehouse execution system infrastructure.
WEEKS 1-2
API Integration & Data Pipeline
Fleet management system API connection for robot location, mission status, battery data, and error logs. Warehouse execution system integration for material demand signals and transfer point status. AMR onboard sensor data stream connection where available. Typical integration scope completes without disrupting fleet operations.
Deliverable: Full data pipeline live with fleet data streaming.
WEEKS 3-4
Baseline & Pattern Discovery
Two-week baseline measurement period during which the platform operates in observation mode — identifying traffic congestion patterns, battery degradation trends, navigation drift signatures, and mission sequencing inefficiencies without generating alerts. Baseline report delivered at the end of week 4 with quantified improvement opportunities.
Deliverable: Baseline report with prioritised improvement opportunities.
WEEK 5+
Live Optimisation & ROI Tracking
Real-time fleet analytics alerts drive traffic rerouting, predictive maintenance scheduling, mission sequencing adjustments, and transfer point process improvements. ROI dashboard tracks material idle time reduction, fleet throughput improvement, maintenance cost savings, and overall warehouse OEE impact against baseline.
Deliverable: Live ROI dashboard with verified improvement metrics.
Conclusion
The material-related idle time problem in FMCG warehouses that operate autonomous mobile robots has a specific structure that makes it uniquely tractable to fleet analytics. The traffic congestion signal is present in the intersection wait time data before it causes production line starvation. The battery degradation signature is measurable in the energy consumption trend before it causes a mid-shift AMR failure. The mission sequencing inefficiency is quantifiable in the empty travel ratio before it degrades fleet throughput. The obstacle has never been the absence of data — the fleet management system generates thousands of data points per robot per shift. The obstacle has been the absence of an analytics architecture fast enough to correlate that data across all robots, identify the fleet-level patterns that no individual robot status reveals, and generate actionable recommendations within the operational window where intervention prevents material flow interruption.
iFactory's Robotics and Cobot Analytics Tracking platform closes that gap at every level. Real-time traffic congestion heatmaps identify intersections where cumulative AMR wait time exceeds the threshold that triggers production line starvation — before the starvation occurs. Battery health trending detects capacity fade at the individual robot level and schedules replacement during planned maintenance windows instead of emergency repair events. Navigation drift monitoring flags path deviation trends that will eventually cause mission failures and schedules recalibration before the robot requires manual recovery. Mission sequencing analytics quantifies empty travel ratio across the fleet and recommends routing adjustments that reduce total travel distance by 12 to 18% without changing a single robot's hardware.
For warehouse and logistics managers whose AMR fleets are running on fleet management systems that track individual robot status but cannot see the cross-fleet patterns that degrade material flow, the question is no longer whether fleet analytics delivers measurable material idle time reduction — the evidence base from FMCG warehouses operating comparable fleets is established. The question is what percentage of the current material-related idle time is recoverable in your specific warehouse layout and fleet configuration. Talk to an expert about a free fleet analytics assessment, or book a demo to see the platform configured for your AMR fleet data.
Frequently Asked Questions
Your AMR Fleet Data Already Contains Tomorrow's Material Flow Pattern. Schedule a Fleet Analytics Assessment to Calculate What Eliminating 60-80% of Material Idle Time Is Worth to Your FMCG Warehouse.
iFactory's Robotics and Cobot Analytics Tracking platform for AMR fleets — real-time traffic congestion heatmapping, battery health trending, navigation drift detection, mission sequencing optimisation, and predictive maintenance scheduling — all running from a single fleet analytics layer that deploys without replacing your existing fleet management infrastructure.