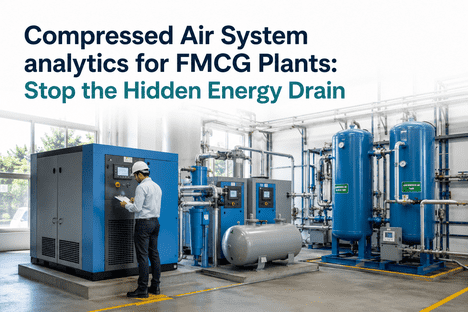
The most expensive leak in an FMCG plant is not the one that produces an audible hiss or a measurable pressure drop at the compressor discharge. It is the leak that is too small to hear, too distributed to find with a handheld detector, and too persistent to attribute to any single fitting — the aggregate leak load that, across every quick-connect coupling, pneumatic fitting, actuator seal, and section of distribution piping in the plant, can account for 25 to 35 percent of the total compressed air demand before any individual leak is large enough to trigger a maintenance work order. In an FMCG facility where compressed air typically consumes 20 to 30 percent of total plant electricity, this invisible leak load is not a maintenance inconvenience it is a continuous, compounding energy expense that adds $80,000 to $220,000 per year to the plant's electricity bill for every 100 cfm of compressor capacity installed, with no equipment failure, no production stoppage, and no quality incident to signal that the loss is occurring. For plant engineers and energy managers who suspect their compressed air system is operating below its efficiency potential, book a demo with iFactory to discover how compressed air system analytics reveals the leak load, pressure variability, dryer performance gaps, and demand-side inefficiencies that standard compressor controllers and monthly energy bills cannot detect and typically identifies 18 to 30 percent energy reduction opportunities within the first 60 days of monitoring.
Leak Analytics · Pressure Optimisation · Dryer Efficiency · Energy Baselining
FMCG Plants Cutting Compressed Air Energy Costs 18-30% Are Not Replacing Compressors They Are Applying Analytics to the Air System They Already Have.
iFactory's Energy and Sustainability Tracking platform delivers real-time compressed air system visibility leak load quantification, pressure zone analytics, dryer performance trending, and demand-side efficiency benchmarking converting compressed air from an invisible energy drain into a measurable and manageable utility cost.
25-35%
Of total compressed air demand in typical FMCG plants is consumed by undetected leaks — the single largest and most cost-effective energy reduction target
18-30%
Compressed air energy cost reduction achieved within 60 days of deploying continuous analytics-driven leak management and pressure optimisation
$80K-220K
Annual energy cost per 100 cfm of compressor capacity that can be recovered through systematic leak detection and pressure optimisation programmes
3-6 mo
Typical payback period for compressed air analytics deployment when avoided energy costs are measured against the platform investment
Why Compressed Air Energy Waste Is Structurally Invisible to Monthly Energy Bills and Compressor Controllers
Every FMCG plant that operates compressed air systems receives two data streams about the energy consumed: the monthly electricity bill that reports total kWh consumed by the compressor room, and the compressor controller display that reports current pressure, running hours, and load-unload cycles. Neither data stream can answer the three questions that determine whether the compressed air system is operating efficiently: how much of the total air demand is consumed by leaks versus productive end uses, what pressure is actually required at each point of use versus what the compressor is delivering, and how much energy is being wasted by dryers that are oversized for the actual demand or operating with dew point margins that are wider than the application requires. The monthly bill aggregates all compressor energy into a single number that includes both productive and wasted consumption. The controller optimises compressor sequencing against the discharge pressure setpoint — but the setpoint itself may be 15 to 25 psi higher than what the most demanding application actually needs, because it was set during commissioning and never reviewed against actual point-of-use pressure requirements.
The structural invisibility of compressed air energy waste is the reason that systematic energy audits of FMCG compressed air systems consistently find 18 to 35 percent energy reduction potential — every time, in every plant — and the reason that the same leaks and inefficiencies persist between audits. A monthly energy bill cannot distinguish between a compressor running efficiently at 80 percent load and one running inefficiently at 80 percent load with a 30 percent leak load consuming a quarter of its output. A compressor controller cannot detect that a refrigeration dryer with a slowly degrading heat exchanger is consuming 40 percent more energy than its design specification while still meeting the dew point target — because the dew point reading still looks acceptable even as the energy input climbs. Closing these visibility gaps requires a compressed air analytics layer that measures not just what the compressor outputs, but what the end uses consume, what the distribution system leaks, and what each component in the air treatment chain consumes in the process.
Five Levers of Compressed Air Energy Optimisation and Where Analytics Unlocks Each One
Compressed air energy efficiency in FMCG plants is determined by five interdependent levers. Each lever requires a specific measurement and analytics capability that standard compressor instrumentation cannot provide. When all five levers are optimised simultaneously through continuous analytics, the cumulative energy reduction consistently reaches 18 to 30 percent of the pre-optimisation compressed air energy spend.
1
Leak Load Quantification
Continuous leak load measurement by monitoring compressor flow during periods of zero productive demand — nights, weekends, scheduled downtime. The baseline leak load in cfm is trended over time to detect new leaks as they develop and measure the effectiveness of leak repair programmes. Plants that track leak load continuously identify and repair leaks 4 to 6 times faster than those relying on periodic leak surveys.
2
Pressure Zone Optimisation
Pressure measured at each major point of use — not just at the compressor discharge. Pressure differential across the distribution system calculated to identify sections with excessive pressure drop from undersized piping, fouled filters, or partially closed valves. Pressure reduction opportunities identified when point-of-use pressure exceeds the equipment requirement by more than 10 psi.
3
Dryer Performance Analytics
Refrigeration dryer energy consumption measured as a separate metered load. Dew point trended at dryer outlet and at each point of use to identify dryer degradation — rising dew point at constant energy input indicates heat exchanger fouling or refrigerant charge loss. Dryer purge volume tracked to identify excessive purge rates on desiccant dryers that waste 15 to 25 percent of dried compressed air.
4
Compressor Sequencing Efficiency
Specific power — kW per 100 cfm — trended for each compressor and compared against manufacturer specification and fleet baseline. Compressors operating above 110 percent of baseline specific power flagged for mechanical assessment. Load-unload cycle frequency analysed to identify systems where multiple compressors operating in parallel are cycling more frequently than necessary due to controller deadband settings that are too narrow for the demand profile.
5
Demand-Side Benchmarking
Compressed air consumption measured per production line, per shift, and per product to establish demand baselines and identify outlier consumption patterns. A line consuming 30 percent more compressed air per unit of production than the fleet average is either operating additional pneumatic equipment not accounted for in the line's standard configuration, or has a developing leak that the line operator has not yet reported.
The Compressed Air Analytics Pipeline — How Continuous Monitoring Converts Invisible Losses to Measurable Savings
The compressed air analytics engine operates as a continuous four-stage pipeline that transforms raw flow, pressure, power, and dew point data into actionable energy reduction opportunities. The output is designed for two audiences simultaneously: the plant engineer receives a ranked repair list with leak locations and cfm loss estimates, and the energy manager receives a financial summary showing kWh saved, cost avoided, and ROI-to-date for every analytics-driven intervention.
BL
Baselining & Leak Load Separation
7-day initial baseline measurement captures compressor power, flow, pressure, and dew point profiles across all operating conditions — peak production, partial load, weekend idle, and shutdown. The platform automatically separates productive demand from leak load by analysing flow during zero-production periods, establishing the baseline leak load in cfm that will be tracked for ongoing leak management.
ZD
Zone Decomposition & Pressure Profiling
Distribution system divided into pressure zones with flow and pressure sensors at each zone boundary. Pressure differential across the distribution system calculated per zone to identify sections with excessive pressure drop. Point-of-use pressure compared against minimum equipment pressure requirement to quantify the pressure reduction opportunity and the specific energy saving available per psi of reduction.
DE
Dryer Efficiency Tracking
Refrigeration dryer specific power — kW per cfm of dried air — trended against manufacturer specification and the dryer's own historical baseline. Dew point margin — the difference between actual outlet dew point and the application requirement — monitored to identify dryers operating with excessive margin that wastes energy. Desiccant dryer purge rate calculated from flow differential and compared against the manufacturer's recommended range.
CD
Compressor Degradation Detection
Specific power trended per compressor over rolling 30-day windows. Compressors with specific power increasing more than 5 percent above baseline flagged for maintenance assessment — inlet filter loading, oil separator degradation, or cooling system fouling. Load-unload cycle frequency analysed per compressor to identify sequencing optimisation opportunities.
EC
Energy Cost Attribution
Total compressed air energy cost allocated to end-use categories — productive consumption, leak load, treatment system energy, and distribution losses — updated every billing cycle. Energy manager sees a single dashboard showing the percentage of total compressed air kWh consumed by each category, the cost of each category in dollars, and the trend direction since the previous billing period.
SM
Savings Measurement & Verification
Every analytics-driven intervention — leak repair, pressure reduction, dryer adjustment, compressor service — tracked through completion with pre- and post-intervention energy measurement. Verified energy savings calculated in kWh and dollars and displayed on the energy manager dashboard with a cumulative savings-to-date total that represents the direct financial return from the analytics deployment.
Leak Load Trending · Pressure Optimisation · Dryer Efficiency · Energy Baselining
The Largest Energy Saving Opportunity in Your FMCG Plant Is Not in a Capital Project. It Is in the Compressed Air Data You Are Not Collecting.
iFactory's compressed air analytics platform delivers continuous leak load monitoring, pressure zone optimisation, dryer performance tracking, and compressor degradation detection — converting your compressed air system from an invisible energy drain into a measurable, manageable, and improvable utility.
What the Energy Manager Dashboard Shows Six Views of Compressed Air Performance
System Overview
Live Energy Dashboard With Cost Attribution
Total compressed air energy consumption displayed with real-time cost attribution — productive consumption, leak load, treatment energy, and distribution losses shown as separate categories with dollar values and percentage of total. Energy manager sees at a glance whether the energy efficiency trend is improving or deteriorating.
Leak Load
Leak Load Trend With Automated Leak Detection Alerts
Leak load in cfm trended daily with a 7-day moving average to filter out production-related variation. A leak load increase exceeding 5 percent of the baseline triggers an automated leak detection alert with an estimated cfm loss and cost impact, enabling the maintenance team to investigate before the new leak propagates.
Pressure Optimisation
Pressure Zone Map With Savings Opportunity Flags
Visual map of the compressed air distribution system showing pressure at each zone boundary. Zones where pressure exceeds the point-of-use requirement by more than 10 psi are flagged with a pressure reduction opportunity indicator and the specific energy saving available per psi of reduction.
Dryer Performance
Dryer Specific Power Trended Per Unit
Each compressed air dryer tracked individually with specific power, dew point margin, and energy consumption displayed alongside manufacturer baseline. Dryers exceeding 110 percent of baseline specific power flagged for maintenance assessment with a projected energy cost impact.
Compressor Health
Compressor-Specific Power With Degradation Alerts
Every compressor in the system tracked by specific power trend. Compressors with specific power rising above 105 percent of baseline flagged for mechanical assessment — inlet filter replacement, oil separator service, or cooler cleaning — scheduled before the degradation increases energy consumption further.
Savings & Verification
Verified Energy Savings With Cumulative ROI Tracker
Every energy-saving intervention tracked through completion with measured pre- and post-intervention energy consumption. Verified energy savings accumulated on a single ROI dashboard showing total kWh saved, total dollars avoided, and the running return on the analytics platform investment.
We operate three FMCG production lines with a centralised compressed air system feeding packaging, pneumatic conveying, and actuation across 80,000 square feet. Our annual compressed air energy cost was running at $340,000, and we had conducted leak surveys every six months like clockwork — ultrasonic detection, tagging, repair tracking. Each survey found 12 to 18 leaks, we repaired them, and the energy bill went down for about three weeks before it started climbing again. What we did not realise was that the periodic audit approach could never keep up with the rate at which new leaks were developing. Our maintenance technician was spending 40 percent of his time on leak repair, and we were still losing 28 percent of our total compressed air output to leaks. When we deployed iFactory's continuous leak monitoring, the first thing we learned was that our baseline leak load was 184 cfm — 31 percent of our total demand. The second discovery was that the leak load was not stable between surveys. It was growing at an average rate of 4.2 cfm per week from new leaks developing in the distribution system. With continuous monitoring, we catch new leaks within 24 hours of their onset, the leak load has stabilised at 62 cfm with half the maintenance effort, and our annual compressed air energy cost has dropped from $340,000 to $252,000 — a 26 percent reduction that the periodic survey approach could never have achieved because it was structurally blind to the time between audits.
— Plant Engineering Manager, FMCG Processing and Packaging Facility, 3 Production Lines — Centralised Compressed Air System
Implementation Pathway Four to Six Weeks to Production-Grade Compressed Air Analytics
Plant engineers and energy managers evaluating compressed air analytics consistently ask the same question: how long before the platform is generating actionable energy reduction recommendations? The implementation pathway follows a consistent structure regardless of plant size or compressor configuration, and does not require replacing existing compressor controllers or adding expensive metering infrastructure where flow and power measurements are already available.
WEEKS 1-2
Sensor Integration & Data Pipeline
Compressor controller connection via Modbus or BACnet for power, flow, pressure, and temperature data. Flow meter installation at key distribution branches where not already present. Dew point sensor integration at dryer outlet and critical use points. The platform ingests data from existing sensors wherever possible; new sensor installation is limited to the minimum required to establish zone-level visibility.
Deliverable: Full data pipeline live with system baselines established.
WEEKS 3-4
Baseline Measurement & Opportunity Report
7-day continuous baseline measurement captures leak load (separated from productive demand during zero-production periods), pressure zone profiles, dryer performance metrics, and compressor-specific power baselines. A prioritised opportunity report delivers estimated savings for each intervention category — leak repair, pressure reduction, dryer optimisation, compressor service — with projected kWh and dollar savings.
Deliverable: Opportunity report with quantified savings projections.
WEEK 5+
Continuous Optimisation & ROI Tracking
Live leak monitoring drives work order generation for leak repair within the same shift. Pressure reduction targets updated continuously as demand profiles shift. Dryer performance and compressor health alerts trigger preventive maintenance before energy consumption increases. ROI dashboard tracks cumulative savings with verified pre- and post-intervention measurements.
Deliverable: Live ROI dashboard with verified energy savings.
The compressed air energy waste problem in FMCG plants has a specific structure that makes it uniquely tractable to continuous analytics. The leak load is measurable every night when production stops — the cfm still flowing through the system is the leak load, and it can be quantified with a single flow meter and a time-stamped production schedule. The pressure differential across the distribution system is calculable from two pressure sensors — one at the compressor discharge and one at the furthest point of use. The dryer efficiency gap is quantifiable by comparing the dryer's actual specific power against its published specification, adjusted for the operating conditions the dryer actually experiences. The compressor degradation signature is detectable in the specific power trend — a rising kW per cfm ratio that signals inlet filter loading, oil separator degradation, or cooling system fouling before the compressor trips on a high-temperature alarm.
None of these measurements require capital-intensive instrumentation upgrades. They require connecting the sensors that many FMCG plants already have — compressor controller data, existing flow meters, building management system sensors — into an analytics platform that correlates the data streams continuously, rather than relying on monthly energy bill reviews and semi-annual leak surveys that leave the plant blind to the energy losses accumulating between measurement points.
iFactory's compressed air system analytics platform delivers continuous leak load monitoring, pressure zone optimisation, dryer performance tracking, compressor health trending, and verified energy savings measurement — converting compressed air from an invisible energy drain into a measurable, manageable utility cost that can be systematically reduced by 18 to 30 percent. Book a Demo to see the platform running on your compressed air system data, or talk to an expert about a free compressed air energy optimisation assessment for your FMCG facility.
Frequently Asked Questions
Every Day Your Compressed Air System Runs Without Analytics Is a Day You Are Paying for Energy You Cannot Measure and Cannot Manage. Get a Free Compressed Air Energy Optimisation Assessment.
iFactory's compressed air system analytics platform for FMCG plants — continuous leak load monitoring, pressure zone optimisation, dryer performance tracking, compressor health trending, demand-side benchmarking, and verified energy savings measurement — all running from a single energy analytics layer that connects to your existing compressor controllers and sensors.