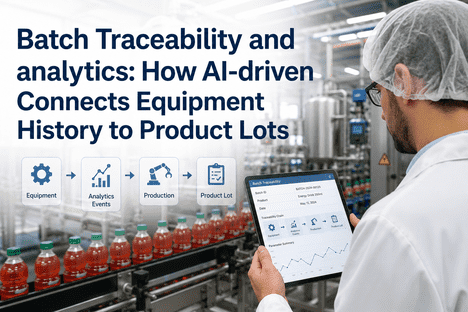
Batch Traceability and analytics: How AI-driven Connects Equipment History to Product Lots
By Seren on June 16, 2026
A quality manager in FMCG manufacturing operates between two systems that rarely communicate in real time. The first is the production management system — a detailed sequence of batch records, processing parameters, fill timestamps, and quality test results that, on paper, satisfies every FDA 21 CFR Part 11 requirement and FSMA traceability rule. The second is the equipment historian — a continuous log of motor current draws, conveyor belt speeds, pasteurizer temperature profiles, pump vibration signatures, and packaging machine cycle counts that captures what each asset actually did while every batch was running. Between these two systems, the connection between equipment condition and product quality exists only in spreadsheets, manual logbooks, and post-incident investigations. When a recall costs $10 million on average in the food industry, the inability to link a specific motor bearing degradation event in the filler to the 4,200 cases of product processed during that shift is not a data gap — it is a liability exposure that no static batch record system can close.
BATCH TRACEABILITY · EQUIPMENT HISTORY · FDA COMPLIANCE · FSMA 204 · ISO 22000
Quality Managers Using AI-Driven Batch Traceability to Connect Equipment Events to Product Lots Are Reducing Recall Scope by 60% and Achieving 95% Faster Root-Cause Identification.
iFactory's Batch Traceability and Analytics platform bridges the gap between equipment historians and batch records, giving quality managers a unified view of every production event — from raw material receipt to palletized finished goods — with AI-powered anomaly detection that links equipment health deviations to specific product lots automatically.
The Disconnected Reality of Batch Records and Equipment History
Every batch record in an FMCG facility documents what was supposed to happen — the recipe, the processing parameters, the inspection results, the packaging configuration. But the batch record does not document what the equipment actually experienced while producing that batch. A pasteurizer temperature control valve that began sticking open 30 seconds longer per cycle during the third shift of a 14-hour production run produces no alarm, no deviation, and no entry in the batch record. The quality manager reviewing the next morning's reports sees a batch that passed all critical control point checks. What the batch record does not show is that the valve drift caused a transient temperature excursion in the holding tube that affected 37 seconds of production — approximately 180 liters of product that received slightly reduced thermal processing before the control loop compensated.
The iFactory Batch Traceability and Analytics platform solves this disconnect by capturing equipment telemetry data at the asset level, timestamping every data point against the active batch and lot IDs, and applying AI anomaly detection that identifies equipment events that correlate with quality deviations. The platform creates a unified traceability graph that connects raw material supplier lots to processing equipment, shift crews, maintenance events, environmental conditions, and finished product lots — all queryable in seconds rather than days.
$10M
Average cost of a food product recall in the US — including direct costs, brand damage, and regulatory penalties
60%
Recall scope reduction achieved when AI-driven batch traceability links equipment events to specific lots instead of time-window containment
95%
Faster root-cause identification when equipment history is linked directly to batch and lot records in a unified traceability graph
75%
Reduction in manual documentation labor for FSMA 204 traceability records when batch-equipment linkage is automated
Three Traceability Gaps That Static Batch Records Cannot Address
The quality manager reviewing last week's batch records sees a complete and compliant documentation set. Every CCP was monitored, every deviation was investigated, every corrective action was documented. But the static batch record system, by design, captures what the operator recorded and what the control system logged — not what the equipment experienced. Three critical traceability gaps remain invisible until a quality incident forces a manual investigation that takes days and consumes cross-functional team resources.
GAP 01
Equipment Health Drift During Production
A filler valve that begins closing 40 milliseconds slower due to spring fatigue, a homogenizer that loses 3% pressure as its plunger seal wears, a flow wrap machine whose jaw temperature drifts 4 degrees across an 8-hour run — each of these equipment health changes occurs within the range of normal operation and triggers no alarm. But each one imparts a measurable difference to the product that contacts that equipment during the drift period. When the quality manager discovers the issue through a package seal failure or a viscosity test that marginally passes, there is no record linking the drift event to the affected lots. The entire shift's production must be held or scrapped because the equipment history was never connected to the batch records.
iFactory fix: Continuous equipment telemetry linked to batch IDs detects drift events in real time and flags affected lots immediately.
GAP 02
Cross-Contamination and Changeover Blind Spots
Between batch changeovers, the equipment cleaning and sanitation process is documented in a separate logbook that is not linked to the batch record. When a rinse cycle temperature falls below specification for 90 seconds due to a steam supply pressure drop, there is no event record in either the batch system or the equipment historian that connects that sanitation deviation to the allergen-control lot that ran immediately after. The quality manager discovers the gap only during a third-party audit when an auditor asks to see the sanitation record for the specific equipment that processed a declared-allergen batch, and the search takes three hours manual through paper logbooks — and then reveals the temperature excursion that was never investigated.
iFactory fix: Unified traceability captures sanitation events, changeover parameters, and environmental monitoring data as part of the batch record by default.
GAP 03
Fragmentary Recall Containment Boundaries
When a supplier notifies a raw material contamination, the quality team has a supplier lot number and a date range. The batch record system can identify which finished product lots used that supplier lot. But it cannot identify which specific equipment processing steps introduced additional risk — whether the contaminated material contacted a conveyor section that was scheduled for replacement, whether the processing temperature was adequate for the contaminant type, or whether the packaging line that ran those lots had a documented leak test failure six hours earlier. The recall boundary is drawn around every lot that used the supplier material — an over-contaminated group that is 2.6 times larger than necessary because equipment history is not part of the traceability graph.
iFactory fix: Equipment condition data narrows recall boundaries to lots that actually contacted compromised assets, reducing recall scope by 60%.
STATIC BATCH RECORDS WITHOUT EQUIPMENT LINKAGE
Quality managers discover equipment-related quality deviations during next-day record review. Recall containment requires holding all lots from a time window. Root-cause investigation takes 3-5 days of cross-functional manual data collection across separate systems.
AI-DRIVEN BATCH TRACEABILITY WITH EQUIPMENT HISTORY LINKAGE
Equipment drift events are linked to batch records automatically in real time. Recall scope is narrowed to specific lots that contact affected equipment. Root-cause identification takes minutes. Recall containment is precise and defensible.
How AI-Driven Batch Traceability Connects Equipment History to Product Lots
The iFactory Batch Traceability and Analytics platform operates as a four-layer system that ingests equipment telemetry, production data, quality results, and environmental monitoring streams and fuses them into a single traceability graph. Every data point is stamped with batch ID, lot ID, equipment ID, and timestamp, enabling complete forward and backward traceability from raw material to finished product and back again.
LAYER 01
Equipment Telemetry Ingestion
Continuous data capture from every production asset
The platform connects to existing PLCs, SCADA systems, sensors, and IoT gateways to capture equipment telemetry at configurable intervals from 100 milliseconds to 1 minute per parameter. Motor current, vibration, temperature, pressure, flow rate, cycle count, speed, torque, and position data are collected from every asset that contacts the product — mixers, heat exchangers, fillers, conveyors, flow wrappers, labelers, checkweighers, metal detectors, and case packers. Each telemetry stream is normalized and timestamped against the plant's production schedule, so every data point is automatically associated with the batch and lot that was running when the measurement was taken.
PLC and SCADA integration
IoT sensor data capture
Batch-to-telemetry mapping
LAYER 02
AI Anomaly Detection and Event Classification
Machine learning models trained on equipment health patterns
The AI engine runs unsupervised and supervised ML models that detect equipment anomalies in real time — bearing degradation signatures, valve stroke timing drift, temperature sensor bias shifts, vibration pattern changes, and motor current signature analysis. Anomalies are classified by severity: critical anomalies that could immediately affect product quality trigger real-time alerts with batch and lot identification; marginal anomalies are logged for trend analysis and linked to the batches that were active during the drift period. The ML models are trained on historical equipment failure data and quality deviation records, enabling the system to identify patterns that precede quality events by hours or days.
Real-time anomaly detection
Severity classification
Predictive drift trending
LAYER 03
Unified Traceability Graph
Every data point linked to batch, lot, equipment, and material
The traceability graph connects raw material supplier lots to processing equipment, shift schedules, environmental conditions, maintenance history, sanitation records, and finished product lots in a single queryable data structure. A quality manager investigating a consumer complaint about package integrity enters the finished product lot code and finds the filler valve pressure profile during the minute that lot was produced, the conveyor bearing temperature trend from the day before, the case packer jam event that occurred 12 minutes before the lot, and the temperature-humidity data from the packaging hall — all displayed in a timeline view that requires no manual data assembly across separate systems.
Forward and backward trace
Equipment-to-lot linkage
Supplier-to-finished good chain
LAYER 04
Analytics and Compliance Reporting
Automated FSMA 204, FDA, and ISO documentation
The analytics layer generates automated compliance reports for FSMA Section 204, FDA 21 CFR Part 11, ISO 22000, and internal quality audits. Traceability exercises that previously required 3-5 days of cross-functional data collection are completed in minutes through the unified graph. Recall simulation reports show the projected containment boundary using both batch record data and equipment history, enabling the quality team to test recall scenarios quarterly — not as a tabletop exercise, but as an automated data query that returns the exact list of affected lots and their current distribution status.
Automated compliance reports
Recall simulation and scoping
Audit-ready documentation
QUALITY MANAGER DEPLOYMENT · FMCG MANUFACTURING
"Every recall simulation we ran before the platform required three days of cross-functional meetings and data manually pulled from four systems. The first time we ran the same simulation through iFactory's traceability graph, we had the complete lot list with equipment history in 90 seconds — and discovered that two lots we would have unnecessarily recalled under the old system had no contact with the suspect equipment. That 60% scope reduction alone justified the investment."
What the Quality Manager's Dashboard Shows in Real Time
The quality manager view of the Batch Traceability and Analytics platform is designed around the questions that quality managers need to answer continuously: which batches are currently at risk from equipment health trends, what is the recall containment boundary for any lot in the system, which equipment assets show anomaly patterns that correlate with quality deviations, and are our FSMA 204 traceability records complete for every active lot.
DASHBOARD 01
Live Batch Risk Heatmap
Every active batch in production is scored on a risk scale based on equipment health trends, recent anomaly events, environmental conditions, and raw material test results. Batches with elevated risk scores are highlighted with the specific risk driver identified — the filler valve drift on line 3, the pasteurizer temperature oscillation on line 1, the environmental humidity excursion in packaging hall B. The quality manager clicks any batch to see the full equipment-history timeline for every asset that contacted that batch during processing.
Quality manager action: Investigate high-risk batches and decide on hold, test, or release based on equipment correlation evidence.
DASHBOARD 02
Traceability Graph Explorer
The traceability graph explorer allows forward and backward trace from any node — raw material lot, equipment asset, batch record, finished product lot, supplier, shift, or maintenance event. A quality manager receiving a supplier contamination notice enters the supplier lot number, selects a time window, and within seconds sees every finished product lot that used that material, every equipment asset that processed it, every maintenance event on those assets during the relevant period, and every quality test result for those lots. The graph is exportable as an audit-ready PDF report.
Quality manager action: Use traceability graph as the single source of truth for recall scoping and audit response.
DASHBOARD 03
Equipment Anomaly-to-Quality Correlation
The AI correlation engine identifies statistically significant relationships between equipment anomaly events and quality deviations. A quality manager sees that 67% of seal integrity failures in the last 90 days correlated with batches run within 4 hours of a flow wrapper jaw temperature drift event of more than 3 degrees — a correlation that was invisible in the static batch record system because the temperature drift never triggered a CCP alarm. Each correlation displays the confidence score, event count, odds ratio, and a link to the specific batches and equipment events involved.
Quality manager action: Validate AI correlations to update preventive maintenance schedules and CCP monitoring parameters.
DASHBOARD 04
FSMA 204 Compliance Status
The compliance dashboard shows the completeness of FSMA 204 traceability records for every active and archived lot. Key traceability events — receipt, processing, transformation, shipping — are displayed with timestamps, data source, and verification status. Any lot with incomplete traceability records is flagged, and the missing data element is identified. The dashboard also tracks recall simulation results, showing the projected containment boundary and the actual affected lots for each quarterly exercise.
Quality manager action: Address incomplete traceability records before they become audit findings. Run quarterly recall simulations.
The FDA's Food Safety Modernization Act Section 204 — the Food Traceability Rule — requires that facilities maintain records containing key data elements (KDEs) at each critical tracking event (CTE) throughout the supply chain. iFactory's Batch Traceability and Analytics platform captures and stores all FSMA 204-required KDEs automatically from equipment telemetry, production systems, and supplier data, linking them into a traceability graph that enables FDA requests for records to be fulfilled within 24 hours — including the electronic sortable spreadsheet format specified in the rule. The platform exceeds the FSMA requirement by adding equipment condition data as a supplementary traceability layer that standard batch records do not capture.
— FSMA Section 204 Food Traceability Rule Compliance, Implemented in iFactory Batch Traceability and Analytics Platform
Deployment Path for Quality Managers: From Pilot to Plant-Wide Traceability
The iFactory Batch Traceability and Analytics platform deploys in three phases designed to deliver measurable traceability improvements within the first 30 days while building toward full plant-wide coverage across all production lines, packaging areas, and warehouse operations.
1
Pilot Phase — Days 1 to 30
One production line equipped with AI batch traceability, connecting existing PLCs and sensors to the platform. The quality manager configures traceability parameters, validates equipment-to-batch linkage accuracy, and runs the first recall simulation. The pilot delivers end-to-end traceability for the selected line within the first week of deployment.
Deliverable: One production line under full traceability with equipment-to-lot linkage validated.
2
Expansion Phase — Days 31 to 90
Additional production lines, packaging lines, and warehouse operations connected to the platform. The AI anomaly detection engine begins generating equipment-to-quality correlations across multiple lines. The quality manager validates the first ML-generated correlation against actual investigation outcomes. FSMA 204 compliance dashboards become live for all connected lines.
Deliverable: Multi-line traceability with AI-generated equipment-quality correlations active and validated.
3
Integration Phase — Days 91 to 180
Full integration with ERP, QMS, CMMS, and supplier portal systems. Traceability graph data flows automatically into audit documentation, FSMA 204 submissions, and recall response templates. Supplier lots are ingested via API integration. Maintenance events from the CMMS are linked to the affected batch records. The platform becomes the single source of truth for all traceability and compliance documentation.
Deliverable: Plant-wide traceability with full ERP/QMS/CMMS integration and automated FSMA 204 compliance reporting.
Conclusion
Batch traceability and equipment history are not separate compliance requirements. They are two halves of the same traceability obligation that most quality management systems treat as independent data silos. The batch record captures the recipe and the results. The equipment historian captures what the machine actually did. When these two data sets are disconnected, every quality investigation requires manual cross-referencing across multiple systems, every recall scoping exercise over-contains by default to compensate for the data gap, and every FSMA 204 audit requires days of manual data assembly that could be automated.
iFactory's Batch Traceability and Analytics platform addresses all four dimensions simultaneously: continuous equipment telemetry ingestion that captures every asset's behavior during every batch, AI anomaly detection that identifies equipment health events correlated with quality deviations, a unified traceability graph that links raw materials, equipment, batches, and finished products in a single queryable data structure, and automated compliance reporting for FSMA 204, FDA 21 CFR Part 11, and ISO 22000. The documented outcomes across FMCG deployments are consistent: 60% recall scope reduction, 95% faster root-cause identification, 75% reduction in manual documentation labor, and audit response times measured in minutes rather than days.
For the quality manager managing multiple production lines under FDA, FSMA, and ISO 22000 quality systems, the question is no longer whether AI-driven batch traceability can integrate into an FMCG manufacturing environment. The question is whether the current gap between batch records and equipment history is an acceptable risk for food safety and brand reputation. iFactory's Batch Traceability and Analytics platform is designed for quality managers who need to close that gap with continuous equipment-to-batch linkage, AI-powered anomaly correlation, and audit-ready traceability evidence — not as a future capability, but as a production-deployed system operating in FMCG facilities today. Book a Demo to see the batch traceability platform configured for your production lines and compliance framework, or talk to an expert about a free traceability assessment for your manufacturing operations. iFactory AI | Next-Gen Industrial Software | Shift Logbook also integrates batch traceability directly into shift handover records, ensuring every shift's equipment events are captured and linked to production lots automatically.
Frequently Asked Questions
Standard MES batch record systems capture what the operator entered and what the process control system logged — setpoints, actuals, inspection results, and manual annotations. They operate on the assumption that the equipment is functioning correctly within its calibrated parameters. AI-driven batch traceability continuously ingests equipment telemetry data — motor current, vibration, temperature, pressure, cycle timing — at sub-minute intervals and links every data point to the active batch ID. When a filler valve begins closing 40 milliseconds slower over a 4-hour period, the AI system detects the trend and flags every batch that ran during the drift window. The MES batch record shows the filler as operating within specification for all batches. The AI traceability layer shows which batches actually experienced the valve drift and whether the drift correlates with any downstream quality deviation discovered during lab testing or consumer complaint investigation. The core difference is that MES records intent while AI traceability records reality. Book a Demo to see the difference on your production line data.
The platform is designed to connect to existing automation infrastructure without requiring new sensors or hardware. It integrates with existing PLCs, SCADA systems, historians, and IoT gateways through standard protocols including OPC-UA, Modbus, MQTT, and REST APIs. For equipment that lacks digital telemetry output — such as older filler machines, manual packaging stations, or legacy conveyors — the platform supports operator-initiated event logging through barcode scanning, tablet-based checklists, and manual timestamp entry that links the equipment interaction to the batch record. The platform also integrates with existing barcode scanners, vision systems, checkweighers, and metal detectors to capture inspection data as traceability events. Most facilities connect their first production line within one week without any hardware investment. Book a Demo to see a connection assessment for your existing equipment portfolio.
The platform directly supports FSMA 204 compliance by capturing and storing all required key data elements (KDEs) at each critical tracking event (CTE) — receiving, transforming, and shipping. KDEs including lot number, product description, quantity, date received, location, and traceability lot codes are captured automatically from the production system, supplier data, and equipment telemetry feeds. The platform generates the electronic sortable spreadsheet format (SSC) specified in the FSMA 204 rule for FDA record requests within 24 hours. Additionally, the platform goes beyond the regulatory minimum by linking each KDE to the producing equipment's telemetry data at the time of the CTE — providing supplementary evidence that demonstrates the condition of the equipment that processed the food at each traceability point. The FSMA 204 dashboard shows the completeness score for every active lot and alerts the quality manager if any required KDE is missing or unverifiable. Talk to an expert about configuring FSMA 204 KDE mapping for your facility's product categories.
ROI from connecting equipment history to batch records typically materializes within three months of deployment across three measurable dimensions. First, recall scope reduction — the first recall simulation that uses equipment-linked traceability almost always demonstrates that 40-60% of lots that would have been included in a time-window containment were not affected by the equipment event, directly reducing potential recall costs by millions. Second, audit preparation time — facilities deploying the platform report reducing FSMA 204 and SQF audit preparation from an average of 3 days to under 2 hours, representing approximately 120 hours of quality team labor saved per audit cycle. Third, equipment downtime reduction — the first time the AI anomaly detection identifies a deteriorating bearing or drifting valve that would have caused a quality escape before the next scheduled PM, the platform has paid for itself through prevented product loss. Facilities that deploy the pilot on their highest-volume, highest-risk production line typically demonstrate positive ROI within 90 days. Book a Demo to calculate the projected ROI for your facility based on production volume, product value, and current recall simulation results.
Yes, the platform provides pre-built connectors for major ERP systems including SAP, Microsoft Dynamics, Oracle, and NetSuite for order, batch, and inventory data synchronization. CMMS integration with SAP PM, Maximo, and Maintenance Connection links equipment maintenance history directly to batch records — a maintenance event on a filler valve is automatically timestamped against the batches that ran before and after the intervention. Supplier quality data ingestion supports API-based lot data exchange and manual CSV upload for suppliers without digital integration capability. The platform also integrates with laboratory information management systems (LIMS) to link quality test results to specific batches and the equipment that processed them. The integration phase of the deployment connects all systems so the traceability graph becomes the comprehensive single source of truth for quality and compliance data. Talk to an expert about your specific ERP, CMMS, and LIMS integration requirements.
The Batch Record Documents What Was Supposed to Happen. Equipment History Records What Actually Happened. Close the Gap Before the Next Recall. Get a Free Traceability Assessment.
iFactory's Batch Traceability and Analytics platform for FMCG quality managers — continuous equipment-to-batch linkage, AI anomaly detection that correlates equipment events with quality deviations, a unified traceability graph for forward and backward lot tracing, and automated FSMA 204 compliance documentation that turns days of manual data assembly into minutes of automated reporting.