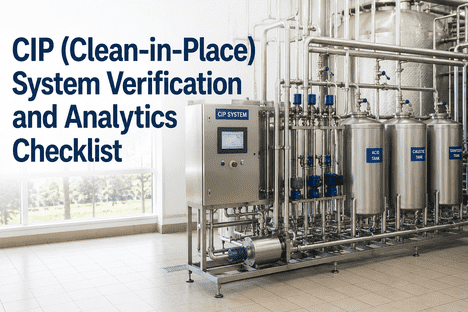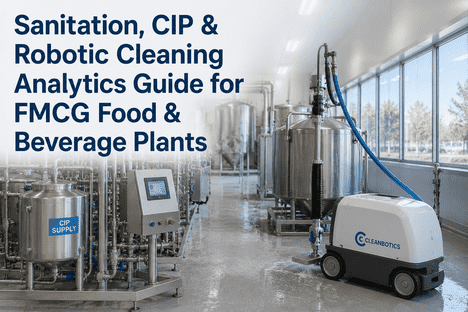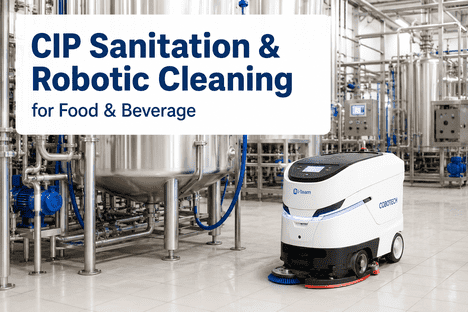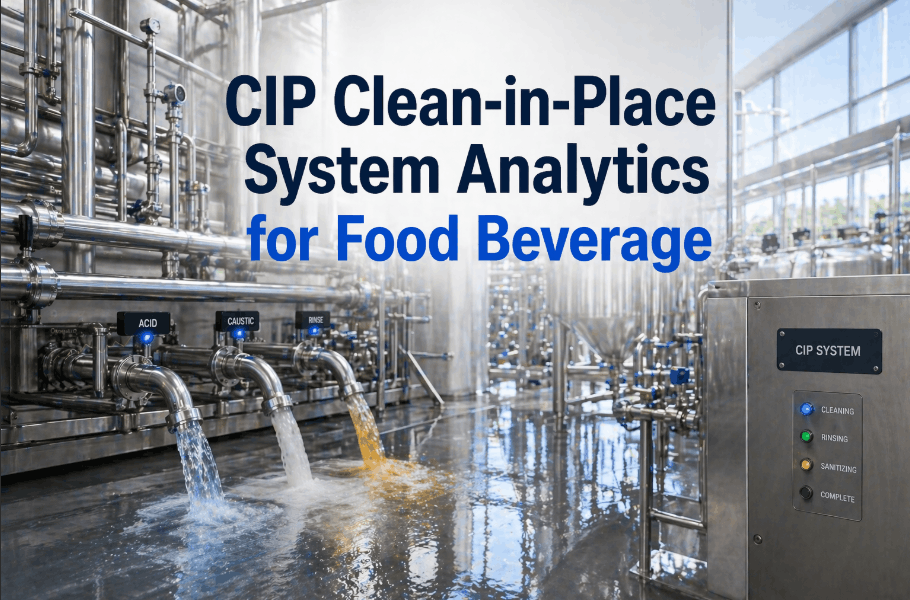
Clean-in-Place systems are the most critical sanitation infrastructure in any food and beverage processing facility — yet most plants still manage CIP cycles using static time-temperature-concentration recipes developed during process commissioning, with sanitation effectiveness verified by periodic ATP swab tests and end-of-cycle visual inspections that cannot detect the slow buildup of biofilm, the gradual fouling of spray devices, or the drift in caustic concentration that transforms a validated sanitation cycle into a food safety risk over months of operation. As food safety regulations tighten and consumer expectations for contamination-free products rise, quality and sanitation teams that book a demo with iFactory are discovering that they can predict CIP effectiveness degradation 3 to 5 cycles in advance and reduce sanitation-related production downtime by up to 35% through AI-powered CIP analytics that fuses flow data, conductivity trends, temperature profiles, and ATP hygiene data simultaneously.
Why CIP Analytics Requires a fundamentally Different Approach from Production Process Monitoring
The analytical challenge in a Clean-in-Place system is structurally different from monitoring a continuous production process — and applying production monitoring methodologies to CIP operations produces incomplete, often misleading conclusions about sanitation effectiveness. In a production process, the key parameters — temperature, pressure, flow rate, fill level — are relatively stable during steady-state operation, and deviations from setpoint typically indicate equipment malfunction or material supply issues that are immediately visible to operators. In a CIP system, every parameter is intentionally dynamic: the cycle progresses through pre-rinse, caustic wash, intermediate rinse, acid wash, and final rinse stages, each with different target temperatures, flow rates, and chemical concentrations. The sanitation effectiveness depends not on any single parameter meeting its target, but on the sequence, duration, and interaction of all parameters across the complete cycle — and this multivariate interaction is where most CIP failures originate.
This dynamic, multi-stage nature of CIP means that meaningful sanitation analytics must operate at the individual cycle and circuit level — analyzing not just whether each stage met its minimum time and temperature, but whether the temperature profile during the caustic stage achieved the required surface contact energy, whether the flow velocity was sufficient to maintain turbulent flow at every point in the circuit, and whether the rinse stages removed chemical residues to below detectable thresholds. iFactory's CIP analytics engine ingests data at the individual cycle resolution, linking each stage's flow, temperature, conductivity, and turbidity profile to the post-cycle ATP hygiene verification and microbiological test results. The result is a causal chain from CIP cycle parameters to sanitation outcomes that identifies, for example, that recurring ATP failures on a specific holding tank are caused by caustic concentration dropping below 2.0% during the last three minutes of the wash stage — a finding that average concentration monitoring would never surface. Quality assurance teams exploring this approach often find it valuable to book a demo to see how iFactory's cycle-level analytics integrates with existing CIP controllers and laboratory data.
- CIP effectiveness verified by end-of-cycle ATP swab — contamination risk unknown during the cycle itself
- Cleaning recipes based on original process validation — no adjustment for seasonal fouling variation or equipment aging
- Spray device performance assumed adequate if flow rate is within range — no detection of localized fouling or clogging
- Chemical concentration measured at tank outlet — concentration at the return line assumed to match without accounting for chemical consumption during the cycle
- CIP cycle duration fixed regardless of soil load — over-cleaning wastes water and chemicals, under-cleaning creates food safety risk
- Sanitation records stored as PDF printouts — trend analysis across cycles requires manual data extraction from paper logs
- Real-time cycle effectiveness prediction — ATP result forecasted from flow, temperature, and concentration profile before the cycle ends
- AI-optimized cleaning recipes per circuit — cycle parameters adjusted automatically based on soil load, elapsed time since last clean, and seasonally varying fouling patterns
- Spray device performance quantified per cycle — individual spray nozzle flow deviation detected and mapped to specific device for maintenance targeting
- Chemical concentration tracked at supply and return — actual chemical consumption calculated per cycle, identifying when concentration drops below effective threshold at the point of soil contact
- Cycle termination triggered by cleaning completion, not timer — conductivity and turbidity profiles determine when surfaces are clean, reducing average cycle duration by 15 to 25%
- Complete digital sanitation trail — every CIP cycle recorded with full parameter traceability for audit, trend analysis, and continuous improvement across the entire installed base
Core CIP Monitoring: Flow, Temperature, Concentration, and Contact Time
Four interconnected parameters define the sanitation effectiveness of every CIP cycle: flow velocity, temperature profile, chemical concentration, and contact time. These parameters are not independent — flow velocity determines the heat transfer coefficient that affects temperature maintenance, temperature affects chemical reaction rate and therefore the effective concentration at the soil surface, and all three parameters together determine the contact time required to achieve microbiological kill. iFactory's CIP analytics monitors all four parameters simultaneously at sub-second resolution across every stage of every cycle, providing the integrated view that single-parameter trending cannot deliver.
Spray Device Performance Analytics: The Most Overlooked CIP Failure Mode
Spray device degradation is the single most common root cause of CIP effectiveness failures in food and beverage plants — and the most frequently missed because conventional CIP monitoring focuses on supply-side parameters that remain normal even when spray devices are no longer delivering adequate surface coverage. A spray ball with one or two clogged nozzles still passes the design flow rate within the acceptable range, but the spray pattern is distorted, leaving localized areas of the vessel surface without direct chemical contact. A spray device whose bearing has worn from years of thermal cycling still rotates, but at a reduced speed that changes the overlap pattern and creates unwashed stripes on the vessel wall. These conditions can persist for weeks or months — accumulating biofilm in the unwashed zones until a routine ATP swab finally detects the contamination, triggering a costly root cause investigation that could have been avoided with spray device performance analytics.
Sanitation Compliance and Audit Trail Automation
Food and beverage processing facilities operate under some of the most stringent regulatory frameworks in manufacturing — FDA 21 CFR Part 117 (FSMA), USDA HACCP requirements, SQF certification standards, and BRC Global Standards for Food Safety — all of which require documented evidence that CIP systems are operating within validated parameters and producing consistently hygienic surfaces. The manual approach to compliance — printing CIP cycle data to PDF, filing by date, and manually correlating cycle parameters with laboratory results during audit preparation — is not only labor-intensive but structurally incapable of detecting the slow parameter drifts that precede a sanitation failure. A caustic concentration that has drifted from 2.5% to 2.1% over six months may still appear compliant on any individual day's data — but the cumulative effect on cleaning effectiveness across 400 cycles is a measurable increase in ATP failure rate that the manual review process will not identify until the next quarterly trend analysis.
iFactory's Compliance and Audit Trail Management module captures every CIP cycle parameter at native resolution, stores it in an immutable audit trail, and applies automated trend analysis that compares current cycle performance against validated parameters and historical baselines. The platform generates compliance dashboards organized by regulatory framework — FSMA, SQF, BRC, GFSI — showing at a glance which circuits are operating within validated ranges and which have parameter trends that require investigation before they drift outside the validated envelope. Audit preparation that once required days of paper log compilation is reduced to a few clicks, with all required documentation — cycle parameters, trend analysis, deviation investigations, corrective actions — available in a single export that maps directly to each audit requirement. Sanitation and quality managers preparing for regulatory audits can book a demo to see how iFactory's automated compliance reporting maps to their specific audit framework.
| Compliance Framework | iFactory Automation Capability | Documentation Delivered | Audit Relevance | Manual Effort Eliminated |
|---|---|---|---|---|
| FSMA 21 CFR Part 117 | Automated sanitation monitoring and preventive control documentation for each CIP circuit | Cycle parameter records, trend analysis, deviation alerts, corrective action closure | Direct | 8–12 hours per audit cycle |
| SQF Food Safety Code | Sanitation effectiveness monitoring with element-level mapping to SQF requirements | Cleaning schedule compliance, ATP trend analysis, chemical concentration validation | Direct | 12–18 hours per audit cycle |
| BRC Global Standard | Cleaning and sanitation records with full traceability and deviation management | Cleaning schedule adherence, hygiene monitoring trends, CIP effectiveness reports | Direct | 10–15 hours per audit cycle |
| GFSI Benchmarking | Cross-framework compliance reporting with GFSI benchmark mapping | Unified compliance dashboard with gap analysis against GFSI requirements | Supporting | 6–10 hours per audit cycle |
| USDA HACCP | Sanitation SOP execution monitoring with critical control point integration | Sanitation CCP records, corrective action logs, verification activity reports | Direct | 8–14 hours per audit cycle |
| FDA Food Code | Chemical sanitization monitoring with concentration, temperature, and contact time tracking | Sanitizer concentration logs, temperature monitoring records, contact time verification | Supporting | 4–8 hours per audit cycle |
Predictive Maintenance Integration for CIP Infrastructure
The balance-of-plant equipment supporting a CIP system — pumps, heat exchangers, spray devices, valves, flow meters, and chemical dosing systems — accounts for a disproportionate share of CIP reliability events, particularly as installations age beyond year five. The CIP chemical delivery system itself rarely fails catastrophically; the failures that take a CIP skid offline for hours or days are typically failures in the pump seals, heat exchanger plates, or control valves that degrade gradually before failing. iFactory's predictive maintenance integration applies condition monitoring analytics to each of these supporting systems, shifting maintenance strategy from calendar-based to condition-based at the equipment level that has the greatest impact on CIP availability and sanitation reliability.
| CIP Asset | iFactory Monitoring Parameters | Failure Mode Detected | Warning Lead Time | Estimated Avoided Cost / Event |
|---|---|---|---|---|
| CIP Supply Pump | Pump motor current signature, discharge pressure, mechanical seal temperature, vibration | Seal wear, impeller erosion, bearing degradation, cavitation onset | 10–30 days | $25,000–$65,000 |
| CIP Heat Exchanger | Supply/return temperature differential, steam or hot water flow rate, pressure drop across exchanger | Plate fouling, gasket degradation, thermal performance degradation, bypass leakage | 7–21 days | $18,000–$45,000 |
| Chemical Dosing System | Dosing pump stroke rate, chemical tank level trend, concentration setpoint vs actual deviation | Dosing pump check valve wear, injection nozzle clogging, concentration sensor drift | 5–14 days | $12,000–$35,000 |
| CIP Control Valve | Valve position feedback deviation, actuation time, seat leakage temperature signature | Seat wear, actuator diaphragm degradation, positioner calibration drift | 5–18 days | $8,000–$22,000 |
| Flow Meter / Conductivity Sensor | Measurement drift trend, calibration deviation, signal noise analysis | Sensor fouling, electrode degradation, calibration drift, signal cable degradation | 3–10 days | $5,000–$15,000 |
| Spray Device Assembly | Return flow signature, pressure drop trend, rotation frequency (for rotating devices) | Nozzle clogging, bearing wear, swivel joint degradation, structural damage | 10–30 days | $15,000–$40,000 |
Expert Perspective: What AI Analytics Changes in CIP and Sanitation Operations
We operate a dairy processing facility with 42 CIP circuits supporting pasteurizers, separators, evaporators, and storage tanks across three production lines. Our sanitation team followed validated cleaning recipes — caustic at 2.5% for 20 minutes at 75°C, acid at 1.0% for 10 minutes at 65°C — and our ATP pass rate averaged 94%, which was considered acceptable for our regulatory compliance. When we deployed iFactory's CIP analytics, the first discovery was that our four evaporator circuits were consuming caustic at 3.1 to 3.5% per cycle — well above the 2.5% target — because the dosing pump calibration had drifted over two years of operation and the conductivity sensor had developed a +0.4% offset that made the concentration appear correct at the supply line while the actual concentration at the return line was significantly higher. The second discovery was more valuable: we identified that the pasteurizer CIP circuit was experiencing a temperature drop of 8°C between the supply and return during the caustic stage — caused by a partially fouled heat exchanger that was degrading thermal performance. The temperature at the return line was only 67°C during the critical middle portion of the caustic stage, well below the 75°C target and below the minimum temperature required for effective saponification of milk fat residues. The corrective action — cleaning the heat exchanger plates — restored the return temperature to 73°C and improved the ATP pass rate on that circuit from 88% to 97% in the following month. The chemical cost savings from recalibrated dosing alone paid for the analytics deployment in the first quarter.
Frequently Asked Questions: CIP and Sanitation Analytics
At minimum, iFactory requires access to the CIP controller or PLC data stream — which in most food and beverage processing installations contains flow rate, temperature, conductivity, and stage sequence data for each CIP circuit. This is sufficient to begin flow velocity analysis, temperature profiling, chemical concentration tracking, and stage duration monitoring. For full effectiveness analytics — linking cycle parameters to sanitation outcomes — iFactory additionally connects to the laboratory information management system where ATP swab results and microbiological test data are recorded. Integration with major CIP controller platforms — including Alfa Laval, Tetra Pak, GEA, and Siemens-based control systems — is typically completed in 2 to 4 weeks without operational disruption. A data readiness assessment is available at no cost to determine the specific analytics scope your current infrastructure supports.
iFactory's CIP effectiveness model is soil-type aware at the architecture level. For each CIP circuit, the platform maintains a soil-type profile that encodes the cleaning difficulty associated with the specific product processed in that vessel — dairy protein films require different caustic concentration and temperature than fruit sugar caramelization deposits, and vegetable oil residues require different saponification conditions than starch gelatinization residues. The model incorporates the soil type as a factor in the effectiveness calculation, adjusting the expected cleaning energy required for each cycle based on the product processed in the preceding batch. For plants that process multiple products in the same vessel — common in multi-purpose food processing facilities — iFactory automatically selects the appropriate soil profile based on the production schedule integration, ensuring that the CIP analytics always reflect the actual cleaning challenge rather than a generic default profile.
Yes — iFactory's analytics platform is designed to support the full spectrum of CIP automation levels, from fully automated multi-circuit CIP skids to semi-automated and even manual cleaning operations. For manual CIP setups — where operators connect hoses, open manual valves, and initiate cleaning stages from a local panel — iFactory captures cycle data from portable flow meters, clamp-on temperature sensors, and conductivity probes that can be installed without CIP system modifications. The platform provides operator guidance through the sanitation workflow via mobile interface — displaying stage instructions, target parameters, and real-time feedback during manual cycles, and recording all cycle data to the compliance audit trail automatically. This capability is particularly valuable for plants transitioning from manual to automated CIP, as it provides the data foundation for future automation design while delivering immediate analytics value from the existing manual process.
Chemical concentration is one of the most critical and most commonly mis-measured parameters in CIP operations. iFactory addresses this through a multi-modal concentration tracking approach that combines conductivity-based concentration estimation, dosing pump stroke count integration, and periodic titration verification data. The platform compares the conductivity-derived concentration at the supply and return lines — a significant difference between supply and return concentration indicates chemical consumption by soil load, chemical degradation due to high temperature, or a dosing accuracy issue upstream. When the supply-to-return concentration difference exceeds the expected range for the soil type and cycle stage, iFactory generates a dosing accuracy alert with diagnostic guidance — check valve inspection, calibration verification, or concentration sensor cleaning. The platform also tracks cumulative chemical consumption per circuit per production day, enabling chemical cost allocation to specific products and processes that traditional bulk chemical purchasing cannot provide. Sanitation managers interested in chemical consumption optimization can book a demo for a personalized assessment of their current dosing accuracy.
iFactory's CIP analytics deployments typically reach full cost recovery within 8 to 14 months of deployment, with the fastest payback cases occurring when the platform identifies a high-frequency chemical over-consumption pattern in the first 30 days that, once corrected, reduces chemical costs by 20 to 35% while maintaining or improving sanitation effectiveness. For a mid-size food processing plant operating 30 CIP circuits with an annual chemical spend of $280,000 and a water/wastewater cost of $180,000, reducing chemical consumption by 25% through AI-optimized dosing and cutting water usage by 20% through turbidity-based stage termination represents approximately $115,000 in annual operational savings. When combined with the value of avoided sanitation failures — a single product contamination event in a food processing plant carries a direct cost of $150,000 to $500,000 in product recall, line downtime, and regulatory investigation — the total ROI accelerates significantly. An ROI modeling session using your plant's specific CIP configuration and operational economics is available at no cost.
Conclusion: The Analytics Layer Your CIP and Sanitation Operation Is Missing
The gap between what a CIP system's design validation promises and what it actually delivers on any given day is a data problem before it is a cleaning chemistry problem. Circuits that could complete their cleaning cycle in 30 minutes instead of 45 are running the full duration because no one has reviewed the turbidity decay profile that shows the surface was clean at 28 minutes. Chemical concentration that has drifted 0.4% below the validated minimum is delivering ineffective cleaning — but the daily log shows concentration within the acceptable range because the supply-side sensor reads high while the return-side concentration tells the real story. Spray devices that have been delivering inadequate coverage for months are assumed to be functioning normally because the supply flow rate is within specifications — while the return flow signature reveals the clogged nozzles that are leaving unwashed zones on every cycle. These are solvable problems — and they are solvable with the data that most CIP controllers are already generating, once that data is collected across all circuits, analyzed at the right resolution, and acted on with the speed that AI-powered analytics makes possible.
iFactory's CIP and sanitation analytics platform brings cycle-level flow monitoring, temperature profiling, concentration tracking, spray device performance analysis, and automated compliance documentation to food and beverage processing operations that have been managing these parameters in isolation. The result is a sanitation operation that cleans more effectively using fewer chemicals and less water, maintains compliance with documented evidence for every audit, and catches spray device degradation and parameter drift before they become contamination risks — with no new capital equipment and no production disruption required to begin. The data is already flowing through your CIP controllers. The analytics just needs to be applied to it.