CIP (Clean-in-Place) System Verification and analytics Checklist

By Seren on June 19, 2026

cip_clean_in_place_system_verification_analytics_checklis-url.png_optimized_300

Clean-in-Place systems are the backbone of sanitation in food, beverage, dairy, and pharmaceutical processing facilities. The 3-A Sanitary Standards and the FDA Food Safety Modernization Act require that CIP systems be designed, operated, validated, and documented to consistently achieve a defined level of cleanliness on product contact surfaces without disassembly of the processing equipment. A systematic CIP verification and analytics checklist — covering chemical concentration, flow rate, temperature, contact time, mechanical action, return solution conductivity, equipment integrity, and documentation — provides the audit framework that sanitation supervisors, quality assurance teams, and maintenance engineers use to verify that every CIP cycle delivers the specified cleaning result. Facilities that implement this checklist and act on the analytical findings consistently achieve 99.5 percent or higher microbiological cleaning validation passes, reduce chemical and water consumption by 15 to 30 percent, extend CIP circuit equipment life by 3 to 5 years, and maintain a complete audit trail for every cleaning cycle that satisfies regulatory and third-party certification requirements.

Chemical Concentration · Flow Rate · Temperature · Contact Time · Conductivity · Equipment Integrity · Audit Trail
CIP (Clean-in-Place) System Verification and Analytics Checklist for Food & Beverage Plants
Complete verification framework covering chemical dosing accuracy, flow rate verification, temperature profiling, contact time compliance, return solution analytics, mechanical action validation, equipment integrity inspection, and automated compliance documentation for CIP systems.
99.5%
Microbiological CIP validation pass rate achievable with systematic verification and analytics-based corrective action programs
15-30%
Reduction in chemical and water consumption through CIP analytics optimization and cycle performance tracking
3-5
Years of additional service life for CIP circuit piping, valves, and heat exchangers under predictive analytics-based maintenance
100%
Audit trail completeness for every CIP cycle when automated data capture and compliance documentation is implemented

Why CIP Verification and Analytics Matter for Food Safety

Clean-in-Place systems are the most critical sanitation asset in any liquid or wet food processing facility. A CIP system that fails to deliver the specified chemical concentration, temperature, flow rate, or contact time for even a single cycle can leave microbiological residues on product contact surfaces that contaminate the next production run. The financial impact of a single CIP failure in a dairy, beverage, or liquid food plant includes product recall costs that can exceed $10 million, regulatory fines, production downtime of 24 to 72 hours for manual cleaning and re-validation, and brand reputation damage that persists for years. The FDA Food Safety Modernization Act Preventive Controls rule mandates that sanitation procedures — including CIP cycle parameters — be validated, monitored, and documented as part of the facility's food safety plan. CIP verification analytics transforms the sanitation process from a time-based procedure that is assumed to be effective into a data-driven process that is proven to be effective for every cycle, every day, every year.

The economics of CIP optimization are equally compelling. A typical food processing plant with 20 to 50 CIP circuits operating 1 to 3 cycles per day consumes 500,000 to 2 million gallons of water and 50,000 to 200,000 pounds of caustic and acid cleaning chemicals annually. A 20 percent reduction in water and chemical consumption through analytics-based cycle optimization saves $50,000 to $250,000 per year in direct material costs, plus additional savings in wastewater treatment, heating energy, and labor. The CIP verification checklist provides the measurement framework that identifies every over-engineered cycle, every under-performing cleaning event, and every equipment degradation that compromises cleaning effectiveness or wastes resources.

The CIP Verification Checklist: Eight Audit Domains

The complete CIP system verification and analytics checklist covers eight domains. Each domain contains specific checklist items with measurement criteria, acceptance thresholds, and corrective action guidelines. The checklist is designed to be executed by sanitation supervisors and maintenance technicians, with data captured automatically through CIP system sensors and manually through inspection and sampling where sensor data is not available.

Domain 1: Chemical Concentration and Dosing Verification
Checklist Item
Acceptance Criteria
Caustic/acid concentration at supply header
Concentration within +/- 0.5% of target as measured by conductivity or titration; dosing pump calibration verified within 90 days
Return solution conductivity profile
Return conductivity stabilizes within 2 minutes of detergent arrival at return sensor; final rinse conductivity below 50 microsiemens/cm or within 10% of incoming water
Chemical tank inventory and concentration
Bulk chemical concentration verified by supplier COA and quarterly lab analysis; tank level monitored with low-level alarm activated at 20% remaining
Domain 2: Flow Rate and Velocity Verification
Checklist Item
Acceptance Criteria
Supply flow rate during wash phases
Flow rate maintained within +/- 5% of design target; minimum velocity of 5 ft/sec in supply piping and 3 ft/sec in return piping to ensure turbulent flow
Flow rate during rinse and final rinse
Rinse flow rate within +/- 10% of design target; no dead legs or low-flow branches identified; pressure differential across circuit within normal range
Pump performance and motor amperage
CIP supply pump amp draw within 10% of baseline at design flow; no cavitation noise or vibration; pump seal flush flow verified
Domain 3: Temperature Profiling and Heat Transfer
Checklist Item
Acceptance Criteria
Wash solution temperature at supply header
Temperature within +/- 5 F of target; heat exchanger outlet temperature stable within 3 F during wash phase; no temperature drop exceeding 10 F across circuit
Return solution temperature profile
Return temperature within 15 F of supply temperature; temperature recovery after heat exchanger verified; no cold spots indicated by rapid temperature drop at return sensor
Heat exchanger performance
Heat exchanger approach temperature within 10 F of design; steam trap operation verified; condensate return temperature within specification; plate or tube bundle inspected annually
Domain 4: Contact Time and Cycle Sequencing
Checklist Item
Acceptance Criteria
Wash phase contact time
Contact time measured from detergent arrival at return sensor to start of intermediate rinse; duration within +/- 2 minutes of validated cycle specification
Intermediate and final rinse duration
Rinse duration sufficient to achieve return conductivity within 10% of incoming water; final rinse minimum 2 minutes after conductivity target reached
Cycle phase transition verification
All phase transitions logged with timestamp and duration; no skipped phases; no premature phase advancement; automatic abort on deviation outside acceptance window
Domain 5: Return Solution Analytics and Soil Load
Checklist Item
Acceptance Criteria
Return solution turbidity and soil load
Return turbidity measured at 5-minute intervals during wash phase; peak soil load within expected range for product type; turbidity declining trend before end of wash phase
Return solution pH and conductivity
Caustic wash return pH above 12; acid wash return pH below 3; conductivity differential between supply and return within 15% (indicating minimal soil dilution)
Solution recovery and reuse monitoring
Recovered solution conductivity, pH, and turbidity verified before reuse; solution age tracked and discarded at maximum cycles per specification; fresh solution make-up logged
Domain 6: Spray Devices and Mechanical Action
Checklist Item
Acceptance Criteria
Spray ball and spray device coverage
Spray pattern covers all vessel and tank interior surfaces; no blocked orifices; spray ball rotation verified for rotating devices; coverage test within 12 months
Spray device pressure and flow
Supply pressure at spray device within manufacturer's specified range; flow rate per device within 10% of design; no pressure loss indicating blocked supply line
Spray device inspection and replacement
All spray devices inspected annually for wear, corrosion, and blockage; replacement on 3-year cycle or per manufacturer recommendation; inspection records in CMMS
Domain 7: Equipment Integrity and CIP Circuit Condition
Checklist Item
Acceptance Criteria
CIP piping and valve condition
No visible corrosion, pitting, or product build-up in piping; valve seats sealing correctly with no leakage; no dead legs exceeding 1.5 pipe diameters in length
Heat exchanger and tank surface condition
Heat exchanger plates or tubes free of scale and fouling; tank interior surfaces free of pitting, cracks, or rough welds; surface roughness below 0.8 micrometers Ra for product contact surfaces
Gasket and seal integrity
All gaskets in CIP circuit intact with no visible degradation, cracking, or compression set; gasket replacement on 2-year schedule or per manufacturer recommendation; material FDA-compliant
Domain 8: Compliance Documentation and Audit Trail
Checklist Item
Acceptance Criteria
Cycle data capture and storage
All cycle parameters logged automatically: chemical concentration and temperature at 1-minute intervals, flow rate and conductivity at 30-second intervals; data retained for minimum 3 years
Deviation and exception reporting
Any cycle parameter outside acceptance window automatically flagged with deviation code; root cause investigation completed within 72 hours; corrective action logged with closure date
CIP validation and re-validation schedule
Initial validation protocol on file for each CIP circuit; re-validation within 12 months of any equipment modification affecting cleaning; annual review of cycle performance trends
"

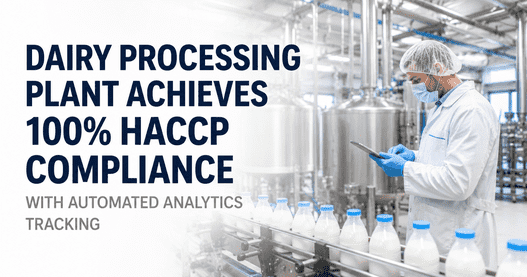
When we implemented CIP analytics across 42 circuits in our dairy processing plant, the first month of data revealed that 12 percent of our caustic wash cycles were running at concentrations below the validated minimum, and 18 percent of our final rinse cycles were terminating before the return conductivity had stabilized within 10 percent of incoming water. We were operating under the assumption that our CIP system was validated and reliable, but the analytics showed that we had systemic issues with chemical dosing pump calibration drift and conductivity sensor response time. Correcting those two issues alone increased our first-pass cleaning validation rate from 94 percent to 99.2 percent, reduced chemical consumption by 22 percent, and eliminated three product hold events per year that had been costing us an average of $180,000 per event in lab testing, production delay, and finished product disposal.

— Director of Quality and Food Safety, Regional Dairy Processing Cooperative — 42-Circuit CIP Analytics Implementation Results

Common CIP Verification Failures Identified by Analytics

The CIP verification analytics checklist routinely identifies six categories of failures that compromise cleaning effectiveness or waste resources. Each category has a characteristic signature in the analytics data that the checklist is designed to detect.

Chemical Concentration Drift

Dosing pump calibration drifts over time, causing caustic or acid concentration to fall below the validated minimum for cleaning effectiveness. Analytics detects low concentration through conductivity sensor trending and comparison against the concentration setpoint. Corrective action: recalibrate dosing pumps per manufacturer schedule (typically quarterly). Install online conductivity sensors with automated concentration verification that alerts the sanitation team when concentration deviates by more than 0.3 percent from target. iFactory's compliance platform tracks concentration trends by circuit and generates recalibration work orders automatically based on calibration due date or concentration drift rate.

Flow Rate Degradation

CIP supply pump wear, partially closed valves, or fouling in the circuit piping reduces flow rate below the turbulent flow threshold (5 ft/sec supply, 3 ft/sec return). Reduced flow decreases the mechanical scrubbing action of the cleaning solution on product contact surfaces. Analytics detects flow degradation through supply and return flow meter trending and pump motor amp draw monitoring. Corrective action: inspect pump impeller and wear rings, verify valve position, and perform circuit pressure drop test to identify restricted sections. iFactory's analytics platform generates a circuit resistance trend and alerts maintenance when flow rate drops below 95% of baseline.

Temperature Loss Across Circuit

Excessive temperature drop between the supply header and the return sensor indicates inadequate insulation, heat loss through uninsulated piping sections, or a heat exchanger that is not maintaining setpoint. Temperature drop above 15 F can reduce the chemical reaction rate of the cleaning solution, compromising soil removal effectiveness on protein, fat, and carbohydrate residues. Analytics detects temperature loss through continuous comparison of supply and return temperature trends. Corrective action: insulate uninsulated piping, inspect heat exchanger for fouling, verify steam supply pressure and temperature to the CIP heat exchanger. iFactory tracks temperature differential by circuit and alerts when the drop exceeds the acceptance threshold.

Conductivity Deviation in Return

Return conductivity that fails to stabilize within the expected time window indicates that detergent is not reaching all parts of the circuit, that there is excessive soil load diluting the detergent, or that the rinse is not fully removing chemical residue. Analytics detects conductivity deviation through comparison of the actual conductivity curve against the validated baseline curve for each circuit. Corrective action: verify circuit valve alignment, inspect spray devices for blockage, and confirm that all circuit branches are receiving flow. iFactory's platform models the expected conductivity curve for each CIP circuit and flags any cycle where the curve deviates by more than two standard deviations from the validated baseline.

Implementing CIP Verification Analytics with iFactory

iFactory's compliance and audit trail management platform provides the integrated data capture, analytics, and documentation infrastructure that transforms CIP verification from a manual checklist into an automated, continuous verification system. The platform integrates with CIP system PLCs, conductivity sensors, flow meters, temperature probes, and chemical dosing controllers to capture every cycle parameter at 30-second to 1-minute intervals. The analytics engine compares each cycle against the validated baseline for the specific CIP circuit and product type, automatically flagging any deviation from the accepted parameter range and generating a deviation report with root cause analysis and corrective action tracking.

The platform's compliance module automatically generates the complete audit trail required for FDA FSMA, 3-A Sanitary Standards, SQF, BRC, and GFSI certification audits. Every CIP cycle is documented with time-stamped parameter data, deviation flags, corrective action records, and operator sign-off in a format that satisfies regulatory requirements. The shift logbook feature enables sanitation operators to document pre-CIP equipment inspections, chemical tank inventory checks, and post-CIP visual inspections during their rounds, creating a permanent, tamper-evident record of sanitation verification that is directly accessible from the compliance dashboard. Book a demo to see how iFactory's CIP verification platform integrates with your existing CIP control system, or talk to an expert about implementing automated CIP analytics and compliance documentation for your food, beverage, or pharmaceutical processing facility.

Frequently Asked Questions

CIP validation — the initial documented proof that the cleaning cycle consistently achieves the defined cleaning standard — should be performed when a new CIP circuit is installed, when a product formulation change affects soil composition, when a significant equipment modification is made to the circuit, or when the validated cycle parameters are changed. Re-validation is recommended every 12 months or whenever trend data indicates a decline in cleaning performance. Verification — the ongoing monitoring and documentation that each cycle meets the validated parameters — should be performed for every CIP cycle through automated data capture of chemical concentration, temperature, flow rate, contact time, and return conductivity. Automated verification is continuous; manual verification checks such as titration, temperature reading, and visual inspection should be performed at least monthly per circuit. iFactory's platform automates both continuous verification data capture and the periodic validation record-keeping required to demonstrate regulatory compliance. Talk to an expert about setting up a CIP validation and verification schedule for your facility.

The most common cause of CIP cycle failure is inadequate flow rate resulting in insufficient turbulent flow to create the mechanical scrubbing action needed to remove soil from product contact surfaces. Flow rate degradation is typically caused by pump wear (impeller clearance increase, worn wear rings), partially closed or failed-open valves, or fouling deposits accumulating inside the circuit piping. The second most common cause is chemical concentration drift caused by dosing pump calibration drift, which can go undetected for weeks or months in facilities that rely on manual titration checks performed weekly or monthly. The third most common cause is temperature loss across the circuit caused by heat exchanger fouling, undersized heating capacity for the current flow rate, or uninsulated piping sections that allow heat loss in cold processing areas. iFactory's analytics platform monitors all three parameters continuously and generates alerts when any parameter approaches the deviation threshold, enabling corrective action before the cycle fails. Book a demo to see how iFactory detects CIP parameter deviations in real time.

Return conductivity profiling provides real-time verification that the cleaning solution has reached every part of the CIP circuit and that the rinse phase has effectively removed chemical residues. The conductivity curve during the wash phase — measured from the time detergent first appears at the return sensor until the conductivity stabilizes at the target concentration — indicates whether detergent is flowing through all circuit branches at the correct rate. A delayed stabilization time, a lower-than-expected stabilized conductivity, or erratic conductivity fluctuations during the wash phase all indicate specific problems such as air pockets, partially blocked spray devices, or dilution from residual water in the circuit. During the rinse phase, the rate at which conductivity decreases to the target level indicates the effectiveness of the rinse in removing chemical residues. A slow decline or a failure to reach the target conductivity indicates incomplete rinsing, which can leave chemical residues on product contact surfaces that cause off-flavors, regulatory non-compliance, or allergic reaction risks. iFactory's platform captures the complete conductivity curve for each cycle and compares it against the validated baseline curve, generating an automatic flag when the actual curve deviates from the expected shape. Talk to an expert about implementing return conductivity profiling for your CIP circuits.

iFactory's compliance and audit trail management platform automatically captures and stores every CIP cycle parameter in a tamper-evident format that satisfies FDA FSMA, 3-A Sanitary Standards, SQF, BRC, and GFSI audit requirements. The platform records cycle identification data, chemical concentration and temperature at 1-minute intervals, flow rate and conductivity at 30-second intervals, phase transition timing, any deviation flags and corrective action records, and operator identification for each cycle. Compliance reports can be generated on demand for any date range, CIP circuit, or product type, eliminating the manual data gathering from spreadsheets, paper log sheets, and PLC trend screens that typically requires 30 to 60 hours of preparation time per regulatory or certification audit. The shift logbook feature creates a permanent record of operator CIP pre-checks, chemical inventory verification, post-CIP inspections, and spray device inspections that satisfies the documentation requirements for preventive controls verification under FSMA. Book a demo to see how iFactory automates CIP compliance documentation for regulatory audits.

CIP cycle analytics reduces chemical and water consumption by identifying three types of waste: over-dosing, over-duration, and over-frequency. Over-dosing occurs when the chemical dosing system delivers more caustic or acid than the validated target concentration. Analytics detects over-dosing through continuous conductivity monitoring and enables the facility to tighten the concentration control band from +/- 1.0 percent (typical for manual titration-based control) to +/- 0.3 percent (achievable with automated conductivity-based control), reducing chemical consumption by 10 to 15 percent. Over-duration occurs when the wash or rinse phase runs longer than necessary because the cycle timer is set with a safety margin to account for variability in the validated cleaning time. Analytics enables demand-based phase termination — ending the wash phase when the return conductivity stabilizes and ending the rinse phase when the return conductivity reaches the target value — which typically reduces cycle duration by 15 to 25 percent, saving water, chemical, and heating energy. Over-frequency occurs when a CIP circuit is cleaned more frequently than needed because the cleaning interval is based on a conservative time schedule rather than actual production conditions. Analytics enables the facility to extend cleaning intervals based on measured soil load trends, product changeover patterns, and microbiological testing results, reducing the number of CIP cycles per week by 10 to 20 percent while maintaining or improving cleaning effectiveness. iFactory's analytics platform models the cost and effectiveness trade-offs of each cycle optimization strategy and recommends the parameter changes that achieve the target reduction without compromising the validated cleaning standard. Talk to an expert about implementing CIP cycle optimization in your facility.

Conclusion

Clean-in-Place system verification is not optional in food, beverage, dairy, and pharmaceutical processing. The financial, regulatory, and brand reputation consequences of a single CIP failure — measured in product recall costs, regulatory fines, production downtime, and consumer health risk — far exceed the investment required to implement comprehensive CIP verification analytics. The eight-domain verification checklist described in this guide provides the audit framework that sanitation supervisors, quality assurance teams, and maintenance engineers need to verify that every CIP cycle delivers the specified cleaning result, every day, for every circuit.

The facilities that implement CIP verification analytics with automated data capture, continuous parameter monitoring, deviation detection, and compliance documentation consistently achieve 99.5 percent or higher first-pass cleaning validation rates, 15 to 30 percent reduction in chemical and water consumption, and a complete, audit-ready compliance record for every cycle.

iFactory provides the integrated CIP verification platform that turns the eight-domain checklist from a manual inspection form into an automated, continuously verifying, and compliance-ready sanitation management system. Book a demo to see how iFactory can help your facility implement CIP verification analytics, or talk to an expert about starting your CIP analytics program today.

Every CIP Cycle Must Be Verified. iFactory Automates the Verification and Documents the Proof.
From eight-domain CIP verification checklists and real-time chemical concentration monitoring to deviation detection, root cause analysis, and automated FSMA compliance documentation — iFactory provides the unified platform that turns CIP from a scheduled procedure into a continuously verified, data-driven sanitation process.

Share This Story, Choose Your Platform!